. 2022 Aug 8;40(8):835-849.e8.
doi: 10.1016/j.ccell.2022.06.010. Epub 2022 Jul 14.

Pan-cancer proteomic map of 949 human cell lines

Affiliations

Pan-cancer proteomic map of 949 human cell lines

Emanuel Gonçalves et al. Cancer Cell. .

Abstract

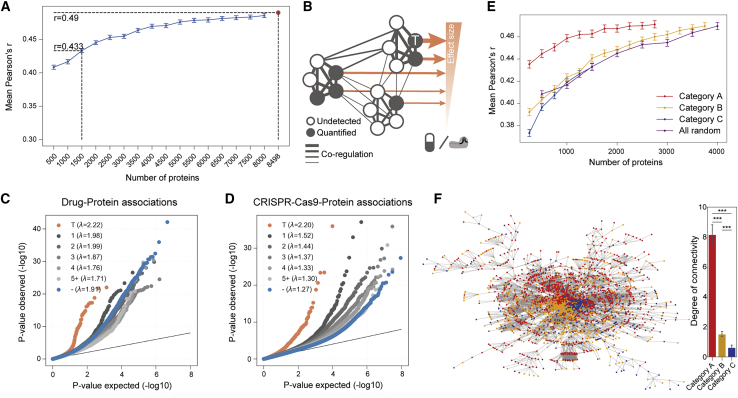
The proteome provides unique insights into disease biology beyond the genome and transcriptome. A lack of large proteomic datasets has restricted the identification of new cancer biomarkers. Here, proteomes of 949 cancer cell lines across 28 tissue types are analyzed by mass spectrometry. Deploying a workflow to quantify 8,498 proteins, these data capture evidence of cell-type and post-transcriptional modifications. Integrating multi-omics, drug response, and CRISPR-Cas9 gene essentiality screens with a deep learning-based pipeline reveals thousands of protein biomarkers of cancer vulnerabilities that are not significant at the transcript level. The power of the proteome to predict drug response is very similar to that of the transcriptome. Further, random downsampling to only 1,500 proteins has limited impact on predictive power, consistent with protein networks being highly connected and co-regulated. This pan-cancer proteomic map (ProCan-DepMapSanger) is a comprehensive resource available at https://cellmodelpassports.sanger.ac.uk.

Keywords: CRISPR-Cas9; cancer; cancer vulnerability; cell line; drug response; gene essentiality; mass spectrometry; proteomics.


Conflict of interest statement

Declaration of interests M.J.G. has received research funding from AstraZeneca, GSK, Astex Therapeutics, and Open Targets, a public-private initiative involving academia and industry, and is a co-founder of Mosaic Therapeutics. All other authors declare no competing interests.

Figures

None
Graphical abstract
Figure 1
Figure 1
A pan-cancer proteomic map of 949 human cancer cell lines (A) Methodology overview for pan-cancer characterization of 949 human cell lines using a DIA-MS workflow. (B) Proteomic measurements were integrated with independent molecular and phenotypic datasets spanning 1,303 cancer cell lines as part of the Cell Model Passports Database. Data include proteomics (ProCan-DepMapSanger) presented here, transcriptomics, drug response (Sanger), mutation, copy number, methylation, drug response (CTD2), CRISPR-Cas9 gene essentiality (Broad&Sanger), drug response (PRISM), and proteomics (CCLE). Each gray slice denotes a unique cell line, and the total number of cell lines per dataset is indicated. The proteomic data (ProCan-DepMapSanger) generated in this study are shown in orange, as well as the expanded drug response (Sanger) dataset. (C) Number of drugs included in the drug response (Sanger) screen, with the orange bar highlighting the additional number of unique drugs presented in this study compared to previous studies. Drugs are grouped by the pathway of their canonical targets. (D) Pearson’s correlations of the proteomes for each set of six technical replicates, as well as each cancer type, tissue type, batch and instrument. Random indicates the correlation between random unmatched sets of replicates. Median Pearson’s r for each group is reported. Box-and-whisker plots indicate interquartile range (IQR) with a line at the median. Whiskers represent the minimum and maximum values at 1.5 × IQRs. See also Figure S1, Tables S1 and S2.
Figure 2
Figure 2
Distinct proteomic profiles according to cell type (A) Proteomic data dimensionality reduction by UMAP, with cell lines colored by tissue. (B) UMAP of hematopoietic and lymphoid cell lines colored by cell lineage. (C) Heatmap of the frequency of cell type-enriched proteins observed within each tissue. Tissues and proteins are clustered on the vertical and horizontal axes, respectively. (D) Number of cell type-enriched proteins identified in each tissue type represented by more than 10 cell lines. (E) Median RNA-protein correlation of cell type-enriched proteins against all other proteins with more than 10 observations in that tissue type. Only tissues with at least five cell type-specific proteins are shown. See also Table S3.
Figure 3
Figure 3
Post-transcriptional regulatory mechanisms of cancer cell lines (A) Identification of shared variability (factors) from MOFA across multiple molecular and phenotypic cancer cell line datasets. Hematopoietic and lymphoid cells are grouped and trained separately from the other cell lines. The upper two heatmaps (blue) report the portion of variance explained by each factor (columns) in each dataset. The central (yellow) heatmap reports Pearson’s r between each learned factor and various molecular characteristics of the cancer cell lines. The lower heatmap shows gene set enrichment analysis (GSEA) enrichment scores of each factor to cell type-specific proteins. (B) Separation of cancer cell lines by MOFA factors 1 and 2, colored by tissue of origin (left) and by EMT canonical marker vimentin (VIM) protein intensities (right). (C) Scatterplot with linear regression between MOFA factor 12 and BRAF CRISPR-Cas9 gene essentiality scores. Skin cancer cell lines are highlighted in red, and BRAF mutant cell lines are marked with a cross. (D) Similar to (C), but instead the vertical axis indicates the dabrafenib drug response (IC50) measurements. (E) Pearson’s r between gene absolute copy number profiles with transcriptomics (horizontal axis) and with protein intensities from the ProCan-DepMapSanger dataset (vertical axis). Representative Comprehensive Resource of Mammalian Protein Complexes (CORUM) protein complexes with the highest differences between the Pearson’s r are shown, and the top 15 most attenuated proteins from these complexes are labeled. N indicates the number of proteins in each protein complex. Box-and-whisker plots represent the Pearson’s r distributions of proteins involved in each highlighted gene ontology term compared with all proteins (gray). (F) Volcano plot showing differential protein intensities between cell lines that are wild type versus mutant for each protein in the ProCan-DepMapSanger dataset that is mutated in at least 1% of the cohort. The top 10 proteins by p value are annotated. The horizontal axis shows the –log10 of the empirical Bayes moderated t test p value, and proteins with FDR of less than 5% are colored in red. (G) Recall of PPIs, i.e., ability to detect known PPIs, from resources CORUM, STRING, BioGRID, and HuRI. All possible protein pairwise correlations (Pearson’s p value) were ranked, using proteomics, transcriptomics, and CRISPR-Cas9 gene essentiality. The merged score was defined as the product of the p values of the different correlations. In (C), (D), and (E), box-and-whisker plots indicate interquartile range (IQR) with a line at the median. Whiskers represent the minimum and maximum values at 1.5 × the IQRs. See also Figure S2 and Table S4.
Figure 4
Figure 4
Biomarkers for cancer vulnerabilities (A) Significant linear regression associations (FDR < 5%) between protein measurements and drug responses (left) and protein measurements and CRISPR-Cas9 gene essentiality scores (right). Each association is represented using the linear regression effect size (beta) and its statistical significance (log ratio test), and colored according to the distance between the target of the drug or CRISPR-Cas9 and the associated protein in a PPI network assembled from STRING. T denotes the associated protein is either a canonical target of the drug or the CRISPR-Cas9 reagents; numbers represent the minimal number of interactions separating the drug or CRISPR-Cas9 targets to the associated proteins; and the symbol ‘-’ denotes associations for which no path was found. Representative examples are labeled. (B) Representative top-ranked CRISPR-Cas9-protein and drug-protein associations. The top shows ERBB2 protein intensities associated with CRISPR-Cas9 gene essentiality, where cell lines with ERBB2 amplifications are highlighted in orange. The bottom shows the association between AZD6094 MET inhibitor and MET protein intensities, where MET amplified cell lines are highlighted in orange. Box-and-whisker plots indicate interquartile range (IQR) with a line at the median. Whiskers represent the minimum and maximum values at 1.5 × IQRs. (C) Overview of the DeeProM workflow: (i) deep learning models of DeepOmicNet were trained to predict drug responses and CRISPR-Cas9 gene essentialities, prioritizing those that are best predicted by proteomic profiles; and (ii) Fisher-Pearson coefficient of skewness was calculated to identify drug responses and CRISPR-Cas9 gene essentialities that selectively occur in subsets of cancer cell lines. The selected candidates from (i) and (ii) are illustrated by the gray box. (iii) Linear regression models were fitted to identify significant associations between protein biomarkers, drug responses and CRISPR-Cas9 gene essentialities. (iv) Filtering algorithms were applied to further identify tissue-specific cancer vulnerabilities. See also Figure S3 and Table S5.
Figure 5
Figure 5
Protein biomarkers identified by DeeProM (A) Predictive performance and selectivity of all drug responses (left) and CRISPR-Cas9 gene essentialities (right) across 947 and 534 cancer cell lines, respectively. Data points toward the top left corner of each plot indicate drug responses or gene essentialities that are both selective and well predicted. Top selective drugs and CRISPR-Cas9 gene essentialities are labeled. (B) Top significant protein associations with FOXA1 CRISPR-Cas9 gene essentiality scores, each bar representing the statistical significance (log ratio test) of the linear regression, and below the effect size (beta). The minimal distance of PPIs in the STRING network between FOXA1 and each protein is annotated in each respective bar and color coded according to the description in Figure 4A. (C) Association between FOXA1 CRISPR-Cas9 gene essentiality scores and BSG protein intensities. Breast cancer cell lines are highlighted and sub-classified using the PAM50 gene expression signature (Parker et al., 2009). Box-and-whisker plots indicate the PAM50 subtypes of breast cancers. Pearson’s r (r), p value (p), and number of observations/cell lines (N) within each PAM50 type is provided; for “normal” subtype no correlation was performed considering N is 1. These plots indicate interquartile range (IQR) with a line at the median. Whiskers represent the minimum and maximum values at 1.5 × IQRs. (D and E) Representative examples of tissue-specific associations between drug responses and protein markers for cell lines derived from bone (green; all other cell lines are shown in gray). The number of cell lines and Pearson’s r from the highlighted tissue type are annotated at the top right and bottom left corners, respectively. The dashed line represents the maximum concentration used in the drug response screens. (D) The GSK1070916-PPIH association in bone supported by the ProCan-DepMapSanger proteomic dataset. (E) Similar to (D), instead showing data for the drug alisertib. See also Figure S3 and S4; Table S5.
Figure 6
Figure 6
Evaluation of the predictive power of DeepOmicNet for multi-omic datasets (A and B) Distribution of the predictive power (mean Pearson’s r between predicted and observed IC50 values) of DeepOmicNet, comparing ProCan-DepMapSanger to an independent proteomic dataset (CCLE), using cell lines in common between the two datasets. Plots show prediction of (A) drug responses (N represents the total number of drugs tested; n = 290 cell lines) and (B) CRISPR-Cas9 gene essentialities (n = 234 cell lines). (C) Two-dimensional density plots showing the predictive power of DeepOmicNet in predicting drug responses (left) and CRISPR-Cas9 gene essentiality profiles (right) using protein (horizontal axis) and transcript (vertical axis) measurements. Each data point denotes the Pearson’s r between predicted and observed measurements for each drug or CRISPR-Cas9 gene essentialities. (D) Similar to (A), distribution of the predictive power of three machine learning models using either proteomic or transcriptomic measurements to train and predict drug responses (Sanger dataset). (E) Cumulative distribution function of the Pearson’s r of all pairwise protein-protein correlations compared with transcriptomics and CRISPR-Cas9 gene essentiality measurements. See also Figure S5.
Figure 7
Figure 7
Proteomic support for a network pleiotropy model (A) Comparison of the predictive power of DeepOmicNet trained with randomly downsampled sets of proteins. The dots indicate the means and vertical lines represent 95% confidence intervals derived from 10 iterations of random downsampling. The red point represents the full predictive power using all of 8,498 quantified proteins. (B) Schematic diagram depicting protein network pleiotropy with widespread protein associations with responses to either drugs or CRISPR-Cas9, and demonstrating the strongly co-regulated nature of protein networks. Nodes represent proteins that could be either quantified or are undetected, where T represents a protein target of a drug or CRISPR-Cas9 gene essentialities. Edges showcase putative interactions, with high correlation coefficients between proteins depicted by thicker edges. Orange arrows represent the variability explained by that protein for the cancer cell line’s response to a drug or CRISPR-Cas9 gene perturbation. The size of the arrow is proportional to the variance explained. (C and D) Quantile-quantile plots of protein associations with (C) drug responses and (D) CRISPR-Cas9 gene essentiality profiles. Protein associations are grouped and colored by their distances from the drugs or CRISPR-Cas9 targets using the STRING protein interaction network, where ‘-’ and the blue circles denote associations for which no link in the protein network could be found between the protein and the drug or CRISPR target. The p values were calculated in likelihood ratio tests on all parameters of the linear regression models. Annotation is as described in Figure 4A. For each group, the p value distribution inflation factor lambda, λ, was calculated using the median method (Aulchenko et al., 2007). (E) Comparison of the predictive power of DeepOmicNet models trained with subsets of Category A, B and C proteins (per Figure S5F) comprising randomly downsampled sets of proteins. The dots indicate the means and vertical lines represent 95% confidence intervals derived from 10 iterations of random samplings. (F) The STRING protein interaction network diagram (left), with proteins colored according to category. The bar chart (right) shows the network connectivity for these proteins, where degree represents the number of other proteins connected to a given protein according to the STRING PPI network. ∗∗∗p < 0.001 by unpaired t test. Error bars represent 95% confidence intervals. See also Figure S5.

References

    1. Argelaguet R., Arnol D., Bredikhin D., Deloro Y., Velten B., Marioni J.C., Stegle O. MOFA+: a statistical framework for comprehensive integration of multi-modal single-cell data. Genome Biol. 2020;21:111. - PMC - PubMed
    1. Argelaguet R., Velten B., Arnol D., Dietrich S., Zenz T., Marioni J.C., Buettner F., Huber W., Stegle O. Multi-omics factor Analysis-a framework for unsupervised integration of multi-omics data sets. Mol. Syst. Biol. 2018;14:e8124. - PMC - PubMed
    1. Aulchenko Y.S., Ripke S., Isaacs A., van Duijn C.M. GenABEL: an R library for genome-wide association analysis. Bioinformatics. 2007;23:1294–1296. - PubMed
    1. Barretina J., Giordano C., Stransky N., Venkatesan K., Margolin A.A., Kim S., Wilson C.J., Lehár J., Kryukov G.V., Sonkin D., et al. The Cancer Cell Line Encyclopedia enables predictive modelling of anticancer drug sensitivity. Nature. 2012;483:603–607. - PMC - PubMed
    1. Behan F.M., Iorio F., Picco G., Gonçalves E., Beaver C.M., Migliardi G., Santos R., Rao Y., Sassi F., Pinnelli M., et al. Prioritization of cancer therapeutic targets using CRISPR-cas9 screens. Nature. 2019;568:511–516. - PubMed

Publication types