. 2022;14(4):841-876.
doi: 10.1016/j.jcmgh.2022.06.011. Epub 2022 Jul 14.

Elafin Reverses Intestinal Fibrosis by Inhibiting Cathepsin S-Mediated Protease-Activated Receptor 2

Affiliations

Elafin Reverses Intestinal Fibrosis by Inhibiting Cathepsin S-Mediated Protease-Activated Receptor 2

Ying Xie et al. Cell Mol Gastroenterol Hepatol. 2022.

Abstract

Background & aims: More than half of Crohn's disease patients develop intestinal fibrosis-induced intestinal strictures. Elafin is a human protease inhibitor that is down-regulated in the stricturing intestine of Crohn's disease patients. We investigated the efficacy of elafin in reversing intestinal fibrosis and elucidated its mechanism of action.

Methods: We developed a new method to mimic a stricturing Crohn's disease environment and induce fibrogenesis using stricturing Crohn's disease patient-derived serum exosomes to condition fresh human intestinal tissues and primary stricturing Crohn's disease patient-derived intestinal fibroblasts. Three mouse models of intestinal fibrosis, including SAMP1/YitFc mice, Salmonella-infected mice, and trinitrobenzene sulfonic acid-treated mice, were also studied. Elafin-Eudragit FS30D formulation and elafin-overexpressing construct and lentivirus were used.

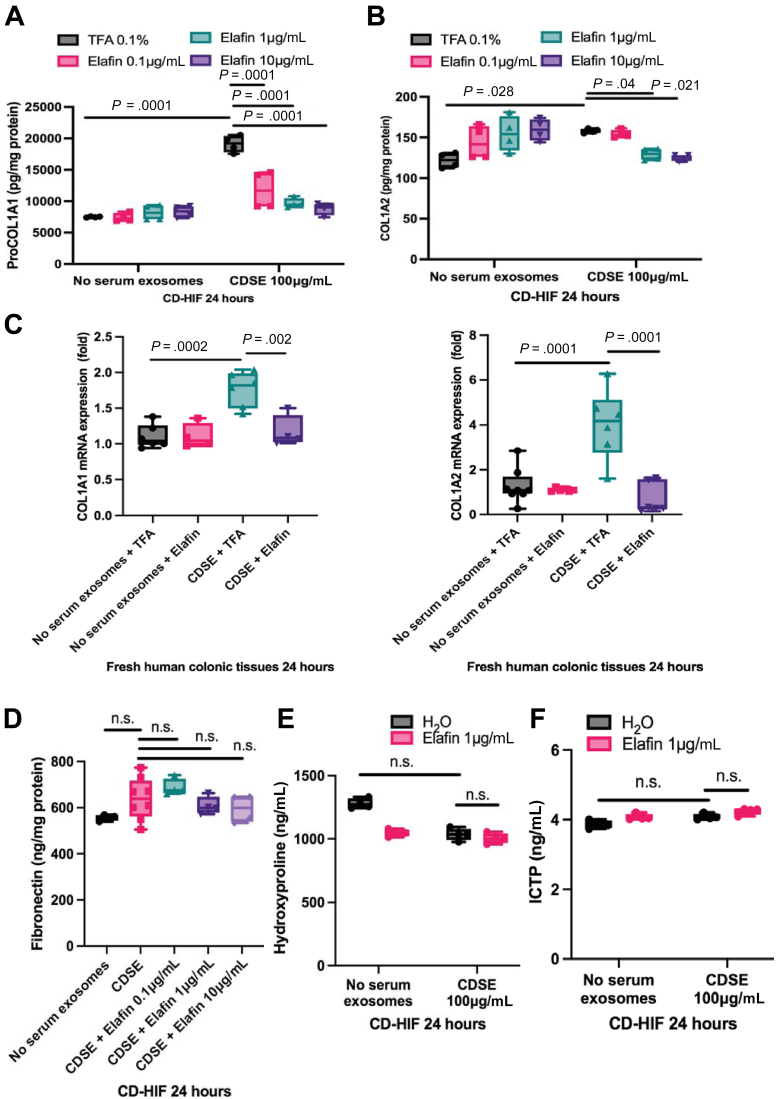
Results: Elafin reversed collagen synthesis in human intestinal tissues and fibroblasts pretreated with Crohn's disease patient-derived serum exosomes. Proteome arrays identified cathepsin S as a novel fibroblast-derived pro-fibrogenic protease. Elafin directly suppressed cathepsin S activity to inhibit protease-activated receptor 2 activity and Zinc finger E-box-binding homeobox 1 expression, leading to reduced collagen expression in intestinal fibroblasts. Elafin overexpression reversed ileal fibrosis in SAMP1/YitFc mice, cecal fibrosis in Salmonella-infected mice, and colonic fibrosis in trinitrobenzene sulfonic acid-treated mice. Cathepsin S, protease-activated receptor 2 agonist, and zinc finger E-box-binding homeobox 1 overexpression abolished the anti-fibrogenic effect of elafin in fibroblasts and all 3 mouse models of intestinal fibrosis. Oral elafin-Eudragit FS30D treatment abolished colonic fibrosis in trinitrobenzene sulfonic acid-treated mice.

Conclusions: Elafin suppresses collagen synthesis in intestinal fibroblasts via cathepsin S-dependent protease-activated receptor 2 inhibition and decreases zinc finger E-box-binding homeobox 1 expression. The reduced collagen synthesis leads to the reversal of intestinal fibrosis. Thus, modified elafin may be a therapeutic approach for intestinal fibrosis.

Keywords: Fibrosis; Protease; Receptor.


Figures

None
Graphical abstract
Figure 1
Figure 1
(A and B) Primary stricturing CD patient-derived intestinal fibroblasts (CD-HIF) were pretreated with or without 100 μg/mL stricturing Crohn’s disease patients’ serum exosomes (CDSE). Two hours later, elafin was added and further incubated for 24 hours. n = 4 patients; 4 independent experiments. Ordinary one-way ANOVA with Tukey test. (C) Fresh human colonic tissues from 4 colon cancer patients were incubated in serum-free RPMI1640 medium with or without 100 μg/mL CDSE. Two hours later, elafin (1 μg/mL) was added and incubated for 24 hours. n = 6 patients. Ordinary one-way ANOVA with Tukey test. (D–F) Primary stricturing CD-HIF were pretreated with or without 100 μg/mL CDSE. Two hours later, elafin was added and further incubated for 24 hours. ProCOL1A1, COL1A2, and fibronectin in cell lysates and hydroxyproline and C-telopeptide of type I collagen/ICTP in conditioned media were determined by ELISA. n = 4 patients; 4 independent experiments. Ordinary one-way ANOVA with Tukey test.
Figure 2
Figure 2
(A) Extracellular matrix (ECM) contraction assay. Human colonic CCD-18Co fibroblasts were embedded in 100 μL/well of Matrigel (Corning #356234) and covered by 1 mL/well serum-free minimal essential medium (MEM). TGF-β1 (10 ng/mL) and elafin (1 μg/mL) were added to the medium on day 0. The diameter of the Matrigel was measured on day 9. TGF-β1 treatment significantly reduced the Matrigel diameter, indicating increased ECM stiffness. Shrinkage was unaffected by elafin. Results were pooled from 3 independent experiments. Ordinary one-way ANOVA with Tukey test. (B) Human colonic CCD-18Co fibroblasts were treated with elafin for 48 hours, followed by addition of MTS assay reagent (G5421; Promega, Madison, WI). Absorbance was determined at 490 nm. Results were pooled from 4 independent experiments. Ordinary one-way ANOVA with Tukey test. (C) Serum-starved primary human colonic epithelial cells were pretreated with TGF-β1 (10 ng/mL) or CDSE (100 μg/mL) for 2 hours and then incubated with elafin for 48 hours. N-cadherin, ZEB1, and COL1A2 mRNA expression was determined by real-time reverse transcription polymerase chain reaction. TGF-β1, but not CDSE, induced N-cadherin, ZEB1, and COL1A2 mRNA expression, unaffected by elafin. Results were pooled from 4 independent experiments. Ordinary one-way ANOVA with Tukey test.
Figure 3
Figure 3
(A, left panel) Serum-starved CD-HIF were treated with 100 μg/mL CDSE for 2 hours. Serum-starved CCD-18Co colonic fibroblasts were treated with 10 ng/mL TGF-β1 for 2 hours. Conditioned media were loaded to Proteome Profiler Human Protease Arrays (ARY021B; R&D Systems). A Bio-Rad ChemiDoc Imaging system captured the images. The rectangles highlighted the cathepsin S expression. (A, right panel) Quantification of cathepsin S signals (B7-8) and control signals (A1-2 and E1-2) using Bio-Rad Image Lab Software. Results were pooled from 3 independent experiments. Student t test was used to compare no serum exosome and CDSE groups. (B, left panel) Colonic cathepsin S mRNA expression in 40 non-IBD, 52 UC, 28 non-stricturing CD, and 15 stricturing CD patients was determined by real-time reverse transcription polymerase chain reaction. Ordinary one-way ANOVA test did not find any significant differences. (B, middle panel) Colonic cathepsin S mRNA (CTSS) expression in 43 CD patients is not correlated with colonic elafin mRNA expression. (B, right panel) Fresh human colonic tissues from 4 colon cancer patients were incubated in serum-free RPMI1640 media with or without 100 μg/mL CDSE. Two hours later, elafin (1 μg/mL) was added and incubated for 24 hours. Ordinary one-way ANOVA test did not find any significant differences. (C) Cathepsin S activity assay was performed by incubating 2 μL of CS substrate (200 μmol/L final concentration), 94 μL CS reaction buffer, 2 μL cathepsin S inhibitor provided by the assay kit, 1 μL cathepsin S (0.4 μg/mL final concentration), and 1 μL elafin (0.5–10 μg/mL final concentration) at 37oC for 1 hour. Cathepsin S activity was represented by relative fluorescence units (RFU). Results were pooled from 3 independent experiments. Ordinary one-way ANOVA with Tukey test. (D) Fresh human colonic tissues were pretreated with 100 μg/mL CDSE for 2 hours, followed by elafin 1 μg/mL for 2 hours. Conditioned media were collected. Each piece of tissue was homogenized in 500 μL CS cell lysis buffer. Next, 50 μg of tissue lysate supernatants in 50 μL CS lysis buffer or 50 μL of conditioned media were mixed with 2 μL CS substrates (200 μmol/L final concentration) and 48 μL CS reaction buffer and incubated for 1 hour. Cathepsin S activity was represented by relative fluorescence units (RFU). n = 6 patients. Ordinary one-way ANOVA with Tukey test. (E) CD-HIF in 96-well plates were pretreated with 100 μg/mL CDSE for 2 hours, followed by elafin 1 μg/mL for 2 hours. Conditioned media were collected. Cells were then lysed in 200 μL/well CS cell lysis buffer. Next, 50 μg of cell lysates in 50 μL CS lysis buffer or 50 μL of conditioned media were mixed with 2 μL of CS substrate (200 μmol/L final concentration) and 48 μL CS reaction buffer and incubated at 37oC for 1 hour. Cathepsin S activity was represented by relative fluorescence units (RFU). Results were pooled from 6 independent experiments. Ordinary one-way ANOVA with Tukey test. (F) Serum-starved CD-HIF were pretreated with either 0.1% TFA r 0.4 μg/mL cathepsin S (1183-CY-010; R&D Systems) for 30 minutes, followed by 100 μg/mL CDSE. Two hours later, elafin (1 μg/mL) was added and incubated for 24 hours. ProCOL1A1 protein was determined by ELISA. Results were pooled from 4 experiments. Ordinary one-way ANOVA with Tukey test.
Figure 4
Figure 4
(A and B) Serum-starved CD-HIF were pretreated with 0.8% DMSO, 10 μmol/L PAR2 inhibitor GB88 (HY-120261; MCE), 10 μmol/L PAR1 agonist TRAP-6 (HY-P0078; MCE), or 10 μmol/L PAR2 agonist SLIGKV-NH2(HY-P0283; MCE). An hour later, the fibroblasts were exposed to 100 μg/mL CDSE. Two hours later, elafin (1 μg/mL) was added and incubated for 24 hours. Results were pooled from 4 experiments. Ordinary one-way ANOVA with Tukey test. (C) The most differentially expressed genes found in whole-transcriptome RNA sequencing in the colonic tissues of 2 stricturing and 2 non-stricturing CD patients. (D) STRING database analysis shows protein interaction association between the most differentially expressed genes in stricturing versus non-stricturing CD patients. (E, upper panel) Colonic ZEB1 mRNA expression in 40 non-IBD, 52 UC, 28 non-stricturing CD, and 15 stricturing CD patients. Stricturing CD patients have significantly higher colonic ZEB1 mRNA expression than non-stricturing CD patients. Ordinary one-way ANOVA with Tukey test. (E, lower panel) Positive correlation between colonic ZEB1 mRNA and collagen (ProCOL1A1) protein expression in 43 CD patients. (F) Serum-starved CD-HIF were transfected with either control (sc-37007; Santa Cruz Biotechnology, Dallas, TX) or ZEB1 (sc-38643; Santa Cruz Biotechnology) siRNA via lipofectamine 3000 overnight, followed by 100 μg/mL CDSE for 24 hours. ZEB1 and ProCOL1A1 proteins were measured by ELISA. Results were pooled from 4 experiments. Ordinary one-way ANOVA with Tukey test for left panel. Student t test was used to compare ZEB1 expression between control siRNA and ZEB1 siRNA groups on right panel.
Figure 5
Figure 5
(A) Serum-starved CD-HIF were transfected with either control or ZEB1-overexpressing construct via lipofectamine 3000 overnight. Fibroblasts were then pretreated with 100 μg/mL CDSE. Two hours later, elafin (1 μg/mL) was added and incubated for 24 hours. Results were pooled from 4 independent experiments. Ordinary one-way ANOVA with Tukey test. (B) Efficiency of ZEB1-overexpressing construct transfection was determined by ELISA. Results were pooled from 4 experiments. Student t test was used to compare ZEB1 expression between control construct and ZEB1-overexpressing construct groups. (C) Serum-starved CD-HIF were pretreated with DMSO, 0.4 μg/mL cathepsin S, 10 μmol/L PAR1 agonist TRAP-6 (HY-P0078; MCE), or 10 μmol/L PAR2 agonist (HY-P0283; MCE) for 60 minutes, followed by addition of 100 μg/mL CDSE. Two hours later, some groups were treated with elafin (1 μg/mL) and incubated for 24 hours. Results were pooled from 4 independent experiments. Ordinary one-way ANOVA with Tukey test. (D) Fresh human colonic tissues from 4 colon cancer patients were incubated in serum-free RPMI1640 media with or without 100 μg/mL CDSE. Two hours later, elafin was added and further incubated for 24 hours. Results were pooled from 4 independent experiments. Ordinary one-way ANOVA with Tukey test. (E) Fresh human ileal tissues from 3 stricturing CD patients were incubated in serum-free RPMI1640 media with or without 100 μg/mL CDSE. Two hours later, elafin (1 μg/mL) was added and incubated for 24 hours. COL1A1, COL1A2, and ZEB1 mRNA expression were determined by real-time reverse transcription polymerase chain reaction. Ordinary one-way ANOVA with Tukey test. (F) Macroscopic and microscopic morphology of the fresh stricturing ileal tissue. Intense collagen deposition is found in the mucosal layer.
Figure 6
Figure 6
(A) Experimental plan. Control lentivirus, elafin-overexpressing lentiviruses, Ctss-overexpressing lentivirus, Ctss-siRNA lentivirus, Zeb1-shRNA lentivirus, and Zeb1-overexpressing lentivirus were injected into SAMP1/YitFc mice intraperitoneally once at 40 weeks of age. In addition, PAR2 agonist GB110 or PAR2 inhibitor GB88 was given via oral gavage from 40 to 42 weeks of age. Non-fibrotic 10-week-old SAMP1/YitFc mice and parental control 42-week-old AKR strain mice were used for comparison. Ileal tissues were collected for analysis 2 weeks after lentiviral injection. (B) Body weight. Six mice per group. Mean ± standard deviation. (C) H&E staining (upper panels) and Masson Trichrome (MT) staining (lower panels) of ileal tissues from 10 to 42 weeks of age. Blue color in MT staining (arrows) indicated collagen deposition in lamina propria. (D) Ileal histology scores. (E) Ileal fibrosis scores. (F) Ileal overall disease activities. Six mice per group. Ordinary one-way ANOVA with Tukey tests.
Figure 7
Figure 7
(A) Experimental plan. Eight-week-old male and female 129Sv/J mice were administered 20 mg streptomycin via oral gavage. Twenty-four hours later, mice were orally infected with Salmonella typhimurium SL1344 strain (1 × 108 colony-forming units) to induce cecal fibrosis. In addition, some mice received single intraperitoneal injection (10 infectious units/mouse) of control lentivirus or elafin-overexpressing lentiviruses on day 14. Cecal tissues were collected for analysis on day 21. (B) No significant change in body weight was noticed throughout the disease course in the infected mice. Six mice per group. Mean ± standard deviation. (C) H&E staining (upper panels) and Masson Trichrome (MT) staining (lower panels) of cecal tissues on day 21. Blue color in MT staining (arrows) indicated collagen deposition in cecal lamina propria of Salmonella-infected mice. (D) Cecal histology scores. (E) Cecal fibrosis scores. (F) Cecal overall disease activities. Lentiviral elafin expression reversed cecal fibrosis in Salmonella-infected mice. Six mice per group. Ordinary one-way ANOVA with Tukey tests.
Figure 8
Figure 8
(A) Experimental plan. Eight-week-old male and female CD-1 mice were injected with 50 μL TNBS solution (to induce colitis) or 30% ethanol (vehicle) via weekly enema 6 times. After last TNBS injection, mice were held for 2 additional weeks to develop colonic fibrosis. Some mice were injected with either control construct or elafin-overexpressing construct intracolonically on day 9 after last TNBS injection. Anti-TNFα neutralizing antibodies were injected intraperitoneally on day 9 after last TNBS injection. (B) TNBS induced colitis slowly. No significant change in weight loss was noticed in TNBS-treated mice. Six mice per group. Mean ± standard deviation. (C) H&E staining (upper panels) and MT staining (lower panels) of colonic tissues. Blue color in MT staining (arrows) indicated collagen deposition. (D) Colonic histology scores. (E) Colonic fibrosis scores. (F) Colonic overall disease activities. Six mice per group. Ordinary one-way ANOVA with Tukey test.
Figure 9
Figure 9
(A) H&E staining (upper panels) and MT staining (lower panels) of ileal tissues from SAMP1/YitFc mice at 42 weeks of age. Blue color in MT staining (arrows) indicated collagen deposition. (B) Ileal histology scores. (C) Ileal fibrosis scores. (D) Ileal overall disease activities. Prominent ileal fibrosis was found in elafin-overexpressing groups with lentiviral Ctss and Zeb1 overexpression and oral PAR2 agonist GB110 treatment. Ileal fibrosis was ameliorated with lentiviral Ctss and Zeb1 shRNA inhibition and oral PAR2 inhibitor GB88 treatment. Six AKR or SAMP1/YitFc mice per group. Ordinary one-way ANOVA with Tukey tests.
Figure 10
Figure 10
(A) H&E staining (upper panels) and Masson Trichrome (MT) staining (lower panels) of cecal tissues on day 21. Blue color in MT staining (arrows) indicated collagen deposition in cecal lamina propria of Salmonella-infected mice. Prominent cecal fibrosis was found in elafin-overexpressing groups with lentiviral Ctss and Zeb1 overexpression and oral PAR2 agonist GB110 treatment. Cecal fibrosis was ameliorated with lentiviral Ctss and Zeb1 shRNA inhibition and oral PAR2 inhibitor GB88 treatment. (B) Cecal histology scores. (C) Cecal fibrosis scores. (D) Cecal overall disease activities. Six uninfected or Salmonella-infected mice per group. Ordinary one-way ANOVA with Tukey tests.
Figure 11
Figure 11
(A) TNBS-treated mice were injected with Ctss-overexpressing lentivirus, Ctss-siRNA lentiviruses, Zeb1-overexpressing lentivirus, or Zeb1-shRNA lentivirus on day 9 after last TNBS injection. Some mice were injected with 5 mg/kg PAR2 agonist SLIGKV-NH2 intracolonically 9, 11, and 13 days after last TNBS injection. GB88 (10 mg/kg/day) was administered via oral gavage. Control or elafin-overexpressing construct was injected intracolonically. H&E staining (upper panels) and Masson Trichrome staining (lower panels) of colonic tissues are shown. Blue color in MT staining (arrows) indicated collagen deposition. (B) Colonic histology scores. (C) Colonic fibrosis scores. (D) Colonic overall disease activities. Prominent colonic fibrosis was found in elafin-overexpressing groups with lentiviral Ctss and Zeb1 overexpression and oral PAR2 agonist GB110 treatment. Colonic fibrosis was ameliorated with lentiviral Ctss and Zeb1 shRNA inhibition and oral PAR2 inhibitor GB88 treatment. Six mice per group. Ordinary one-way ANOVA with Tukey tests.
Figure 12
Figure 12
(A) Ileal cathepsin S activities in AKR and SAMP1/YitFc mice. (B) Cecal cathepsin S activities in uninfected and Salmonella-infected mice. (C) Colonic cathepsin S activities in normal and TNBS-treated mice. Fifty μg tissue lysates in 50 μL CS buffer per reaction. Six mice per group. Ordinary one-way ANOVA with Tukey tests.
Figure 13
Figure 13
Elafin-overexpressing lentiviruses, Ctss-overexpressing lentivirus, and Zeb1-overexpressing lentivirus were injected into AKR mice intraperitoneally at 40 weeks of age. In addition, oral PAR2 agonist GB110 (10 mg/kg/day) was administered via oral gavage from 40 to 42 weeks of age. H&E staining (upper panels) and Masson Trichrome (MT) staining (lower panels) of ileal tissues did not find histologic injury or fibrosis. Six mice per group.
Figure 14
Figure 14
(A) Changes in body weight of AKR mice from 40 to 42 weeks of age. (B) Changes in body weight of SAMP/YitFc mice from 40 to 42 weeks of age. (C) Changes in body weight of uninfected and Salmonella-infected mice from day 14 to day 21. (D) Changes in body weight of normal and TNBS-treated mice from week 5 to week 7. Elafin overexpression and lentiviral/pharmacologic manipulations did not change body weight. n = 6 mice per group.
Figure 15
Figure 15
(A) Experimental plan. The formulation was suspended in mildly acidified (pH 5) water containing 0.5% hydroxypropyl methylcellulose (HPMC) and administered to TNBS-treated mice via oral gavage. The Eudragit polymer releases its drug in the mid-distal ileum and colon under an alkaline environment at ∼pH 8. (B) Elafin-Eudragit-HPMC (10 mg/kg) was administered to normal mice via oral gavage. Colonic tissue elafin levels were determined by ELISA (DY1747; R&D Systems). Mean ± standard deviation. (C) H&E staining (upper panels) and MT staining (lower panels) of colonic tissues. Blue color in MT staining (arrows) indicated collagen deposition. (D) Histology scores, fibrosis scores, overall disease activities, colonic Zeb1 mRNA expression, and changes in body weight. Six mice per group. Ordinary one-way ANOVA with Tukey tests. (E) Comparison of intestinal tissue elafin levels and efficiencies in regulating target genes and disease activities. Body weight changes in elafin treatment groups compared with their respective positive control groups. Mean ± standard deviation.
Figure 16
Figure 16
(A) Serum-starved CCD-18Co fibroblasts were treated with DMSO, PAR1 inhibitor (SCH79797), or PAR2 inhibitor (GB88) for 2 hours. PAR2 inhibitor GB88 inhibited ERK1/2 phosphorylation. Results were pooled from 3 independent experiments. Ordinary one-way ANOVA with Tukey test. (B) Serum-starved CCD-18Co fibroblasts were pretreated with DMSO, PAR1 agonist (10 μmol/L), PAR2 agonists (10 μmol/L), or cathepsin S (0.4 μg/mL) for 30 minutes, followed by incubation with elafin (1 μg/mL) for 2 hours. ERK1/2 phosphorylation was determined by ELISA. PAR2 agonist and cathepsin S reversed elafin-mediated inhibition of ERK phosphorylation. Results were pooled from 4 independent experiments. Ordinary one-way ANOVA with Tukey test.

References

    1. Lenti M.V., Di Sabatino A. Intestinal fibrosis. Mol Aspects Med. 2019;65:100–109. - PubMed
    1. Cleynen I., Gonzalez J.R., Figueroa C., Franke A., McGovern D., Bortlik M., Crusius B.J., Vecchi M., Artieda M., Szczypiorska M., Bethge J., Arteta D., Ayala E., Danese S., van Hogezand R.A., Panes J., Pena S.A., Lukas M., Jewell D.P., Schreiber S., Vermeire S., Sans M. Genetic factors conferring an increased susceptibility to develop Crohn’s disease also influence disease phenotype: results from the IBDchip European Project. Gut. 2013;62:1556–1565. - PubMed
    1. Louis E., Collard A., Oger A.F., Degroote E., Aboul Nasr El Yafi F.A., Belaiche J. Behaviour of Crohn’s disease according to the Vienna classification: changing pattern over the course of the disease. Gut. 2001;49:777–782. - PMC - PubMed
    1. Kugathasan S., Denson L.A., Walters T.D., Kim M.O., Marigorta U.M., Schirmer M., Mondal K., Liu C., Griffiths A., Noe J.D., Crandall W.V., Snapper S., Rabizadeh S., Rosh J.R., Shapiro J.M., Guthery S., Mack R., Kellermayer R., Kappelman M.D., Steiner S., Moulton D.E., Keljo D., Cohen S., Oliva-Hemker M., Heyman M.B., Otley A.R., Baker S.S., Evans J.S., Kirschner B.S., Patel A.S., Ziring D., Trapnell B.C., Sylvester F.A., Stephens M.C., Baldassano R.N., Markowitz J.F., Cho J., Xavier R.J., Huttenhower C., Aronow B.J., Gibson G., Hyams J.S., Dubinsky M.C. Prediction of complicated disease course for children newly diagnosed with Crohn’s disease: a multicentre inception cohort study. Lancet. 2017;389:1710–1718. - PMC - PubMed
    1. Rottoli M., Vallicelli C., Ghignone F., Tanzanu M., Vitali G., Gionchetti P., Rizzello F., Poggioli G. Predictors of early recurrence after strictureplasty for Crohn’s disease of the small bowel during the years of biologics. Dig Liver Dis. 2019;51:663–668. - PubMed

Publication types