. 2022 Jul 15;13(1):4118.
doi: 10.1038/s41467-022-31764-9.

Hypoxia induces HIF1α-dependent epigenetic vulnerability in triple negative breast cancer to confer immune effector dysfunction and resistance to anti-PD-1 immunotherapy

Affiliations

Hypoxia induces HIF1α-dependent epigenetic vulnerability in triple negative breast cancer to confer immune effector dysfunction and resistance to anti-PD-1 immunotherapy

Shijun Ma et al. Nat Commun. .

Abstract

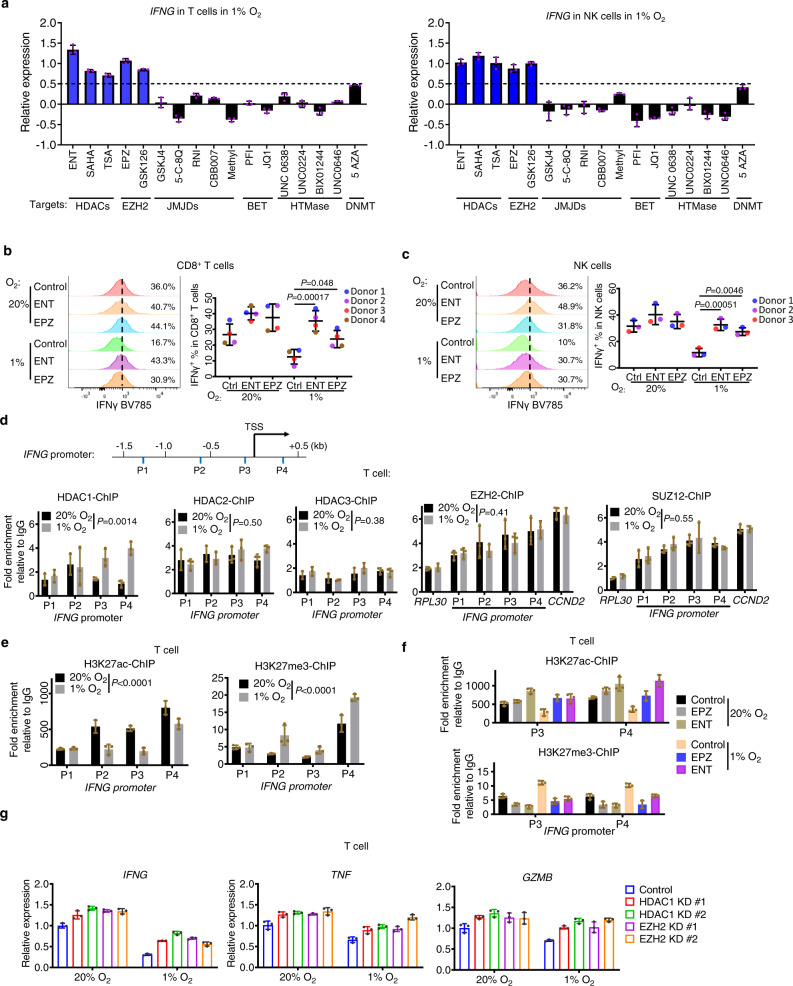
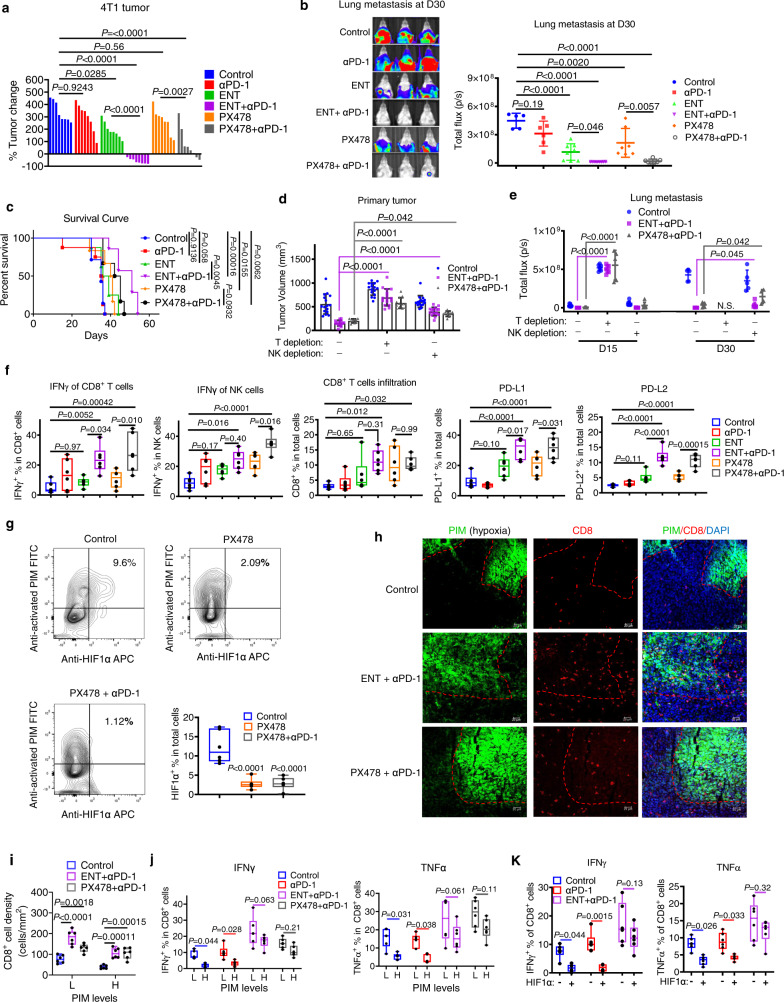
The hypoxic tumor microenvironment has been implicated in immune escape, but the underlying mechanism remains elusive. Using an in vitro culture system modeling human T cell dysfunction and exhaustion in triple-negative breast cancer (TNBC), we find that hypoxia suppresses immune effector gene expression, including in T and NK cells, resulting in immune effector cell dysfunction and resistance to immunotherapy. We demonstrate that hypoxia-induced factor 1α (HIF1α) interaction with HDAC1 and concurrent PRC2 dependency causes chromatin remolding resulting in epigenetic suppression of effector genes and subsequent immune dysfunction. Targeting HIF1α and the associated epigenetic machinery can reverse the immune effector dysfunction and overcome resistance to PD-1 blockade, as demonstrated both in vitro and in vivo using syngeneic and humanized mice models. These findings identify a HIF1α-mediated epigenetic mechanism in immune dysfunction and provide a potential strategy to overcome immune resistance in TNBC.


Conflict of interest statement

The authors declare no competing interests.

Figures

Fig. 1
Fig. 1. Hypoxia is associated with immune exclusion in human and mouse triple-negative breast cancer (TNBC).
a Heatmap showing Pearson’s correlation between hypoxic signature genes expression and immune-related genes expression in basal TNBC samples (n = 98) in TCGA dataset. b Scatter plots (upper panel) and Pearson’s correlation coefficients (lower panel) showing the expression of hypoxic gene signatures and immune-related genes in breast cancers in TCGA dataset (Basal, n = 98; HER2, n = 58; Luminal A, n = 231; Luminal B, n = 129). Regression lines with a 95% confidence interval (gray fill) are shown in the scatter plots. c Images of fluorescent staining of human TNBC samples. Scale bar, 50 µm. Data were representative of 30 independent experiments. d Quantification of infiltrating IFNγ+ CD8+ T cell number in HIF1α and HIF1α+ regions of human TNBC sample (n = 30). P values were determined with paired two-tailed t-test. e Correlation between infiltrating IFNγ+ CD8+ T cell count and HIF1α fluorescent intensity in human TNBC samples (n = 30). The simple linear regression R2 and P values (two-tailed) are calculated. Dot plot is shown with regression line and 95% confidence interval. f Representative images of fluorescent staining of mouse 4T1 tumor samples. Scale bar, 50 µm. Data represents three independent experiments. g Flow cytometry (left panel) demonstrating the gating strategy of activated-PIM high (H) and activated-PIM low (L) populations in living cells dissociated from 4T1 tumors. The CD8+ T cell percentage and IFNγ expression in CD8+ T cells was quantified (right panel, n = 6). Data were presented as box and whiskers, with median value and whiskers of minimum and maximum values. P values were determined with an unpaired two-tailed t-test. h Kaplan–Meier overall survival (OS) and distant metastasis-free survival (DMFS) analysis of the indicated gene signatures in TNBC patients. The publicly available data used in Fig. 1a, b are available in the TCGA database under accession code BRCA.exp.547.med.txt [https://gdc.cancer.gov/about-data/publications/brca_2012]. The publicly available data used in h are available in the KM-Plotter-Breast Cancer [https://kmplot.com/analysis/index.php?p=service&cancer=breast]. For the remaining data, source data are provided in Source Data file.
Fig. 2
Fig. 2. Hypoxia induces dysfunction and terminal exhaustion of human T cells.
a Schematic graph demonstrating the coculture model. b Representative flow cytograms (upper panel) gated from human pan-T cell culture and quantification (lower panel, n = 3) of differentiated CD8+ T cell subtypes: Tn (naïve T cells), Tcm (central memory T cells), Tem (effector memory T cells), Teff (effector T cells). c Schematic graph demonstrating the normoxia (20% O2) and hypoxia (1% O2) culture condition of T cells coculturing with human TNBC cell line. d Heatmap of the differentially expressed genes (DEGs) in hypoxic cultured human T cells compared to normoxia group. DEGs were identified in edgeR (|logFC| > 1, adjusted P < 0.01). P values were adjusted using Benjamini–Hochberg method in edgeR. DEGs identified in the indicated GO gene clusters are marked in the heatmap. e GSEA analysis of human T cells in hypoxic versus normoxic conditions. Analysis was based on ranked logFC from edgeR. FDR and adjusted p value are shown in the graph. P values were adjusted using Benjamini–Hochberg method in GSEA analysis. f Flow cytometry quantifications of immune effector molecules and exhaustion markers in CD8+ T cells gated from human pan-T cells cultured under the indicated conditions (n = 4). g Representative flow cytograms of PD-1 and TIM-3 expression in CD8+ T cells gated from human pan-T cells culture. h Flow cytometric quantification of terminally exhausted T cells (PD-1+ TIM-3+) in CD8+ T cells gated from human pan-T cells culture (n = 3). i Flow cytometric quantification of proliferating cells (Ki76+) in CD8+ and CD4+ T cells gated from human T cells cocultured with TNBC (n = 3). All flow cytometry data (b, f, h, and i) are presented as the mean ± SD of samples from three to four donors. For all flow cytometry data, P values were determined by one-way ANOVA (f, h) or two-way ANOVA (b) with Turkey’s test, or paired two-tailed t-test (i). Raw RNA-seq data is available in the GEO database with accession number GSE179885. For the remaining data, source data are provided in Source Data file.
Fig. 3
Fig. 3. Hypoxia induces epigenetic inactivation of immune effector expression.
a RT-qPCR analysis assessing IFNG expression in T/NK cells in an epigenetic-drug screening. Both T cells and NK cells were cultured under 1% O2 with indicated treatments. Data were presented as the log2 fold change of IFNG mRNA level normalized to vehicle control, mean ± SD of technical triplicates, representative of two independent experiments (n = 2). b, c Representative histograms (left panel) and flow cytometric quantifications (right panel) of IFNγ expression in human CD8+ T cells (b n = 4) and NK cells (c n = 3) with indicated treatments. Quantification data were presented as the mean ± SD of samples from three to four donors. P values were determined by two-way ANOVA with Turkey’s test. d ChIP-qPCR analysis of HDAC1, HDAC2, HDAC3, EZH2, and SUZ12 occupancy on IFNG promoter of human T cells. Four primers were designed to span the promoters of IFNG, with P1 at −1448 to −1354b, P2 at −707 to −628b, P3 at −257 to −171b, P4 at +350 to +461b, relative to TSS. For ChIP analysis of EZH2 and SUZ12 occupancy, RPL30 serves as the negative control and CCND2 as the positive control. e, f ChIP-qPCR analysis of H3K27ac and H3K27me3 enrichment on IFNG promoter of human T cells under indicated conditions. All ChIP-qPCR data (df) are presented as fold enrichment relative to IgG and expressed as mean ± SD of technical triplicates, representative of two independent experiments (n = 2). For ChIP-qPCR data of d, e, statistics were performed to analyze bindings of indicated markers across different sites in IFNG promoter (RPL30 and CCND2 excluded) between hypoxia and normoxia. P values were determined by two-way ANOVA analysis. g RT-qPCR analysis of human T cell with indicated gene knockdown. Data were presented as the fold change of mRNA level normalized to the control group under normoxia (1% O2), mean ± SD of technical triplicates, representative of two independent experiments (n = 2). Source data are provided as a source data file.
Fig. 4
Fig. 4. Hypoxia-induced epigenetic inactivation of effector expression is HIF1α-dependent.
a ChIP-qPCR analysis of HIF1α and HIF2α occupancy on IFNG promoter in human T cells. VEGFA served as a positive control. b Co-immunoprecipitation shows the physical interaction between HDAC1 and HIF1α, and the interaction between HDAC1 and SUZ12 in human T cells. Data is representative of two independent experiments (n = 2). c Representative western blot images (n = 2) to demonstrate knockdown of HIF1α in human T cells. d ChIP-qPCR analysis of HDAC1 occupancy on IFNG promoter in human T cells. e ChIP-qPCR analysis of H3K27ac and H3K27me3 enrichment on IFNG promoter in human T cells with indicated treatments. All ChIP-qPCR data (a, d, e) are presented as fold enrichment relative to IgG and expressed as mean ± SD of technical triplicates, representative of two independent experiments (n = 2). For ChIP-qPCR data of a, statistics were performed to analyze bindings of indicated markers across different sites in IFNG promoter (VEGFA excluded) between hypoxia and normoxia. P values were determined by two-way ANOVA analysis. f Flow cytometric quantifications of IFNγ in CD8+ T cells gated from human pan-T cells cultured under the indicated conditions. Data were presented as the mean ± SD of three independent experiments (n = 3). P values were determined by one-way ANOVA with Turkey’s test. g Representative western blot images (n = 2) to demonstrate the inhibition of HIF1α level by indicated compounds in human T cells. h Representative histograms (left panel) and flow cytometric quantifications (right panel) of IFNγ expression in human CD8+ T cells with indicated treatments. Quantification data were presented as the mean ± SD of samples from four donors (n = 4). P values were determined by two-way ANOVA with Turkey’s test. Source data are provided as a source data file.
Fig. 5
Fig. 5. Hypoxia dampens immune cytotoxicity, weakens interferon signaling, and induces resistance to PD-1 blockade.
a Cell lysis of TNBC cells cocultured with human T cells from two different healthy donors. Human T cells were stimulated with TNBC cell lysate-primed DC cells. Data were presented as mean ± SD of three independent experiments (n = 3). P values were determined by two-way ANOVA. b Western blot analysis of IFNγ–regulated proteins in TNBC cells cocultured with human T cells. Data were representative of two independent experiments (n = 2). c Cell lysis of TNBC cells cocultured with human T cells. Human T cells were stimulated with TNBC cell lysate-primed DC cells and pretreated with indicated compounds. Data presented as mean ± SD of three independent experiments (n = 3). P values were determined by one-way ANOVA with Dunnett’s test. d Western blot analysis of IFNγ–regulated proteins in TNBC cells cocultured with human T cells. Human T cells were stimulated with TNBC cell lysate-primed DC cells and pretreated with indicated compounds. Data were representative of two independent experiments (n = 2). e Cell lysis of TNBC cells cocultured with human T cells. Data were presented as mean ± SD of three independent experiments (n = 3). P values were determined by two-way ANOVA with Dunnett’s test. f Flow cytometric quantifications of immune effector molecules in human CD8+ T cells cultured under the indicated conditions. Data were presented as the mean ± SD of samples from three donors (n = 3). P values were determined by two-way ANOVA with Turkey’s test. Source data are provided as a source data file.
Fig. 6
Fig. 6. Pharmacological inhibition of HIF1α and associated epigenetic events sensitizes PD-1 blockade in a syngeneic mouse model.
a Change of 4T1 tumor volume from baseline in BALB/c mice at Day 16 of drug treatments. N = 8. b Lung metastasis of BALB/c mice bearing 4T1 at Day 30. Left panel, representative bioluminescence images. Right panel, quantification of lung metastasis. Control, n = 5; αPD-1, n = 6; n = 8 for ENT and ENT + αPD-1; n = 7 for PX478 and PX478 + αPD-1. c Kaplan–Meier survival curve for 4T1-bearing mice. Control, n = 8; αPD-1, n = 7; ENT, n = 8; ENT + αPD-1, n = 7; n = 6 for PX478 and PX478 + αPD-1. P values were determined by Mantel–Cox test. d 4T1 tumor volume in NK-depleted mice (n = 16 for control and ENT + αPD-1; PX478 + αPD-1, n = 10), T-depleted mice (n = 16 for control and ENT + αPD-1; PX478 + αPD-1, n = 12) and normal mice (control, n = 16; ENT + αPD-1, n = 14; PX478 + αPD-1, n = 10), at Day 15 of treatments. e Lung metastasis of NK-depleted mice (control, n = 8; ENT + αPD-1, n = 7; PX478 + αPD-1, n = 5), T-depleted mice (n = 7 for control and ENT + αPD-1; PX478 + αPD-1, n = 5) and normal mice (n = 8 for control and ENT + αPD-1; PX478 + αPD-1, n = 6) at Day 15/30. f Flow cytometric analysis of 4T1 tumors. N = 6. g Flow analysis on HIF1α expression in cells dissociated from 4T1 tumors. N = 6. h, i Immunofluorescence analysis of 4T1 tumor slides. Representative images (h scale bar 20 µm) and quantifications (i). N = 6. j, k Flow cytometric analysis of 4T1 tumors, n = 5 for ENT + αPD-1, n = 6 for other groups. Data of f, g, j, k, i are presented as box and whiskers, with median value and whiskers of minimum and maximum values. Data of a, b, d, e were presented as mean ± SD. P values were determined by one-way (a, b, f, g) or two-way (d, e, i, j, k) ANOVA with Turkey’s test. Source data are provided as a source data file.
Fig. 7
Fig. 7. Pharmacological inhibition of HIF1α and associated epigenetic events sensitizes PD-1 blockade in a humanized mouse model.
a Schematic diagram showing the establishment of humanized mice (humice) with human immune system reconstituted in NIKO mice. The presence of human CD45+ cells, NK cells, CD4+ and CD8+ T cells in the mice’s peripheral system was validated by flow cytometry. b Primary LM2 tumor size in humice (control, n = 14; Keytruda, n = 14; ENT, n = 12; PX478, n = 14; ENT + Keytruda, n = 16; PX478 + Keytruda, n = 16) and NIKO mice (control, n = 10; ENT + Keytruda, n = 10; PX478 + Keytruda, n = 10), at Day 21 of treatments. c Lung metastasis of humice (control, n = 6; Keytruda, n = 6; ENT, n = 6; PX478, n = 6; ENT + Keytruda, n = 7; PX478 + Keytruda, n = 7) and NIKO mice (control, n = 5; ENT + Keytruda, n = 5; PX478 + Keytruda, n = 5) bearing LM2 tumors at Day 35 assessed by bioluminescence (BLI) measurement. d Representative bioluminescence (BLI) images showing the lung metastasis of humice and NIKO mice. e Flow cytometric analysis of LM2 tumors harvested from humanized mice. IFNγ, TNFα, and granzyme B expression was examined in tumor-infiltrating human CD8+ T cells and NK cells. N = 5 for each group. f Flow cytometry analysis of LM2 tumors harvested from humanized mice. Expressions of human PD-L1 and PD-L2 were examined in total living cells dissociated from LM2 tumors. N = 5 for each group. Quantification data of flow cytometry (e, f) are presented as a box and whiskers, with median values and whiskers of minimum and maximum values. Data for b and c were presented as mean ± SD. P values were determined by one-way (e, f) or two-way (b, c) ANOVA with Turkey’s test. Source data are provided as a source data file.

References

    1. Bianchini G, Balko JM, Mayer IA, Sanders ME, Gianni L. Triple-negative breast cancer: challenges and opportunities of a heterogeneous disease. Nat. Rev. Clin. Oncol. 2016;13:674–690. doi: 10.1038/nrclinonc.2016.66. - DOI - PMC - PubMed
    1. Podo F, et al. Triple-negative breast cancer: present challenges and new perspectives. Mol. Oncol. 2010;4:209–229. doi: 10.1016/j.molonc.2010.04.006. - DOI - PMC - PubMed
    1. Liu Z, Li M, Jiang Z, Wang X. A comprehensive immunologic portrait of triple-negative breast cancer. Transl. oncol. 2018;11:311–329. doi: 10.1016/j.tranon.2018.01.011. - DOI - PMC - PubMed
    1. Nanda R, et al. Effect of pembrolizumab plus neoadjuvant chemotherapy on pathologic complete response in women with early-stage breast cancer: an analysis of the ongoing phase 2 adaptively randomized I-SPY2 trial. JAMA Oncol. 2020;6:676–684. doi: 10.1001/jamaoncol.2019.6650. - DOI - PMC - PubMed
    1. Schmid P, et al. Pembrolizumab plus chemotherapy as neoadjuvant treatment of high-risk, early-stage triple-negative breast cancer: results from the phase 1b open-label, multicohort KEYNOTE-173 study. Ann. Oncol. 2020;31:569–581. doi: 10.1016/j.annonc.2020.01.072. - DOI - PubMed

Publication types