. 2022 Jul 15;13(1):4112.
doi: 10.1038/s41467-022-31566-z.

SLITRK2 variants associated with neurodevelopmental disorders impair excitatory synaptic function and cognition in mice

Affiliations

SLITRK2 variants associated with neurodevelopmental disorders impair excitatory synaptic function and cognition in mice

Salima El Chehadeh et al. Nat Commun. .

Abstract

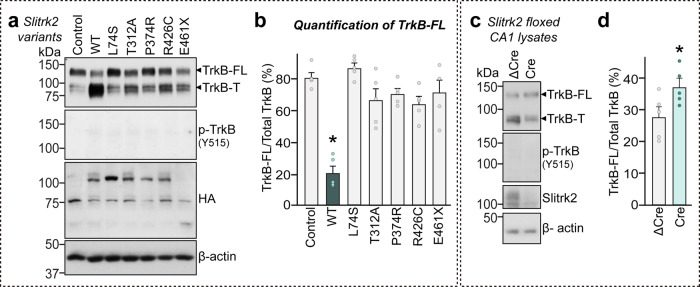
SLITRK2 is a single-pass transmembrane protein expressed at postsynaptic neurons that regulates neurite outgrowth and excitatory synapse maintenance. In the present study, we report on rare variants (one nonsense and six missense variants) in SLITRK2 on the X chromosome identified by exome sequencing in individuals with neurodevelopmental disorders. Functional studies showed that some variants displayed impaired membrane transport and impaired excitatory synapse-promoting effects. Strikingly, these variations abolished the ability of SLITRK2 wild-type to reduce the levels of the receptor tyrosine kinase TrkB in neurons. Moreover, Slitrk2 conditional knockout mice exhibited impaired long-term memory and abnormal gait, recapitulating a subset of clinical features of patients with SLITRK2 variants. Furthermore, impaired excitatory synapse maintenance induced by hippocampal CA1-specific cKO of Slitrk2 caused abnormalities in spatial reference memory. Collectively, these data suggest that SLITRK2 is involved in X-linked neurodevelopmental disorders that are caused by perturbation of diverse facets of SLITRK2 function.


Conflict of interest statement

The authors declare no competing interests.

Figures

Fig. 1
Fig. 1. Identification of SLITRK2 variants in individuals with NDD.
a Pedigree of families with rare SLITRK2 variants. b Representation of the SLITRK2 protein, including the different variants identified in individuals with NDD and not previously reported in the hemizygous state in the gnomAD database (Purple, variants occurring de novo in the proband or his mother; blue, variants inherited from unaffected mothers without additional information; green, variants identified in gnomAD in at least two hemizygous males).
Fig. 2
Fig. 2. Structural model of human SLITRK2 and patient variants.
Model structure of human SLITRK2 LRR1 and LRR2 domains presented as a cartoon. Top: LRR1 domain, C33-D270 (left); LRR2 domain, P341-P579 (right). LRR N-terminus, LRR motifs, and LRR C-terminus are depicted in yellow, gray, and orange, respectively. Black dotted lines represent flexible linkers between LRR1 and LRR2 domains. Bottom: Close-up views of mutated and neighboring residues in LRR1 and LRR2 domains. Residues corresponding to patients’ variants described in the current study are presented as red sticks and labeled. The structure of human PTPδ Ig2 (teal) from the crystal structure of the human SLITRK1/human PTPδ Ig1-3 (PDB ID:4RCA) complex was used as a reference for potential interactions between human SLITRK2 and PTPδ Ig2. For clarity, the human SLITRK2 model is rotated 90° around the x-axis in the close-up views of E210K, E461*, R484Q, and V511M.
Fig. 3
Fig. 3. Impaired surface trafficking of a subset of SLITRK2 variants.
a Schematic diagrams depicting the SLITRK2 variants analyzed in the current study. b Representative immunoblots from HEK293T cells transfected with the indicated WT or mutant forms of SLITRK2. Samples containing equal amounts of protein were resolved by SDS-PAGE and immunoblotted using anti-HA or GFP antibodies; β-actin was used as a loading control. Molecular mass markers are labeled in kilodaltons. The experiments were independently repeated three times. c Surface expression analysis of HEK293T cells expressing the indicated WT or mutant forms of SLITRK2. Transfected cells were immunostained with mouse anti-HA antibodies (cyan) and detected with FITC-conjugated anti-mouse secondary antibodies under non-permeabilized conditions, followed by permeabilization of cells. Cells were then stained first with rabbit anti-HA antibodies (magenta) and then with Cy3-conjugated anti-rabbit secondary antibodies. Scale bar, 10 μm (applies to all images). d Quantification of the proportion of cells exhibiting surface expression. All data are shown as means ± SEMs (‘n’ denotes the number of images from three independent experiments; WT, n = 10; L74S, n = 7; E210K, n = 9; P311A, n = 7; T312A, n = 6; P374R, n = 7; R426C, n = 8; E461*, n = 8; R484Q, n = 6; V511M, n = 6; E555D, n = 6; R792C, n = 7; S323N, n = 13; V589I, n = 13; V201I, n = 16; WT, n = 7; S9I, n = 7; and G15E, n = 7; **p < 0.01, ***p < 0.001; ANOVA with a non-parametric Kruskal–Wallis test). See Source data for raw data values and Supplementary Table 4 for statistical details.
Fig. 4
Fig. 4. Impaired dendritic targeting of a subset of SLITRK2 variants in cultured hippocampal neurons.
a Representative images of hippocampal neurons transfected with the indicated WT or mutant forms of SLITRK2 at DIV10. The transfected neurons at DIV14 were double-immunostained for antibodies against the somatodendritic marker, MAP2 (cyan), and HA (magenta). Scale bar, 20 μm (applies to all images). b, c Somatic (b) or dendritic (c) targeting of WT or the indicated mutant forms of SLITRK2 in hippocampal neurons was quantified by measuring average intensity of HA immunofluorescence in primary dendrites. The average intensities of SLITRK2 WT and variants in the soma region of transfected neurons were also quantified. All data are shown as means ± SEMs (‘n’ denotes the number of neurons from three independent experiments; WT, n = 12; L74S, n = 10; E210K, n = 10; P311A, n = 10; T312A, n = 10; P374R, n = 11; R426C, n = 10; E461*, n = 11; R484Q, n = 10; V511M, n = 10; E555D, n = 11; R792C, n = 10; S323N, n = 10; V589I, n = 10; V201I, n = 10; **p < 0.01, ***p < 0.001, ****p < 0.0001; ANOVA with a non-parametric Kruskal–Wallis test). See Source data for raw data values and Supplementary Table 4 for statistical details.
Fig. 5
Fig. 5. Generation of Slitrk2-cKO mice.
a Strategy used to generate Slitrk2-cKO mice. LoxP sites were introduced at positions flanking the neomycin gene, FLP recombinant target (FRT), and exon 2–3 (E2 and E3) of the Slitrk2 gene. Black arrows indicate forward and reverse primers used for genotyping. Note that lacZ and neomycin cassettes are two separate markers. b PCR genotyping of Slitrk2-floxed mice (top) and Nestin-Cre;Slitrk2-cKO (Nestin-Slitrk2) mice (bottom). The band size for the Slitrk2-floxed allele was 245 bp. The 400-bp Cre-specific PCR product was detected only in Nestin-Slitrk2 mice. c Quantitative RT-PCR analyses of Slitrk mRNA levels in Nestin-Slitrk2 mice. Data are mean ± SEMs (n = 4 mice; *p < 0.05; two-tailed Mann–Whitney U test). d Body weights of Nestin-Slitrk2 and Slitrk2-floxed (Ctrl) mice at P30, P40, and P50. Data are means ± SEMs (‘n’ denotes the number of mice; P30: Ctrl, n = 15; Nestin-Slitrk2, n = 10; P40: Ctrl, n = 20; Nestin-Slitrk2, n = 14; P50: Ctrl, n = 20; Nestin-Slitrk2, n = 14; *p < 0.05, ****p < 0.0001; two-tailed Mann–Whitney U test). e, f Representative photographs of whole brains (e) and quantification of brain weights and size (f) of P42 Nestin-Slitrk2 and Slitrk2-floxed (Ctrl) mice. Data are means ± SEMs (‘n’ denotes the number of mice; Ctrl and Nestin-Slitrk2, n = 5; two-tailed Mann–Whitney U test). g Normal gross morphology of the Nestin-Slitrk2 brain at 7 wks, as revealed by Nissl staining. Scale bar: 1 mm (applies to both top and bottom). h Representative images of NeuN (a neuronal marker) staining in the Nestin-Slitrk2 brain. Normal numbers of neurons in hippocampal regions. Top, hippocampus; bottom, CA1 stratum pyramidale layer. Scale bar: 1 mm (top) and 20 µm (bottom). i Summary graphs for neuron density and cortical thickness. Data are means ± SEMs (‘n’ denotes the number of mice; neuron density: Ctrl and Nestin-Slitrk2, n = 4; cortical thickness: Ctrl and Nestin-Slitrk2, n = 6; two-tailed Mann–Whitney U test). j Representative images of GAD67 (GABAergic interneuron marker) staining in the hippocampal CA1 of Nestin-Slitrk2 mice. Scale bar: 0.1 mm. k Summary data for GAD67 staining from (j). Data are means ± SEMs (n = 3 mice each after averaging data from 3 sections/mouse; two-tailed Mann–Whitney U test). l, m Representative immunoblots (l) of hippocampal lysates, and summary data showing synaptic protein levels (m) in crude synaptosomal fractions of P42 control and Nestin-Slitrk2 brains, analyzed by semi-quantitative immunoblotting. Data are means ± SEMs (n = 4 mice/group; *p < 0.05, ***p < 0.001; two-tailed unpaired t-test). See Source data for raw data values and Supplementary Table 4 for statistical details.
Fig. 6
Fig. 6. Impaired rescue of excitatory synapse development and transmission in Slitrk2-cKO hippocampal neurons by a subset of SLITRK2 variants.
a Triple-immunofluorescence analysis of EGFP (blue), the presynaptic marker synaptophysin (SynPhys; magenta), and the excitatory postsynaptic marker SHANK (yellow) in mature cultured neurons (DIV14) derived from Slitrk2f/f mice infected with lentiviruses expressing ΔCre or Cre at DIV5. For rescue experiments, neurons infected with lentiviruses expressing Cre at DIV5 were transfected with vectors expressing WT or the indicated mutant forms of SLITRK2 together with EGFP vector at DIV8–9. Scale bar: 10 µm (applies to all images). b Quantification of images in (a), showing the density of SynPhys+SHANK+ puncta. All data are shown as means ± SEMs (‘n’ denotes the number of cells from five independent experiments; Control vs. experimental group: ΔCre, n = 22; Cre, n = 25; +WT, n = 18; +L74S, n = 12; +E210K, n = 17; +P311A, n = 16; +T312A, n = 18; +P374R, n = 16; +R426C, n = 13; +E461*, n = 15; +R484Q, n = 16; +V511M, n = 15; +E555D, n = 14; +R792C, n = 21; +S323N, n = 14; +V589I, n = 17; *p < 0.05, **p < 0.01, ***p < 0.001; Cre vs. experimental group: #p < 0.05, ##p < 0.01; ANOVA with a non-parametric Kruskal–Wallis test). cg Representative mEPSC traces (c) and quantification of amplitudes (d), frequencies (e), decay time (f) and rise time (g) of mEPSCs recorded from hippocampal cultured neurons infected with lentiviruses expressing ΔCre or Cre at DIV5 and transfected with vectors expressing WT or the indicated mutant forms of SLITRK2 together with EGFP vector. All data are shown as means ± SEMs (‘n’ denotes the number of cells from six independent experiments; Control vs. experimental group: ΔCre, n = 48; Cre, n = 46; +WT, n = 41; +L74S, n = 20; +E210K, n = 22; +P311A, n = 24; +T312A, n = 19; +P374R, n = 36; +R426C, n = 20; +E461*, n = 22; +R484Q, n = 29; +V511M, n = 19; +E555D, n = 16; +R792C, n = 16; +S323N, n = 20; +V589I, n = 17; **p < 0.01, ***p < 0.001, ****p < 0.0001; experimental group; Cre vs. experimental group; #p < 0.05, ##p < 0.01, ###p < 0.001, ####p < 0.0001; ANOVA with a non-parametric Kruskal–Wallis test). See Source data for raw data values and Supplementary Table 4 for statistical details.
Fig. 7
Fig. 7. Alterations of full-length TrkB protein levels in cultured neurons by a subset of SLITRK2 variants.
Cultured cortical neurons were infected with lentiviruses expressing WT or the indicated mutant forms of SLITRK2. Levels of TrkB were examined by semi-quantitative immunoblotting using antibodies against TrkB or phospho-TrkB. FL full-length, T truncated. b Quantification of protein levels from (a). Summary data showing plots from five independent experiments. Data are mean ± SEMs (*p < 0.05; ANOVA with a non-parametric Kruskal–Wallis test). c Hippocampal CA1 lysates from Slitrk2-floxed mice infected with AAVs expressing ΔCre or Cre were examined by semi-quantitative immunoblotting using antibodies against TrkB or phospho-TrkB. FL full-length, T truncated. d Quantification of protein levels from (c). Data are means ± SEMs (n = 5 mouse samples; *p < 0.05; two-tailed unpaired t-test). See Source data for raw data values and Supplementary Table 4 for statistical details.
Fig. 8
Fig. 8. Slitrk2-cKO mice display mild learning and memory deficits and abnormal gait.
a Schematic depiction (top) of Barnes maze test. bd Number of errors before first encountering the escape hole (b) escape latency (c) and total distance (d) for Control and Nestin-Slitrk2 mice during the training session. Data are presented as means ± SEMs (‘n’ denotes the number of mice; Control, n = 17; Nestin-Slitrk2, n = 12; two-way ANOVA with Sidak’s multiple comparisons test). Representative track images (bottom) from first and last days of the training. e, f Number of errors before first encountering the escape hole for control and Nestin-Slitrk2 mice during 1st (e) and 2nd probe (f) trials. Data are presented as means ± SEMs (‘n’ denotes the number of mice; Control, n = 15; Nestin-Slitrk2, n = 12; *p < 0.05; two-tailed Mann–Whitney U test). Representative track images (bottom) from 1st and 2nd probe trials. g Representative image of the footprint patterns of juvenile (P20) and adult (P65) control and Nestin-Slitrk2 mice. h, i Footprint patterns were analyzed based on overlap, stride length, stance length, and sway length. P20 (h) and P65 (i) Nestin-Slitrk2 mice exhibited longer overlap length. Data are shown as means ± SEMs (‘n’ denotes the number of mice; P20: Control, n = 10; Nestin-Slitrk2, n = 12; P65: Control, n = 14; Nestin-Slitrk2, n = 15; *p < 0.05, **p < 0.01, ***p < 0.001, ****p < 0.0001; two-tailed Mann–Whitney U test). See Source data for raw data values and Supplementary Table 4 for statistical details.
Fig. 9
Fig. 9. Proper Slitrk2 function in the hippocampal CA1 is required for mediating spatial reference memory in mice.
a Experimental configuration for electrophysiology and immunohistochemistry experiments (cg). b Representative brain sections illustrating the precise targeting of AAVs for expression of Cre recombinase in the hippocampal CA1. Scale bar: 500 µm. ce Representative traces (c) and summary graphs showing the frequency (d) and amplitude (e) of mEPSCs recorded from Slitrk2-floxed mice injected with AAVs expressing ΔCre or Cre. Data are shown as means ± SEMs (ΔCre, n = 13; Cre, n = 20; *p < 0.05; two-tailed Mann–Whitney U test). f, g Representative images (f) and summary graphs quantifying the integrated intensity (g) of VGLUT1 and PSD-95 puncta. Data are shown as means ± SEMs (ΔCre, n = 6; Cre, n = 6; Cre+WT, n = 5; and Cre+T312A, n = 5 mice; *p < 0.05, **p < 0.01, ****p < 0.0001; ANOVA with Tukey’s test). Scale bar, 10 µm (applies to all images). h Experimental configuration for Barnes Maze tests (il). i Representative traces of locomotive behavior for Barnes Maze tests. Target box is indicated with a yellow circle. j Number of errors before first encountering the escape hole, escape latency, and total distance for Slitrk2-floxed mice injected with ΔCre (Control) or Cre during the training session. Data are presented as means ± SEMs (ΔCre, n = 12; Cre, n = 8; two-way ANOVA with Sidak’s multiple comparisons test). k, l Number of errors before first encountering the escape hole for Slitrk2-floxed mice injected with ΔCre (Control) or Cre during 1st (k) and 2nd (l) probe trials. Data are presented as means ± SEMs (ΔCre, n = 12; Cre, n = 8; *p < 0.05, **p < 0.01; two-tailed unpaired t-test). See Source data for raw data values and Supplementary Table 4 for statistical details.

References

    1. Gecz J, Shoubridge C, Corbett M. The genetic landscape of intellectual disability arising from chromosome X. Trends Genet. 2009;25:308–316. doi: 10.1016/j.tig.2009.05.002. - DOI - PubMed
    1. Tarpey PS, et al. A systematic, large-scale resequencing screen of X-chromosome coding exons in mental retardation. Nat. Genet. 2009;41:535–543. doi: 10.1038/ng.367. - DOI - PMC - PubMed
    1. Kaufman L, Ayub M, Vincent JB. The genetic basis of non-syndromic intellectual disability: a review. J. Neurodev. Disord. 2010;2:182–209. doi: 10.1007/s11689-010-9055-2. - DOI - PMC - PubMed
    1. Ropers HH. X-linked mental retardation: many genes for a complex disorder. Curr. Opin. Genet. Dev. 2006;16:260–269. doi: 10.1016/j.gde.2006.04.017. - DOI - PubMed
    1. Lubs HA, Stevenson RE, Schwartz CE. Fragile X and X-linked intellectual disability: four decades of discovery. Am. J. Hum. Genet. 2012;90:579–590. doi: 10.1016/j.ajhg.2012.02.018. - DOI - PMC - PubMed

Publication types