. 2022 Jul 15;13(1):4121.
doi: 10.1038/s41467-022-31810-6.

The surfaceome of multiple myeloma cells suggests potential immunotherapeutic strategies and protein markers of drug resistance

Affiliations

The surfaceome of multiple myeloma cells suggests potential immunotherapeutic strategies and protein markers of drug resistance

Ian D Ferguson et al. Nat Commun. .

Abstract

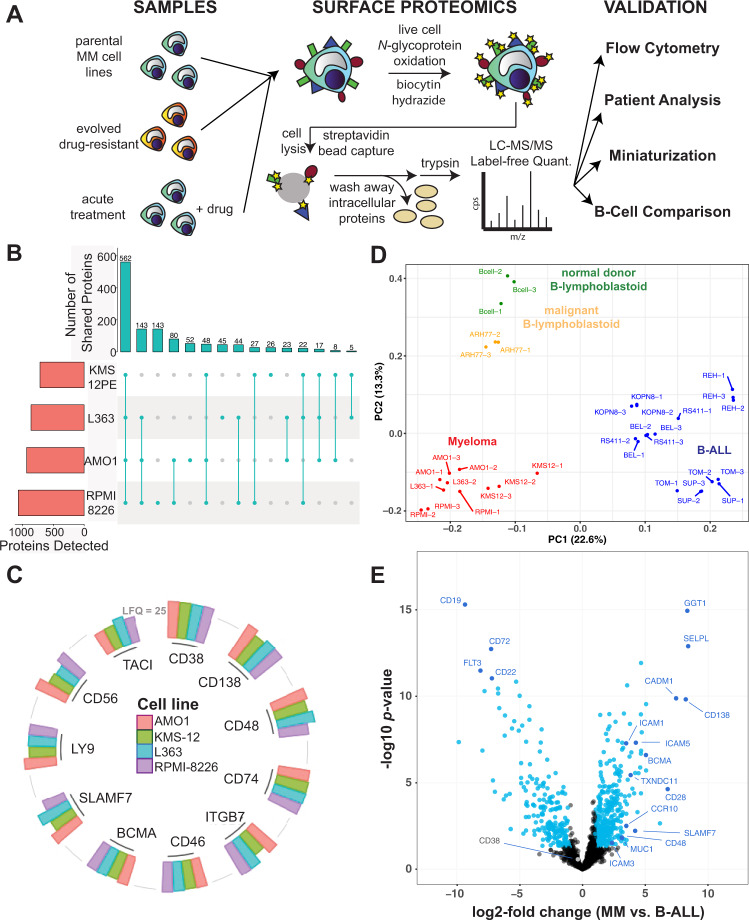
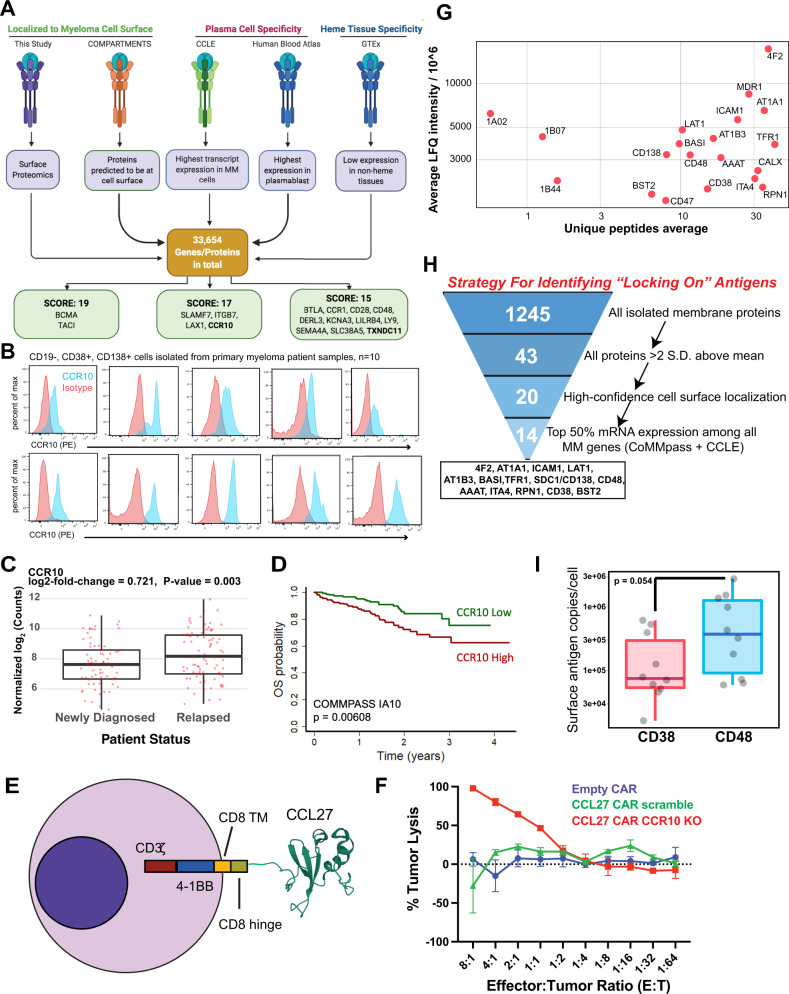
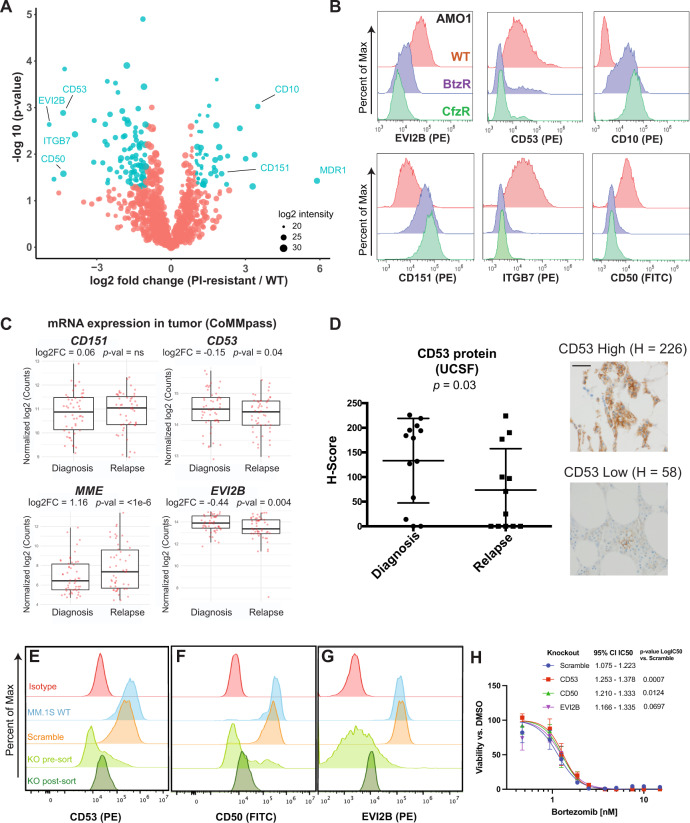
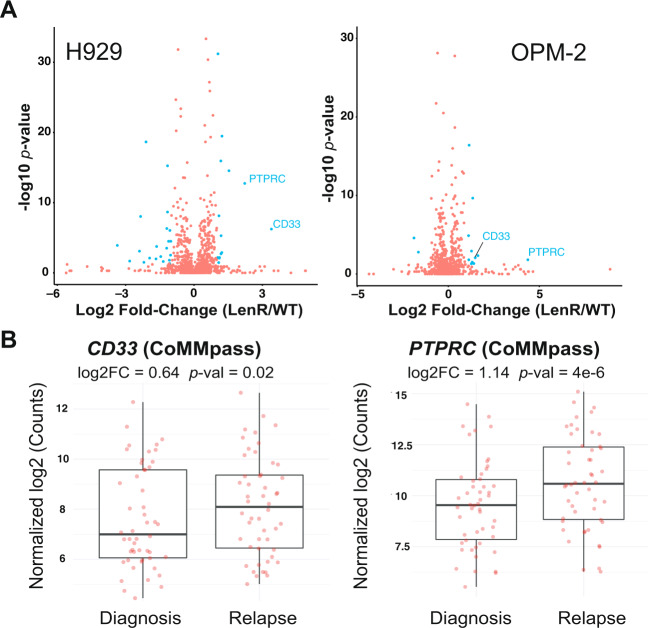
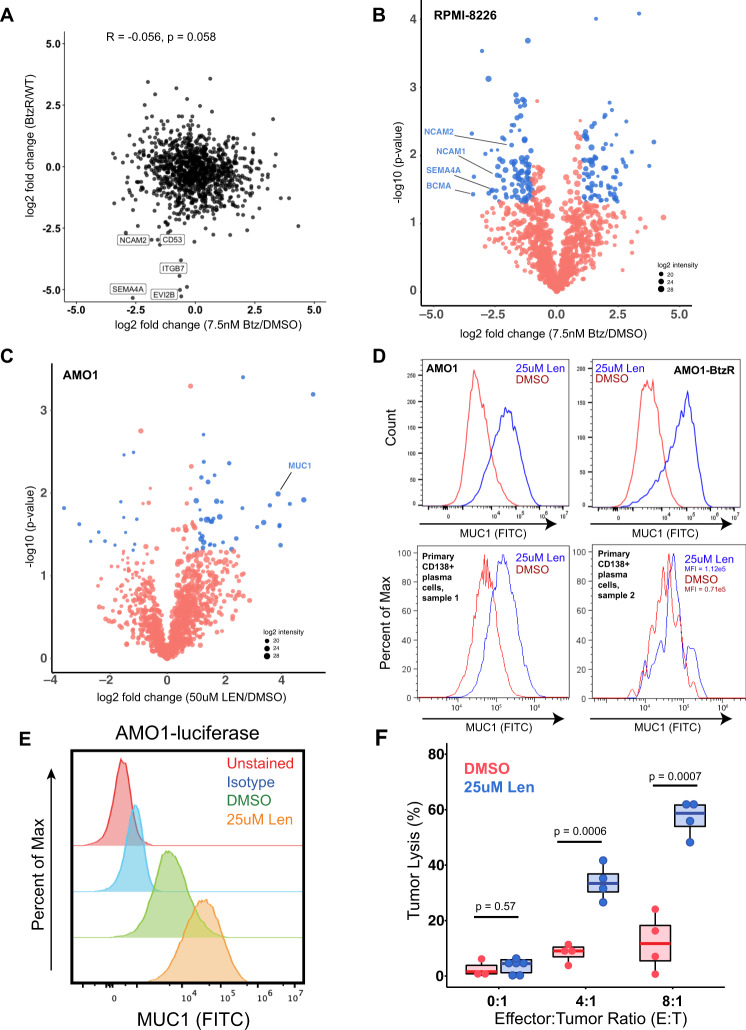
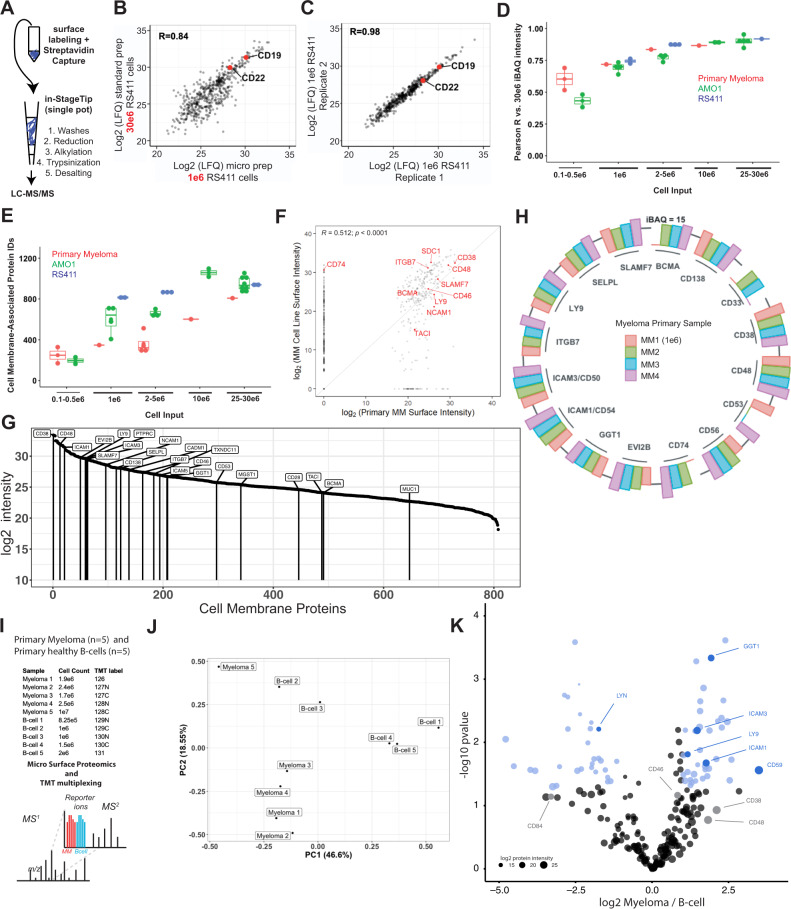
The myeloma surface proteome (surfaceome) determines tumor interaction with the microenvironment and serves as an emerging arena for therapeutic development. Here, we use glycoprotein capture proteomics to define the myeloma surfaceome at baseline, in drug resistance, and in response to acute drug treatment. We provide a scoring system for surface antigens and identify CCR10 as a promising target in this disease expressed widely on malignant plasma cells. We engineer proof-of-principle chimeric antigen receptor (CAR) T-cells targeting CCR10 using its natural ligand CCL27. In myeloma models we identify proteins that could serve as markers of resistance to bortezomib and lenalidomide, including CD53, CD10, EVI2B, and CD33. We find that acute lenalidomide treatment increases activity of MUC1-targeting CAR-T cells through antigen upregulation. Finally, we develop a miniaturized surface proteomic protocol for profiling primary plasma cell samples with low inputs. These approaches and datasets may contribute to the biological, therapeutic, and diagnostic understanding of myeloma.


Conflict of interest statement

A.P.W. is a member of the Scientific Advisory Board and holds equity stakes in Indapta Therapeutics and Protocol Intelligence, LLC. J.A.W. is on the Scientific Advisory Board and holds equity stakes in the following companies with oncology interests: Soteria Biotherapeutics, Jnana Therapeutics, Inception Therapeutics, and Inzen Therapeutics, and holds a sponsored research agreement with Bristol Myers Squibb. S.W.W. has received research funding from Janssen, GlaxoSmithKline, Bristol Myers Squibb, Genentech, and Fortis, and served as a consultant to Amgen. T.G.M. has received research funding from Sanofi, Janssen, and Amgen and has served as a consultant to GlaxoSmithKline. A.L.-G. is an employee and shareholder of Celgene/Bristol Myers Squibb. P.C. is currently an employee and shareholder of Roche/Genentech but was solely employed by UCSF during her participation on this project. A.D.P. is on the Scientific Advisory Board of Astellas Pharma, GO Therapeutics, and Stromatis Pharma, holds equity stakes in Stromatis Pharma, and received research funding from Tmunity Therapeutics. J.E. is a co-founder and holds an equity stake in Mnemo Therapeutics. The other authors declare no conflicts of interest.

Figures

Fig. 1
Fig. 1. Initial elucidation of the myeloma plasma cell surfaceome.
A Overall schematic of surface proteomic investigations in this study. This includes a description of the modified cell surface capture (CSC) methodology used, with biotinylated proteins identified after on-bead trypsinization. B Upset plot shows high degree of overlap in identified glycoproteins, filtered for annotated membrane proteins, across the four evaluated myeloma cell lines. Data included if identified with two peptides in at least one of three biological replicates per cell line. C Common myeloma diagnostic markers and immunotherapeutic targets were identified by cell surface proteomics in all four evaluated cell lines. Height of column indicates label-free quantification (LFQ) intensity from MaxQuant, averaged across biological replicate samples (AMO1: n = 3, L363: n = 2, KMS12: n = 3, RPMI-8226: n = 3). A threshold of LFQ = 25 is indicated by gray line. D Principal component analysis (PCA) illustrates the differential cell surface landscape of myeloma cells versus B-lymphoblastoid cells and B-cell acute lymphoblastic leukemia cell lines. E Volcano plot comparing glycoprotein LFQ intensity of four myeloma cell lines (replicate information listed above for C) to eight B-ALL cell lines (n = 3 biological replicates each). Significantly changed proteins colored in blue (log2-fold change > |1 | ; p < 0.05 by t-test). For BE, source data in Supplementary Data 1.
Fig. 2
Fig. 2. Immunotherapeutically targeting the myeloma cell surfaceome.
A Outline of a five-criteria scoring strategy, integrating surface proteomics data here with publicly-available mRNA transcriptome data, to propose new targets for possible antigen-specific immunotherapies in myeloma (see “Methods” for details). We specifically point out surface proteins with the highest scores among the total 33,654 analyzed (see Supplementary Table 1 for scoring rubric; maximum score = 19). B CCR10 expression measured by flow cytometry in CD19−/CD38+/CD138+ cells isolated from primary myeloma patient samples (n = 10 patients). C CCR10 RNA levels for patients in CoMMpass myeloma dataset (release = IA19) separated into newly diagnosed or relapsed groups (n = 162). p-value from two-sided t-test. D Overall survival in CoMMpass dataset stratified by CCR10 level. High and Low represent top and bottom 25% of patients by CCR10 gene expression, respectively. Number of patients represented in survival plot is 322. E Schematic for CCL27-CAR, including the CD8 hinge and transmembrane domain (TM), 4-1BB co-stimulatory domain, and CD3ζ signaling domain. F Anti-CCR10 CAR-T cells with or without knockout of CCR10, empty CAR, and un-transduced T-cells were incubated with MM.1S-luciferase cells for 24 h. Tumor lysis was measured by luminescence (n = 3 technical replicates). Error bars represent +/− SD. Source data are provided as a Source data file. G Average LFQ intensity across cell lines of proteins >2 SD above the mean versus average unique peptides identified in each line. Source data are provided as a Source data file. H Bioinformatic strategy to nominate possible high-abundance locking-on antigens. I Absolute quantification by flow cytometry for CD38 and CD48 antigen density across 3 myeloma cell lines (MM.1S, OPM-2, AMO1) and CD138+/CD19− myeloma tumor cells from 5 primary patient bone marrow specimens. Datapoints represent averages of independent replicates for cell lines or technical replicates for primary myeloma samples. p-value by two-sided t-test. Source data are provided as a Source data file. For boxplots in C and I, upper and lower hinges correspond to 25 and 75 percentiles, upper and lower whiskers extend to highest and lowest values within 1.5* IQR of the hinge, and center line corresponds to the median.
Fig. 3
Fig. 3. Defining a myeloma surface signature of proteasome inhibitor resistance.
A Cell surface proteomics was performed on evolved bortezomib-resistant (BtzR) and carfilzomib resistant (CfzR) myeloma cell lines (AMO1 BtzR (n = 3); AMO1 CfzR (n = 3), L363 BtzR (n = 2), L363 CfzR (n = 3), RPMI-8226 BtzR (n = 1)) and aggregated in comparison to wild-type cell lines (AMO1 (n = 3), L363 (n = 2), RPMI-8226 (n = 1)), n denotes number of biological replicates. Significantly changed proteins in PI-resistant lines shown in blue (log2-fold change > |1|; p < 0.05). Source data in Supplementary Data 3. B Validation by flow cytometry of most-changed surface proteins in AMO1 cells. Representative data of n = 2 independent experiments. C mRNA data in the MMRF CoMMpass database (Release IA14) from paired diagnosis and first-relapse tumor cells (n = 50), where all patients had received a PI as part of their induction regimen. p-value by two-sided t-test. Upper and lower hinges correspond to 25 and 75 percentiles, upper and lower whiskers extend to highest values within 1.5*IQR of the hinge, and center line indicates the median. D Immunohistochemistry for CD53 on myeloma plasma cells in bone marrow core biopsies from UCSF patients before and after Btz treatment (n = 13 patients). H-scoring (see “Methods”) averaged from two independent hematopathologists (E.R. and S.P.). Magnification = ×60, scale bar length = 100 µm. Error bars represent +/− SD and center line represents the mean. p-value by two-sided t-test. EG Flow cytometry illustrating knockout of CD53 (E), CD50 (F), and EVI2B (G) in MM.1S cells. Representative of n = 2 technical replicates. H MM.1S engineered with knockouts and scramble guide RNA control were treated with Bortezomib for 48 h (n = 3 technical replicates). 95% confidence interval of IC50s from Graphpad (see “Methods”). Error bars represent +/− SD. p-values by Extra sum-of-squares F test. For D and H, source data are provided as a Source data file.
Fig. 4
Fig. 4. Surface proteomic signatures of lenalidomide resistance.
A In vitro-evolved lenalidomide-resistant H929 and OPM-2 lines were analyzed by cell-surface proteomics with comparison to parental lines by SILAC quantification (n = 4 biological replicates; heavy and light channels swapped for two replicates each). Significantly-changed proteins in blue (log2-fold change > |1|; p < 0.05 by t-test), with only CD33 and PTPRC/CD45 showing common changes between the two lines. Source data in Supplementary Data 6. B MMRF CoMMpass patient transcript data confirms significant increase in CD33 and PTPRC at first relapse versus diagnosis (Release IA14, n = 50 patients), suggesting that increases in these surface proteins is driven by IMiD resistance. For B, upper and lower hinges correspond to 25 and 75 percentiles, center line indicates the median, and upper and lower whiskers extend to highest and lowest values within 1.5* IQR of the hinge.
Fig. 5
Fig. 5. Characterizing myeloma surface proteomic changes in response to acute drug treatment.
A Correlation in surface proteomic profile between acute Btz treatment in RPMI-8226 cells (7.5 nM, 48 h, n = 3 biological replicates) vs. DMSO (n = 4 biological replicates) and aggregate BtzR cell line data (as in Fig. 3A) vs. parental. Common changes are observed in some downregulated surface proteins but no significant overall correlation is observed. Pearson correlation and associated p-value of significance shown. Source data in Supplementary Data 3 and 5. B Volcano plot of RPMI-8226 cells treated for 48 h with 7.5 nM bortezomib, highlighting significantly changed proteins (log2-fold change > |1|; p < 0.05 in blue). n = 3 biological replicates. C Similar plot as in B, for 48 h treatment with 50 μΜ Lenalidomide in AMO1 cells. n = 3 biological replicates. For B, C, source data in Supplementary Data 5. D Validation of increase in surface MUC1 in plasma cells in response to 25 μM Lenalidomide treatment, in both AMO1, AMO1 BtzR, and CD138+ myeloma cells in two patient bone marrow aspirates. All plots representative of n = 3 (cell line) or n = 2 (primary sample) technical replicates. E MUC1 expression on cells treated with DMSO or Lenalidomide prior to incubation with anti-MUC1 CAR-T cells (representative of n = 2 independent experiments). F Percent tumor lysis of AMO1-luciferase cells after incubation with Anti-MUC1 CAR-T cells after 72 h, as measured by luminescence. Anti-MUC1 CAR-T cells more efficiently kill cells pre-treated with lenalidomide, while lenalidomide alone has no cytotoxicity (n = 4 technical replicates for E:T = 4:1 and E:T = 8:1, n = 8 technical replicates for E:T = 0:1, p-values by Student’s t-test). Source data are provided as a Source data file. Upper and lower hinges correspond to 25 and 75 percentiles, upper and lower whiskers extend to highest and lowest values, and center line indicates the median.
Fig. 6
Fig. 6. Micro-protocol for cell surface proteomics.
A Schematic of micro sample preparation method using an InStageTip approach for all steps after surface glycoprotein biotinylation on live cells. B Quantitative comparison of LFQ intensity for identified proteins using 30e6 cells in the standard, macro-protocol, versus 1e6 cells using our micro-protocol. LFQ values averaged from n = 2 biological replicates per preparation method; performed with RS4;11 B-ALL cells. C The micro method demonstrates excellent reproducibility across both biological replicates at 1e6 cell input. D Pearson R values of indicated cell inputs of RS411, AMO1, or primary myeloma against the 25e6–30e6 proteomic sample from the same cell line or primary sample. Data points for AMO1 and RS411 represent biological replicates compared to one of the 25e6–30e6 cellular input biological replicates. For primary myeloma, one primary sample MM1 was titrated at inputs of 25e6, 10e6, 5e6, 1e6, 0.5e6, and 0.1e6. E Total number of cell membrane-associated proteins identified using the micro-method at various cell inputs, on AMO1, RS411, and CD138+ tumor cells isolated from four relapsed/refractory myeloma patients. Samples underlying datapoints in E are from the same samples used for correlation analysis in D, with the addition of the 25e6–30e6 biological replicate for AMO1, RS411, and MM1 used for correlation as well as three additional primary myeloma patient samples (MM2, MM3, MM4) which were collected with total cellular inputs between 2e6–5e6. For BE, source data are provided as a Source data file. F Quantitative comparison of identified cell membrane proteins in the 25e6 cell input primary sample (x-axis) versus averaged over the four profiled myeloma cell lines (y-axis). Pearson R reported. Source data available in Supplementary Data 1 and 7. G Cell membrane protein intensities in the MM1 sample with 25e6 input. Relevant therapeutic targets and other antigens noted in the manuscript are specifically labeled. H Immuno-targets and biomarker candidates identified using micro scale proteomics on the surface of CD138+ myeloma cells isolated from four patient samples. MaxQuant iBAQ absolute quantification intensity reported. For G, H, source data in Supplementary Data 7. I Schematic of primary myeloma vs. B-cell TMT proteomics experiment. Micro protocol was performed CD138+ cells isolated from an additional five primary myeloma patient samples and B-cells isolated from five healthy donors. Peptides were labeled with TMT-10plex reagents and combined prior to fractionation and LC-MS/MS. J PCA of myeloma and B-cell primary proteomic samples from TMT multiplex. K Comparison of Myeloma and B-cell membrane associated proteomes validates GGT1, ICAM3/CD50, ICAM1/CD54, and LY9 as some of most upregulated primary myeloma surface proteins relative to B-cells (log2-fold change > |1 | ; p < 0.05 in blue). For J, K, source data in Supplementary Data 10. For boxplots in D, E, upper and lower hinges correspond to 25 and 75 percentiles, upper and lower whiskers extend to highest and lowest values within 1.5* IQR of the hinge, small-sized points indicate means, and center line corresponds to the median.

Comment in

References

    1. Ghandi M, et al. Next-generation characterization of the cancer cell line encyclopedia. Nature. 2019;569:503–508. doi: 10.1038/s41586-019-1186-3. - DOI - PMC - PubMed
    1. Liu Y, Beyer A, Aebersold R. On the dependency of cellular protein levels on mRNA abundance. Cell. 2016;165:535–550. doi: 10.1016/j.cell.2016.03.014. - DOI - PubMed
    1. Choudhry P, Galligan D, Wiita AP. Seeking convergence and cure with new myeloma therapies. Trends Cancer. 2018;4:567–582. doi: 10.1016/j.trecan.2018.05.005. - DOI - PMC - PubMed
    1. Bausch-Fluck D, et al. A mass spectrometric-derived cell surface protein atlas. PLoS ONE. 2015;10:e0121314. doi: 10.1371/journal.pone.0121314. - DOI - PMC - PubMed
    1. Bendall SC, et al. Single-cell mass cytometry of differential immune and drug responses across a human hematopoietic continuum. Science. 2011;332:687–696. doi: 10.1126/science.1198704. - DOI - PMC - PubMed

Publication types