. 2022 Jul 15;12(1):12072.
doi: 10.1038/s41598-022-15847-7.

Spatial and temporal patterns of agrometeorological indicators in maize producing provinces of South Africa

Affiliations

Spatial and temporal patterns of agrometeorological indicators in maize producing provinces of South Africa

Christian Simanjuntak et al. Sci Rep. .

Abstract

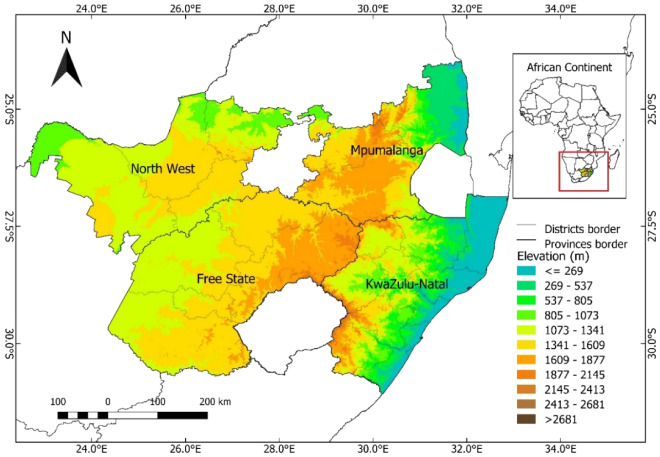
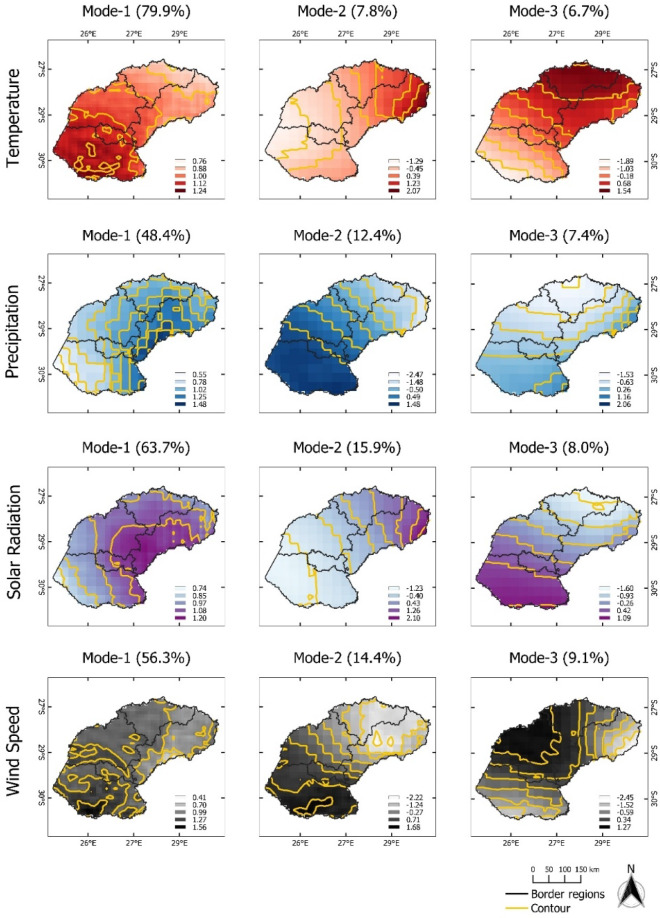
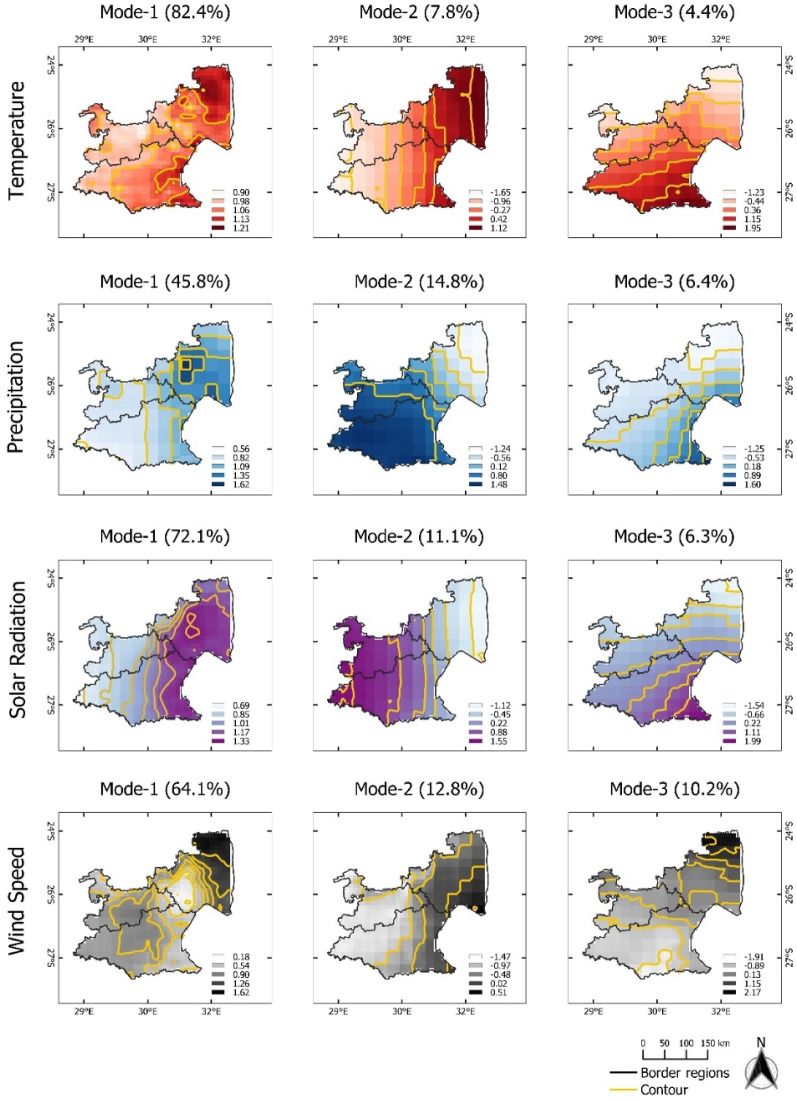
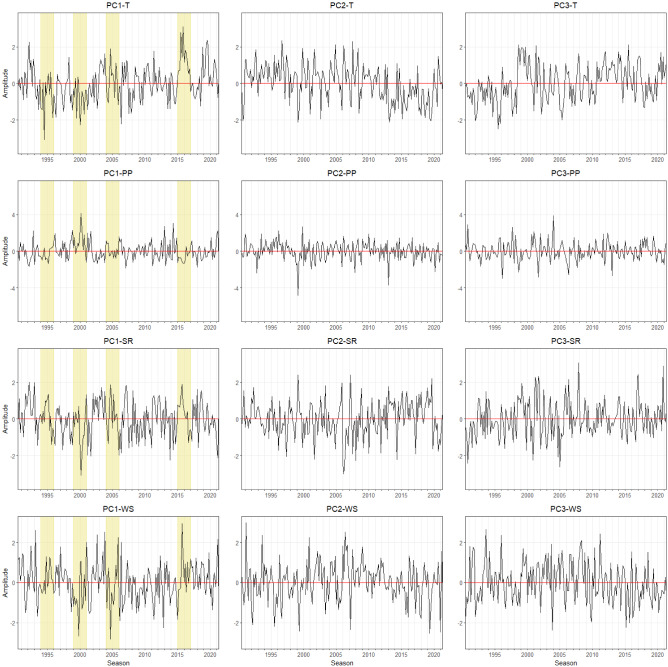
Climate change impacts on maize production in South Africa, i.e., interannual yield variabilities, are still not well understood. This study is based on a recently released reanalysis of climate observations (AgERA5), i.e., temperature, precipitation, solar radiation, and wind speed data. The study assesses climate change effects by quantifying the trend of agrometeorological indicators, their correlation with maize yield, and analyzing their spatiotemporal patterns using Empirical Orthogonal Function. Thereby, the main agrometeorological factors that affected yield variability for the last 31 years (1990/91-2020/21 growing season) in major maize production provinces, namely Free State, KwaZulu-Natal, Mpumalanga, and North West are identified. Results show that there was a significant positive trend in temperature that averages 0.03-0.04 °C per year and 0.02-0.04 °C per growing season. There was a decreasing trend in precipitation in Free State with 0.01 mm per year. Solar radiation did not show a significant trend. Wind speed in Free State increased at a rate of 0.01 ms-1 per growing season. Yield variabilities in Free State, Mpumalanga, and North West show a significant positive correlation (r > 0.43) with agrometeorological variables. Yield in KwaZulu-Natal is not influenced by climate factors. The leading mode (50-80% of total variance) of each agrometeorological variable indicates spatially homogenous pattern across the regions. The dipole patterns of the second and the third mode suggest the variabilities of agrometeorological indicators are linked to South Indian high pressure and the warm Agulhas current. The corresponding principal components were mainly associated with strong climate anomalies which are identified as El Niño and La Niña events.


Conflict of interest statement

The authors declare no competing interests.

Figures

Figure 1
Figure 1
Map of the study area. South African provinces (Free State, KwaZulu-Natal, Mpumalanga, and North West) are shown. (The figure was generated by QGIS 3.16.7-Hannover software, https://www.qgis.org/en/).
Figure 2
Figure 2
Map pattern of factor loadings for the first three modes (columns) derived from an EOF analysis for temperature, precipitation, solar radiation, and wind speed anomalies (rows) observed in the Free State province during the maize growing season of 1990/90–2020/21. Data for the maize growing season was used (cf. “Research data” section). Contour (yellow lines) are used to highlight spatial patterns in agrometeorological data.
Figure 3
Figure 3
Monthly time series of growing season patterns (Principal components, PC) corresponding to EOF-1, EOF-2, and EOF-3 for the Free State province (see Fig. 2). Strong positive or negative anomalies of the dominant mode are highlighted (extreme events). The x-axis ticks indicate the beginning period of growing season. The abbreviations of agrometeorological data (T, PP, SR, WS) refer to Table 1.
Figure 4
Figure 4
Map pattern of factor loadings for the first three modes (columns) derived from an EOF analysis for annual temperature, precipitation, solar radiation, and wind speed anomalies (rows) observed in the KwaZulu-Natal during the maize growing season of 1990/91–2020/21. Data for the maize growing season was used (cf. “Research data” section). Contour as for Fig. 2.
Figure 5
Figure 5
Monthly time series of growing season patterns in maize growing season (principal components, PC) corresponding to EOF-1, EOF-2, and EOF-3 for the KwaZulu-Natal province (see Fig. 4). Strong positive or negative anomalies of the dominant mode are highlighted (extreme events). The x-axis ticks indicate the beginning period of growing season. The abbreviations of agrometeorological data (T, PP, SR, WS) refer to Table 1.
Figure 6
Figure 6
Map pattern of factor loadings for the first three modes (columns) derived from an EOF analysis for annual temperature, precipitation, solar radiation, and wind speed anomalies (rows) observed in the Mpumalanga province during the maize growing season of 1990/91–2020/21. Data for the maize growing season was used (cf. “Research data” section). Contour as for Fig. 2.
Figure 7
Figure 7
Monthly time series of growing season patterns (principal components, PC) corresponding to EOF-1, EOF-2, and EOF-3 for the Mpumalanga province (see Fig. 6). Strong positive or negative anomalies of the dominant mode are highlighted (extreme events). The x-axis ticks indicate the beginning period of growing season. The abbreviations of agrometeorological data (T, PP, SR, WS) refer to Table 1.
Figure 8
Figure 8
Map pattern of factor loadings for the first three modes (columns) derived from an EOF analysis for annual temperature, precipitation, solar radiation, and wind speed anomalies (rows) observed in the North West during the maize growing season of 1990/91–2020/21. Data for the maize growing season was used (cf. “Research data” section). Contour as for Fig. 2.
Figure 9
Figure 9
Monthly time series of growing season patterns (principal components, PC) corresponding to EOF-1, EOF-2, and EOF-3 for the North West province (see Fig. 8). Strong positive or negative anomalies of the dominant mode are highlighted (extreme events). The x-axis ticks indicate the beginning period of growing season. The abbreviations of agrometeorological data (T, PP, SR, WS) refer to Table 1.

References

    1. Luber G, Prudent N. Climate change and human health. Trans. Am. Clin. Climatol. Assoc. 2009;120:113–117. - PMC - PubMed
    1. Drolet JL, Sampson T. Addressing climate change from a social development approach: Small cities and rural communities’ adaptation and response to climate change in British Columbia, Canada. Int. Soc. Work. 2014;60:61–73. doi: 10.1177/0020872814539984. - DOI
    1. Sintayehu DW. Impact of climate change on biodiversity and associated key ecosystem services in Africa: a systematic review. Ecosyst. Health Sustain. 2018;4:225–239. doi: 10.1080/20964129.2018.1530054. - DOI
    1. Islam MS, Kieu E. Tackling regional climate change impacts and food security issues: A critical analysis across ASEAN, PIF, and SAARC. Sustainability. 2020 doi: 10.3390/su12030883. - DOI
    1. IPCC. AR6 Climate change 2021: The physical science basis (2021). - PMC - PubMed

Publication types