. 2022 Jul 15;13(1):4107.
doi: 10.1038/s41467-022-31803-5.

Hepatic non-parenchymal S100A9-TLR4-mTORC1 axis normalizes diabetic ketogenesis

Affiliations

Hepatic non-parenchymal S100A9-TLR4-mTORC1 axis normalizes diabetic ketogenesis

Gloria Ursino et al. Nat Commun. .

Abstract

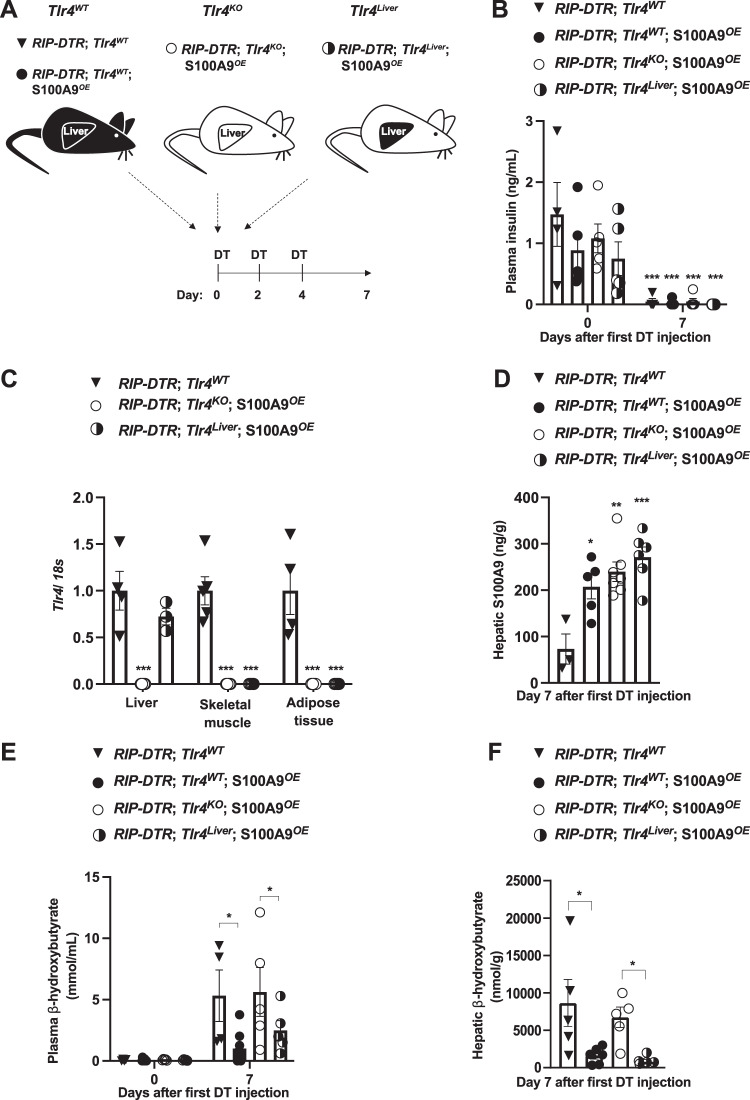
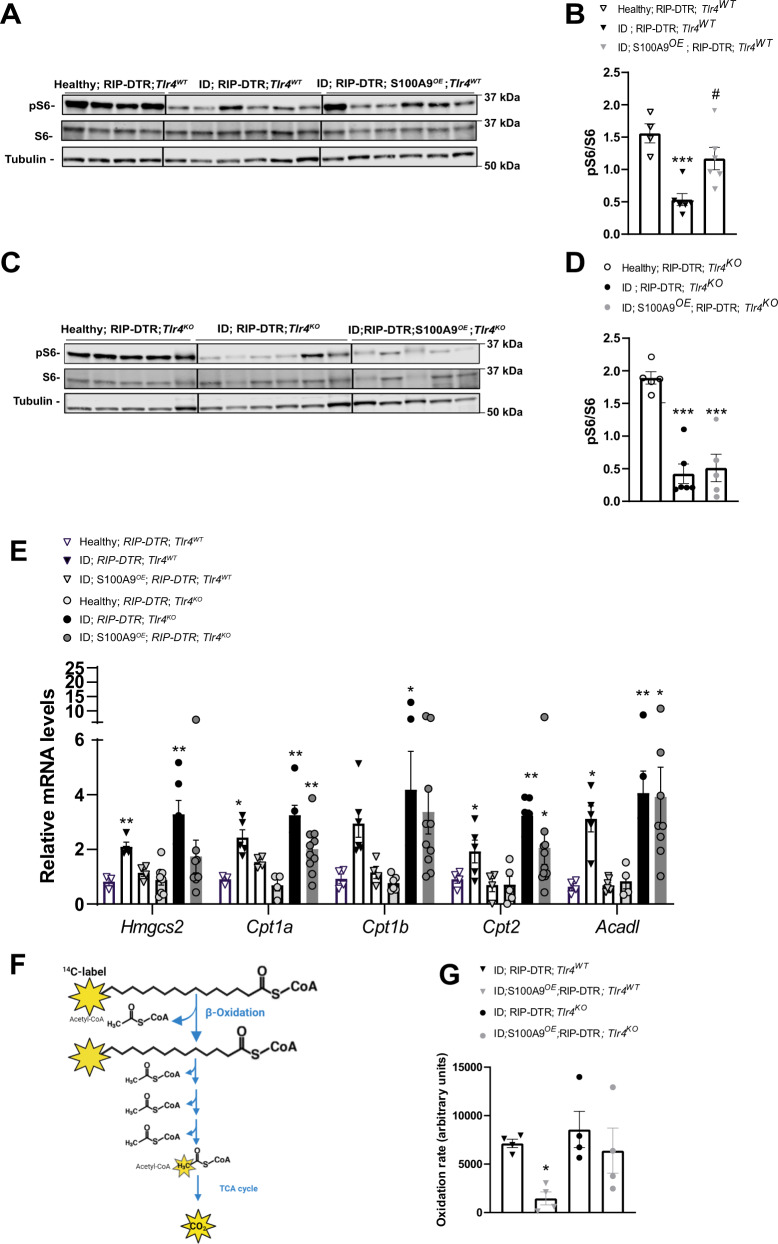
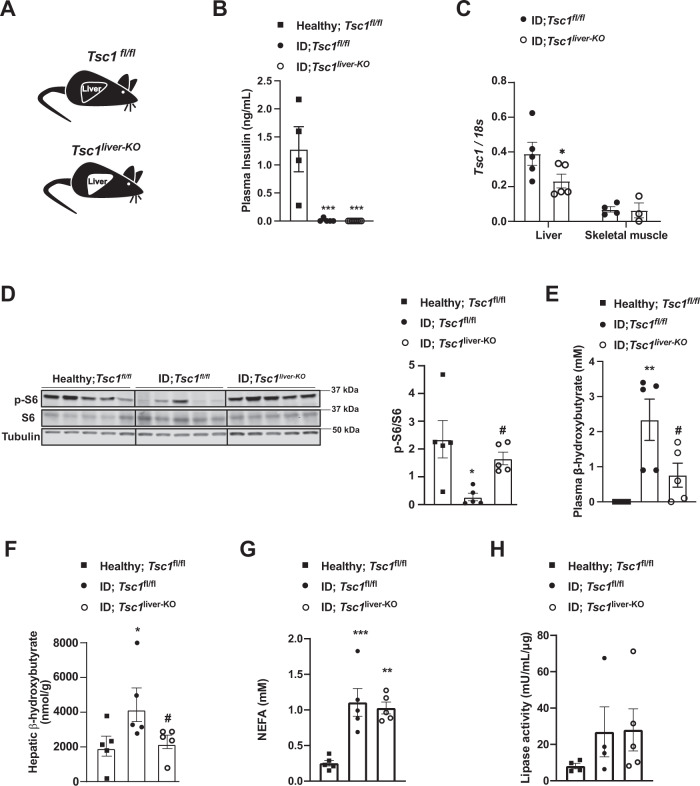
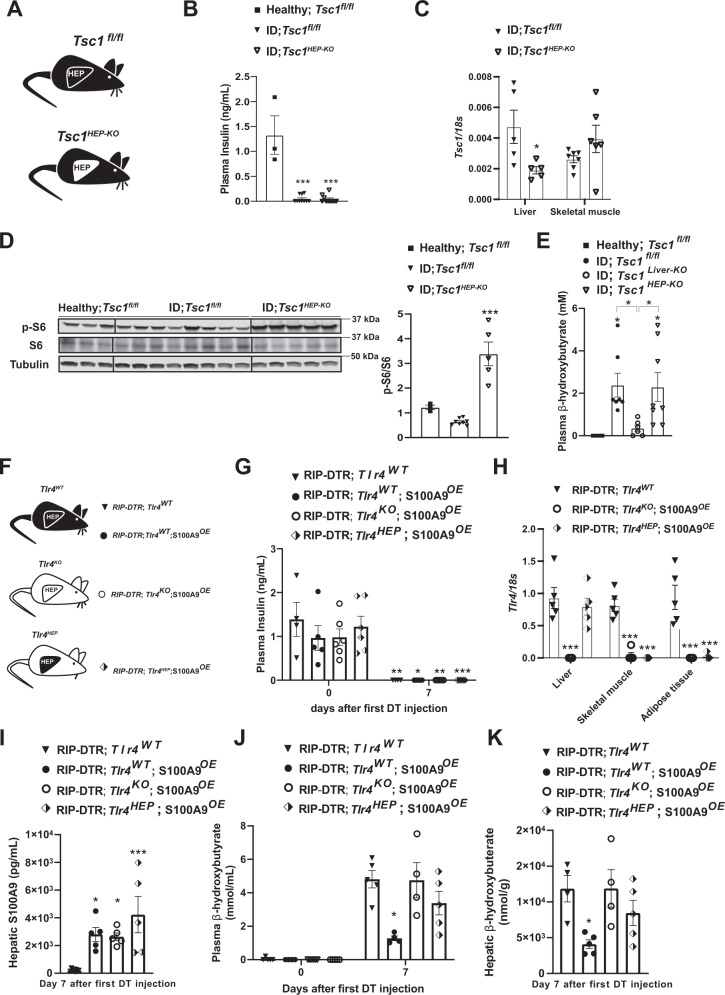
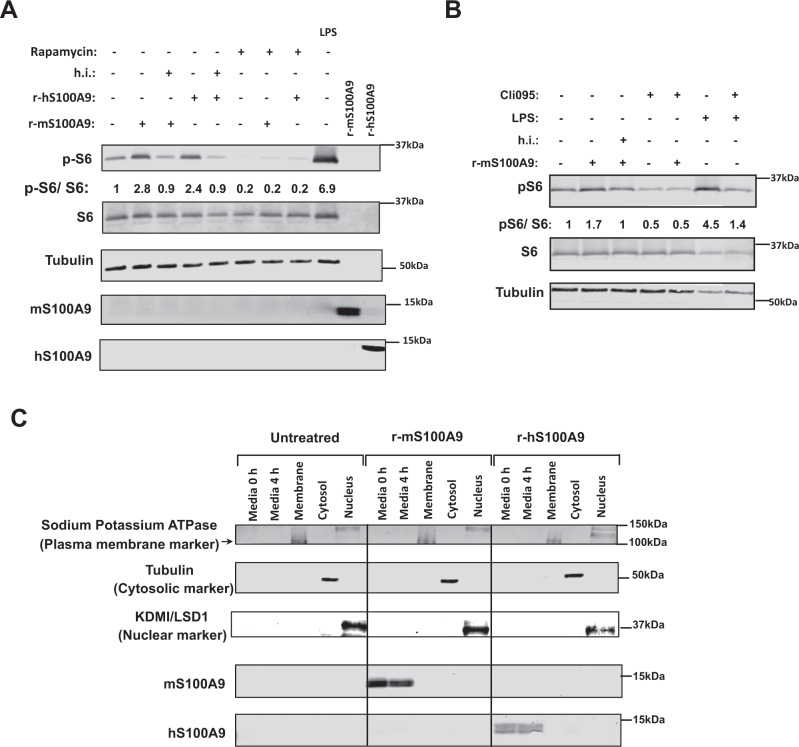
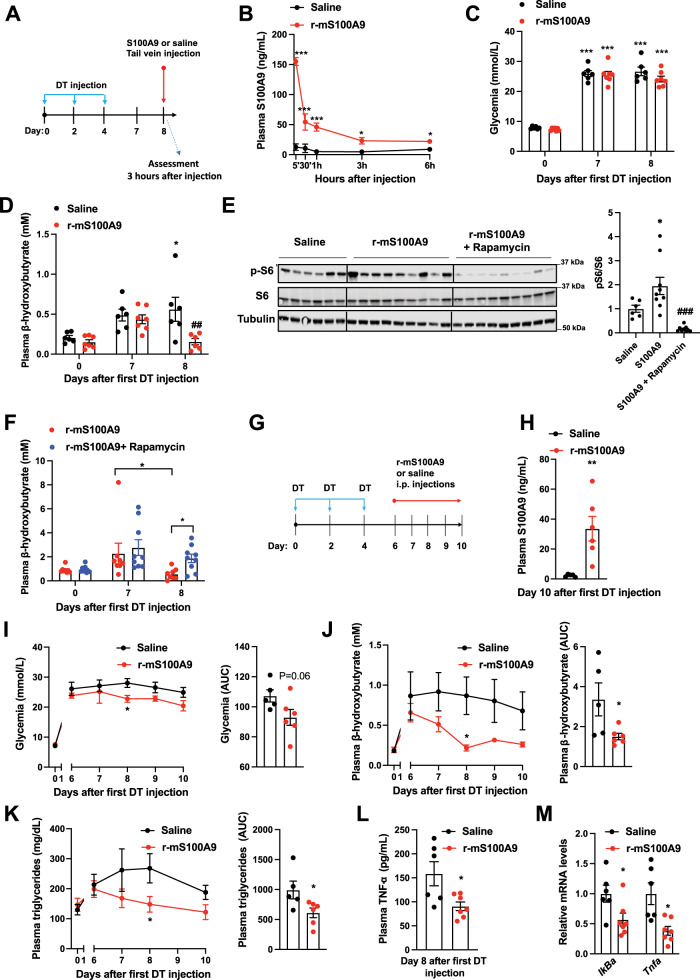
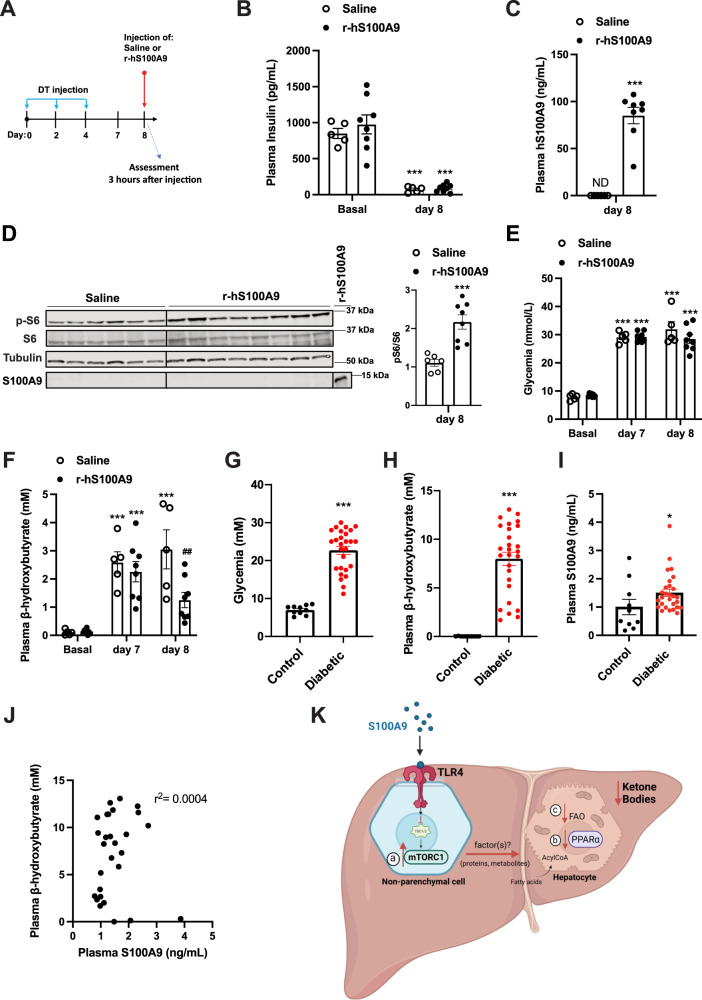
Unrestrained ketogenesis leads to life-threatening ketoacidosis whose incidence is high in patients with diabetes. While insulin therapy reduces ketogenesis this approach is sub-optimal. Here, we report an insulin-independent pathway able to normalize diabetic ketogenesis. By generating insulin deficient male mice lacking or re-expressing Toll-Like Receptor 4 (TLR4) only in liver or hepatocytes, we demonstrate that hepatic TLR4 in non-parenchymal cells mediates the ketogenesis-suppressing action of S100A9. Mechanistically, S100A9 acts extracellularly to activate the mechanistic target of rapamycin complex 1 (mTORC1) in a TLR4-dependent manner. Accordingly, hepatic-restricted but not hepatocyte-restricted loss of Tuberous Sclerosis Complex 1 (TSC1, an mTORC1 inhibitor) corrects insulin-deficiency-induced hyperketonemia. Therapeutically, recombinant S100A9 administration restrains ketogenesis and improves hyperglycemia without causing hypoglycemia in diabetic mice. Also, circulating S100A9 in patients with ketoacidosis is only marginally increased hence unveiling a window of opportunity to pharmacologically augment S100A9 for preventing unrestrained ketogenesis. In summary, our findings reveal the hepatic S100A9-TLR4-mTORC1 axis in non-parenchymal cells as a promising therapeutic target for restraining diabetic ketogenesis.


Conflict of interest statement

G.R. and R.C. are inventors on patent applications related to S100A9 proteins. All other authors declare no competing interests.

Figures

Fig. 1
Fig. 1. S100A9 suppresses diabetic ketogenesis via hepatic TLR4.
A Scheme indicating the generation of RIP-DTR;Tlr4WT (n = 5), RIP-DTR;Tlr4WT; S100A9OE (n = 6), RIP-DTR;Tlr4KO; S100A9OE (n = 7) and RIP-DTR;Tlr4Liver; S100A9OE (n = 6) experimental groups. Adenoviral injections and HTVI were done 3 days before or the same day of the first DT injection, respectively. B Plasma insulin levels of mice at day 0 (i.e., before DT injection) and 7 days after first DT injection (p = 0.001). C mRNA content of Tlr4 in the liver, muscle (gastrocnemius), and adipose tissue (interscapular brown adipose tissue) of indicated groups (p = 0.001). D Hepatic S100A9 content of indicated cohorts 7 days after first DT injection (p = 0.011, p = 0.001 & p = 0.0003). E Plasmatic hepatic β-hydroxybutyrate levels in the indicated cohorts and time after first DT injection (p = 0.017 and p = 0.012) and F hepatic β-hydroxybutyrate levels in the indicated cohorts and time after first DT injection (p = 0.03, p = 0.003). Error bars represent SEM, statistical analyses were done using one-way or two-way ANOVA (Tukey’s post- hoc test). In B, comparison was made to basal values. In CF comparison was made to RIP-DTR; Tlr4WT group or otherwise indicated. *p ≤ 0.05, **p ≤ 0.01, ***p ≤ 0.001. Source data are provided as a source data file.
Fig. 2
Fig. 2. S100A9 overexpression rescues hepatic mTORC1 signaling and dampens ketogenic gene expression.
A RIP-DTR; Tlr4WT mice were made insulin deficient with DT and underwent HTVI with 50ug of either a plasmid encoding for mouse S100A9 (RIP-DTR; S100A9OE) (n = 6) or empty vector (n = 6). 7 days after the first DT injection these mice were fasted for 3 h and sacrificed along with healthy controls (n = 4) and liver lysates were analyzed by immunoblotting for the indicated proteins and phosphorylation states. B Densitometry of pS6/S6 ratio of immunoblot from A (p = 0.009 and p = 0.01). C RIP- DTR; Tlr4KO mice were made insulin deficient with DT and underwent HTVI of 50 ug of either a plasmid encoding for mouse S100A9 (RIP-DTR; S100A9OE) (n = 5) or empty vector (n = 6). 7 days after first DT injection mice were fasted for 3 h and liver lysates from these and healthy controls (n = 5) were analysed by immunoblotting for the indicated proteins and phosphorylation states D Densitometry of pS6/S6 ratio of immunoblot from (p = 0.0001) C. E qRT-PCR analysis of genes from liver of Tlr4WT healthy, ID (7 days after the first DT injection) and ID S100AOE groups (n/group = 4, 5 and 4) and Tlr4KO healthy, ID and ID;S100A9OE groups (n/group = 7, 6 and 8) indicated. Values are relative to healthy RIP-DTR; Tlr4WT mice (Hmgcs2: P = 0.005, 0.002; Cpt1a p = 0.04, p = 0.001, p = 0.001; Cpt2 p = 0.02, p = 0.0026, p = 0.0314, Acadl p = 0.03, p = 0.0021, p = 0.0324). F Schematic overview of metabolic 1-14C-palmitic acid tracing assay. G Hepatic fatty acid oxidation rate (using 1-14C-palmitic acid) (n/group = 4, 5, 4 and 4) (p = 0.0517). Error bars represent SEM, statistical analyses were done using one way or two-way ANOVA (Tukey’s post-hoc test). In B, D, * and # indicate comparison to healthy group and between ID groups, respectively. *P < 0.05, **P < 0.01, ***P < 0.01 #P < 0.05, ##P < 0.01, ###P < 0.001. Source data are provided as a source data file.
Fig. 3
Fig. 3. Liver specific up-regulation of mTORC1 signaling prevents hyperketonemia in ID.
A Experimental groups. Homozygous Tuberous sclerosis complex 1 floxed (Tsc1fl/fl) mice were administered 1 × 10^9 PFU Adenovirus serotype 5 expressing Cre and GFP (Cre recombinantion results in a Tsc1 null allele in the liver of Tsc1fl/fl mice): Tsc1liver-KO. Control mice were treated with 1 × 10^9 PFU Adenovirus serotype 5 expressing only GFP: Tsc1fl/fl. B Plasma insulin levels of insulin deficient mice and healthy controls (p = 0.0003 and p = 0.0001). C mRNA content of Tcs1 in the liver (p = 0.0584) and skeletal muscle (gastrocnemius) of the indicated groups. D Image of immunoblot for the indicated proteins and phosphorylation states and relative densitometry quantification of pS6/S6 (p = 0.011, p = 0.05). E Plasmatic β-hydroxybutyrate levels of indicated groups (p = 0.008, p = 0.048). G Plasma NEFAs level (p = 0.008, p = 0.002). H Lipase activity from perigonadal fat. (n/group = 5, 5 and 5) Error bars represent SEM. Statistical analyses were done using one-way ANOVA (Tukey’s post-hoc test, except for F in which FDR was used) (* and # indicate comparison to healthy and to control mice, respectively), except for C for which analysis were done using a two- tailed unpaired Student’s t-test. *P < 0.05, **P < 0.01, ***P < 0.001, #P ≤ 0.05, ##P ≤ 0.01. Western blot images shown in D are cropped images. Source data are provided as a source data file.
Fig. 4
Fig. 4. S100A9 suppresses diabetic ketogenesis by activating hepatic mTORC1/TLR4 axis in non-parenchymal hepatic cells.
A Experimental groups. Homozygous Tuberous sclerosis complex 1 floxed (Tsc1fl/fl) mice were administered 1 × 10^9 PFU Adenovirus serotype 8 expressing Cre and GFP (Cre recombinantion results in a Tsc1 null allele in the hepatocytes of Tsc1fl/fl mice): Tsc1HEP-KO. Control mice were treated with 1 × 10^9 PFU Adenovirus serotype 8 expressing only GFP: Tsc1fl/fl and analysed alongside healthy controls (n/group = 3, 8 and 5). B Plasma insulin levels of insulin deficient mice and healthy controls (p = 0.0001). C mRNA content of Tcs1 in the liver (p = 0.0571) and skeletal muscle (gastrocnemius) of the indicated groups. D Image of immunoblot for the indicated proteins and phosphorylation states and relative densitometry quantification of pS6/S6 (p = 0.006). E Plasmatic β-hydroxybutyrate levels of indicated groups (p = 0.028 and p = 0.055). F Experimental groups (n/group = 4, 5, 6 and 5). G Plasma insulin levels of mice at day 0 (i.e., before DT injection) and 7 days after first DT injection (p = 0.001, p = 0.022, p = 0.0076 and p = 0.0005). H mRNA content of Tlr4 in the liver, muscle (gastrocnemius), and adipose tissue (interscapular brown adipose tissue) of indicated groups (p = 0.0001). I Hepatic S100A9 content of indicated cohorts 7 days after first DT injection (p = 0.017, p = 0.027 and p = 0.0004). J Plasmatic hepatic β-hydroxybutyrate levels (p = 0.013). K hepatic β-hydroxybutyrate levels in the indicated cohorts and time after first DT injection (p = 0.021). Error bars represent SEM, statistical analyses were done using one-way or two-way ANOVA (Tukey’s post- hoc test). Comparisons were made to RIPDTR; Tlr4WT group or in B and D to to healthy group or otherwise indicated. *p ≤ 0.05, **p ≤ 0.01, ***p ≤ 0.001. Source data are provided as a source data file.
Fig. 5
Fig. 5. Extracellular S100A9 activates mTORC1 signaling in a cell-autonomous fashion.
A RAW264.7 cells were incubated with 2 μg/mL of r-mS100A9 or r-hS100A9 (or their heat inactivated (h.i) forms) or 1 μg/mL of lipopolysaccharides (LPS, from E.coli O111:B4, Sigma) for 4 h, with or without 20 uM Rapamycin and cell lysates were analyzed by western blot. B RAW264.7 cells were incubated wit 2 μg/mL of r-mS100A9 or (or its heat inactivated form) in the presence or absence of 1 μg/mL of Cli095 (Invivogen) and cell lysates were analyzed by western blot. C RAW264.7 cells were incubated with 2 μg/mL of r-mS100A9 or r-hS100A9. Cells were fractionated and membrane, cytosolic and nuclear fractions were subjected to western blot alongside culture media. (n = 1 × 10^6 cells examined). Western blot images shown in B are cropped images. Source data are provided as a source data file.
Fig. 6
Fig. 6. Efficacy and safety of recombinant S100A9 administration in ID mice.
A RIP- DTR mice were treated at day 0, 2, and 4 with DT and at day 8, were injected via tail vein with either saline (n = 6) or 0.6 mg/kg of r-mS100A9 (n = 7) (alone or in combination with intraperitoneal injection with 10 mg/kg of rapamycin) (n/group = 6, 9 and 9). Metabolic assessments were done 3 h after injection and food removal. B Plasma level of S100A9 after injection of r-mS100A9 or saline (p = 0.001, p = 0.001, p = 0.001, p = 0.02, p = 0.03). C Glycemia (p = 0.001) and D plasma level of β-hydroxybutyrate of ID mice treated with 1 injection of r-mS100A9 or saline (p = 0.04 and p = 0.007). E Immunoblot from liver lysates and on the right bars indicating relative quantification of pS6/S6 (p = 0.012 and p = 0.0002). F Plasma level of β-hydroxybutyrate of ID mice treated with 1 injection of r-mS100A9 alone or in combination with rapamycin (rapamycin was injected at the same time of r-mS100A9 and values taken 3 h later) (p = 0.016 and p = 0.055). G RIP-DTR mice were treated at day 0, 2, and 4 with DT and starting from day 6, were intraperitoneally injected 2 times/day (9 am and 6 pm) with either 0.6 mg/kg of r-mS100A9 (n = 6) or saline (n = 5) (200 μl total volume) and here we show their values of H plasma S100A9 (p = 0.008), I daily glycemia (p = 0.01) (and area and the curve of glycemia from day 6), and J daily ketonemia (p = 0.015 and p = 0.038) (and area and the curve of ketonemia from day 6), K Daily triglyceridemia (p = 0.048) and area under the curve of tryglyceridemia from day 6) (p = 0.042). L Plasma level of TNF-a, (p = 0.02) and M level of hepatic IkBa (p = 0.036) and Tnfa (p = 0.017) mRNA. In all groups, glycemia and plasma were obtained at noon after 3 h of food removal. Error bars represent SEM. In BF and IK, statistical analyses were done using one or two-ways ANOVA (Tukey’s post-hoc test) except in 6 F where FDR was used * and # indicate comparison to basal and to saline treatment (at the same time), respectively. Statistical analyses in H, L and M were done using a two-tailed unpaired Student’s t-test. *P < 0.05, **P < 0.01, ***P < 0.001, #P < 0.05, ##P < 0.01, ###P < 0.001. Source data are provided as a source data file.
Fig. 7
Fig. 7. Clinical relevance of recombinant S100A9 as an anti-diabetic therapeutic.
A RIP- DTR mice were treated at day 0, 2, and 4 with DT and at day 8, were injected via tail vein with either saline (n = 5) or 0.6 mg/kg of r-hS100A9 (n = 8). Metabolic assessments were done 3 h after injection and food removal. B Plasma insulin level (p = 0.0001), C human S100A9 plasma level (p = 0.0001), D indicated hepatic protein levels (p = 0.0006), E glycemia (p = 0.0001), and F ketonemia (p = 0.001, p = 0.001, p = 0.001 and p = 0.009), of ID mice treated with 1 injection of saline or r- hS100A9. G Glycemia (p = 0.0001). H Ketonemia (p = 0.0001), and I plasmatic S100A9 content in healthy (n = 10) and decompensated diabetic subjects (n = 23) (p = 0.034). J Correlation analysis between ketone and S100A9 levels in decompensated type 1 diabetic subjects. K Our model predicts that extracellular S100A9 activates non-parenchymal hepatic TLR4 signaling which consequently leads to several downstream events. These include a) activation of the mTORC1 pathway, b) dampening of the PPARα targets and c) reduction of fatty acid oxidation in hepatocytes all of which contribute to the significant regression of the elevated ketogenesis caused by pancreatic beta-cell loss/dysfunction. This figure was created with BioRender.com. Error bars represent SEM. Statistical analyses in C, D and GI were done using two-tailed unpaired Student’s t-test. Statistical analyses in B, E and F were done using two-ways ANOVA (Tukey’s post-hoc test). * and # indicate comparison to basal and to saline treatment (at the same time), respectively (except when differently indicated: in F). The correlation analysis in J was performed by using Spearman rank-correlation test. *P < 0.05, **P < 0.01, ***P < 0.001, ##P < 0.01. Western blot images shown in D are cropped images. Source data are provided as a source data file.

Similar articles

Cited by

References

    1. Cahill GF., Jr. Fuel metabolism in starvation. Annu Rev. Nutr. 2006;26:1–22. doi: 10.1146/annurev.nutr.26.061505.111258. - DOI - PubMed
    1. Puchalska P, Crawford PA. Multi-dimensional Roles of Ketone Bodies in Fuel Metabolism, Signaling, and Therapeutics. Cell Metab. 2017;25:262–284. doi: 10.1016/j.cmet.2016.12.022. - DOI - PMC - PubMed
    1. Grabacka, M., Pierzchalska, M., Dean, M. & Reiss, K. Regulation of Ketone Body Metabolism and the Role of PPARalpha. Int. J. Mol. Sci.17, 10.3390/ijms17122093 (2016). - PMC - PubMed
    1. Bock H, Fleischer S. Preparation of a homogeneous soluble D-beta-hydroxybutyrate apodehydrogenase from mitochondria. J. Biol. Chem. 1975;250:5774–5761. doi: 10.1016/S0021-9258(19)41121-6. - DOI - PubMed
    1. Lehninger AL, Sudduth HC, Wise JB. D-beta-Hydroxybutyric dehydrogenase of muitochondria. J. Biol. Chem. 1960;235:2450–2455. doi: 10.1016/S0021-9258(18)64641-1. - DOI - PubMed

Publication types

LinkOut - more resources