. 2022 Jul 15;12(1):12103.
doi: 10.1038/s41598-022-16267-3.

Quantitative evaluation of intraorbital optic nerve in optic atrophy using diffusion tensor imaging

Affiliations

Quantitative evaluation of intraorbital optic nerve in optic atrophy using diffusion tensor imaging

Eun Hee Hong et al. Sci Rep. .

Abstract

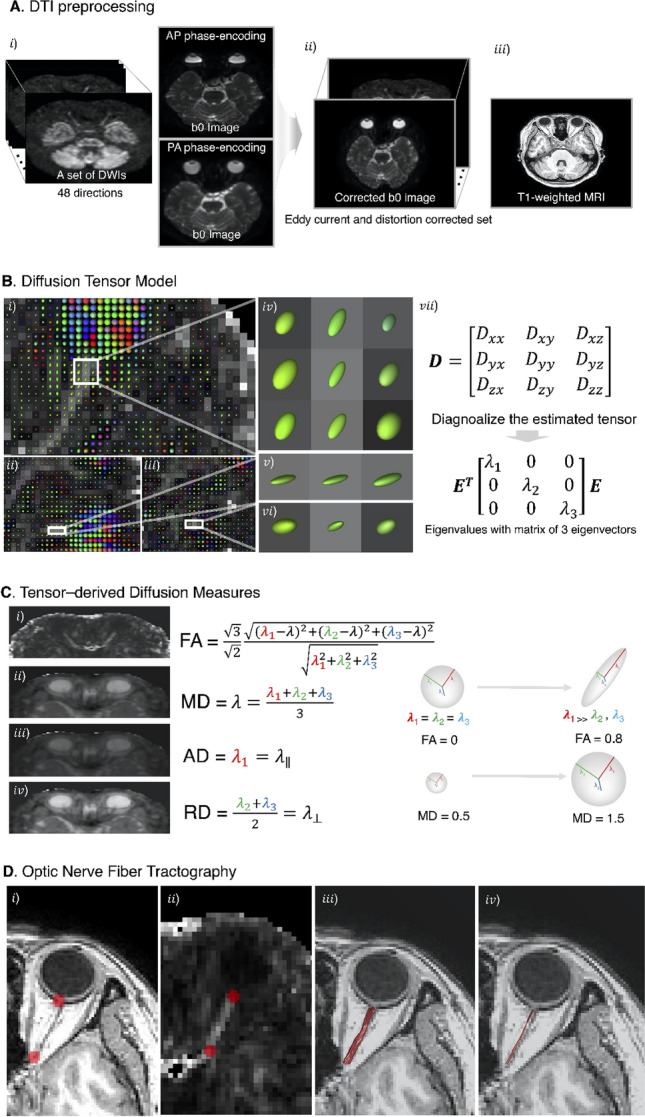
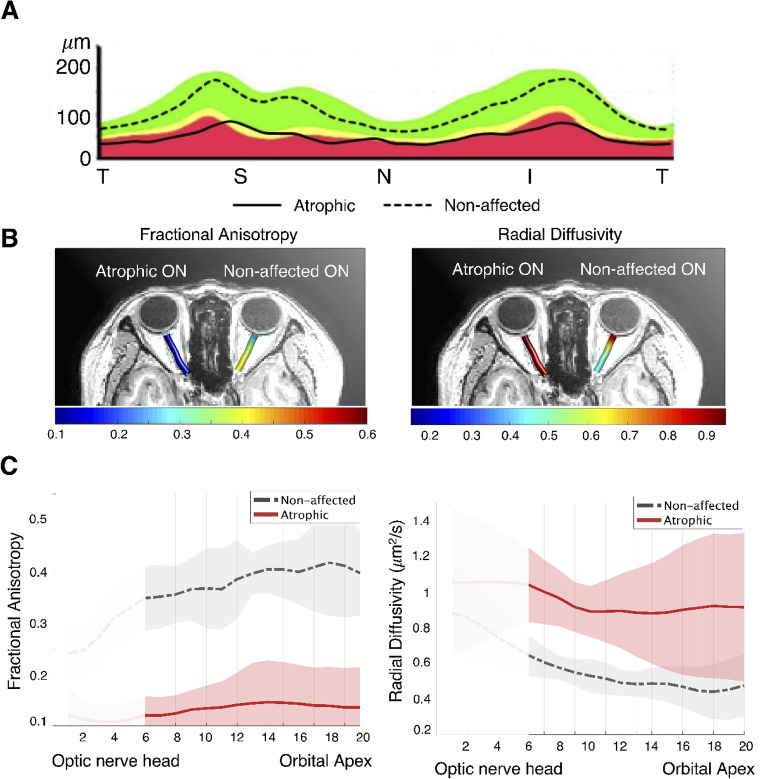
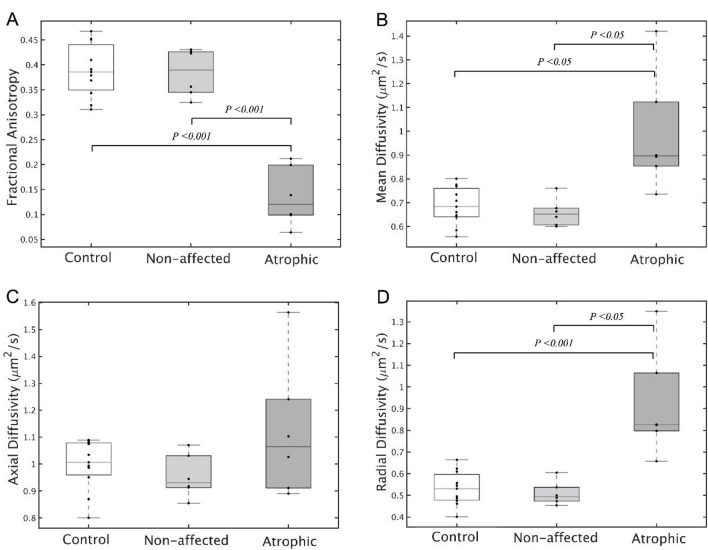
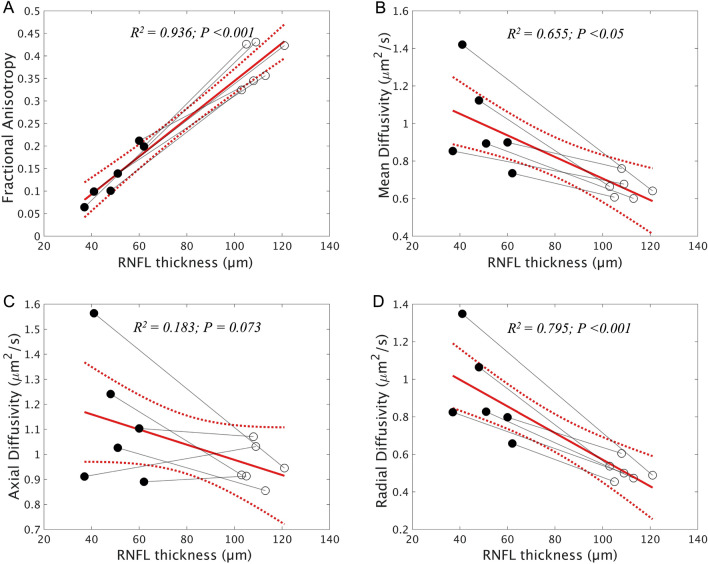
The aim of this study is to quantitatively investigate the microstructural properties of the optic nerve (ON) in vivo using diffusion tensor imaging (DTI) in patients with unilateral optic atrophy (OA) and to determine their association with retinal nerve fiber layer (RNFL) thickness of the optic nerve head (ONH). Six patients with unilateral OA and 11 control subjects underwent DTI. ONs from ONH to the orbital apex were tracked. Fractional anisotropy (FA), mean diffusivity (MD), axial diffusivity (AD), and radial diffusivity (RD) were computed in both ONs and their correlation with RNFL thickness measured using optical coherence tomography was also analyzed. FA of atrophic ON was lower than that of non-affected and control ONs (atrophic [A], 0.136 ± 0.059; non-affected [N], 0.384 ± 0.048; control [C], 0.389 ± 0.053). MD and RD of atrophic ONs were higher than those of non-affected and control ONs (MD, A, 0.988 ± 0.247; N, 0.658 ± 0.058; C, 0.687 ± 0.079; RD, A, 0.920 ± 0.247; N, 0.510 ± 0.054; C, 0.532 ± 0.078). All DTI measures of atrophic ON except for AD showed a significant correlation with RNFL thickness of ONH; FA showed the strongest correlation, followed by RD and MD (FA, R2 = 0.936, P < 0.001; RD, R2 = 0.795, P < 0.001; MD, R2 = 0.655, P = 0.001). This study reports quantitative analysis of the ON using DTI and differences in DTI measures between atrophic and normal ONs. The significant correlation between DTI measures and RNFL thickness suggests the applicability of DTI as a clinical tool to evaluate the ON.


Conflict of interest statement

The authors declare no competing interests.

Figures

Figure 1
Figure 1
Overview of diffusion tensor imaging (DWI) analysis. (A) Preprocessing of raw DWI data. A set of 50 images was acquired from each participant, including 48 sampling directions and two b0 images of anteroposterior (AP) and posteroanterior (PA) phase-encoding directions (i). One corrected b0 image was generated, and the entire diffusion data was applied by estimating artifacts from two pairs of b0 images (ii). Finally, a set of 49 images was co-registered to the T1 image (iii). (B) Diffusion tensor model. To represent the optic nerve in the axial (i), sagittal (ii), and coronal (iii) views on the FA image, diffusion directionality was color-coded with green representing anterior–posterior directions, red representing left–right directions, and blue representing superior-inferior directions for a single subject using FSL eyes. A close-up view of 3 × 3 voxels of the optic nerve behind the eye globe in the axial (iv), three voxels in the sagittal (v), and three voxels in the coronal views (vi). The diffusion tensor D was estimated from a set of DWIs. The three orthotropic axes of a diffusion ellipsoid can be determined by the decomposition of the tensor into eigenvectors and eigenvalues (vii). (C) Tensor-derived diffusion measures. Cropped image of the fractional anisotropy (FA) (i), mean diffusivity (MD) (ii), axial diffusivity (AD) (iii), and radial diffusivity (RD) (iv). FA values are bounded between zero (a perfect sphere) and one (an infinitely long cigar shape). MD is the mean of the eigenvalues of the diffusion tensor. AD indicates an eigenvalue of λ1, which is diffusivity along the principal axes, while RD is diffusivity along non-principal axes by averaging the eigenvalues of λ2 and λ3. (D) Optic nerve fiber tractography. Two spherical regions of interest (ROIs) are placed posterior to the globe of the eye and in the orbital apex at the center of the annulus of Zinn to identify the optic nerve pathway. Placement of the two ROIs overlaid on T1 (i) and FA image (ii). Visualization for cleaned optic nerve tractography (iii) and a central fiber in the optic nerve passing through the ROI (iv).
Figure 2
Figure 2
Visualization of the average peripapillary retinal nerve fiber layer (RNFL) thickness, diffusion measures, and tract profiles of six patients with optic nerve atrophy. (A) A plot indicating the average temporal-superior-nasal-inferior-temporal RNFL thickness of optic nerve head, measured at a circle with a diameter of 3.4 mm centered on the disc by optical coherence tomography. The RNFL thickness of the atrophic eyes (solid line) was significantly reduced compared to that of contralateral non-affected eyes (dashed line). (B) Optic nerve pathway mapping by the average fractional anisotropy and radial diffusivity (μm2/s) values for six atrophic optic nerves (ONs) and six non-affected ONs are presented in the left and right, respectively. (C) Average tract profiles across the ONs of six atrophic (red) eyes and six non-affected (gray) eyes plotted by mean lines with standard deviation and each node marked with dotted lines. Five nodes nearest the optic nerve head were excluded from the analysis and are shaded white in the graph.
Figure 3
Figure 3
Comparison of diffusion measures of atrophic optic nerves (ONs) to those of non-affected ONs and control ONs. Comparison of averaged optic nerve fractional anisotropy (FA) (A), mean diffusivity (MD) (B), axial diffusivity (AD) (C), radial diffusivity (RD) (D) in controls (n = 11) and patients (n = 6) with the light gray boxplot for non-affected eyes and dark gray boxplot for eyes with atrophic optic nerves. On each box, the central mark is the median, the edges of the box are the 25th and 75th percentiles, and data points are plotted individually. Significant differences are denoted by the marked line with the p-value.
Figure 4
Figure 4
Correlation of diffusion measures and retinal nerve fiber layer (RNFL) thickness of the optic nerve head of atrophic ONs in patients with unilateral optic atrophy. Correlation between average RNFL thickness and average fractional anisotropy (A), mean diffusivity (B), axial diffusivity (C), and radial diffusivity (D). Correlations within patients are indicated by each solid gray line, with closed points marking eyes with atrophic optic nerves and open points marking non-affected eyes. A least-squares regression estimate is indicated by the solid line with red color and its 95% confidence bounds as the dashed line.

References

    1. Forrester JV, Dick AD, McMenamin PG, Roberts F, Pearlman E. The Eye: Basic Sciences in Practice: Chapter 1: Anatomy of the Eye and Orbit. Elsevier; 2016.
    1. Becker M, Masterson K, Delavelle J, Viallon M, Vargas MI, Becker CD. Imaging of the optic nerve. Eur. J. Radiol. 2010;74:299–313. doi: 10.1016/j.ejrad.2009.09.029. - DOI - PubMed
    1. Basser PJ, Mattiello J, LeBihan D. MR diffusion tensor spectroscopy and imaging. Biophys. J. 1994;66:259–267. doi: 10.1016/S0006-3495(94)80775-1. - DOI - PMC - PubMed
    1. Moseley M. Diffusion tensor imaging and aging—A review. NMR Biomed. 2002;15:553–560. doi: 10.1002/nbm.785. - DOI - PubMed
    1. Le Bihan D, Johansen-Berg H. Diffusion MRI at 25: Exploring brain tissue structure and function. Neuroimage. 2012;61:324–341. doi: 10.1016/j.neuroimage.2011.11.006. - DOI - PMC - PubMed

Publication types

MeSH terms