. 2022 Jul 15;12(1):12084.
doi: 10.1038/s41598-022-16341-w.

Identification of multi-omics biomarkers and construction of the novel prognostic model for hepatocellular carcinoma

Affiliations

Identification of multi-omics biomarkers and construction of the novel prognostic model for hepatocellular carcinoma

Xiao Liu et al. Sci Rep. .

Abstract

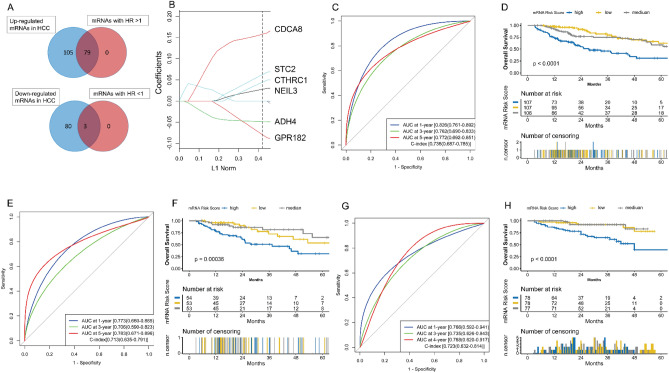
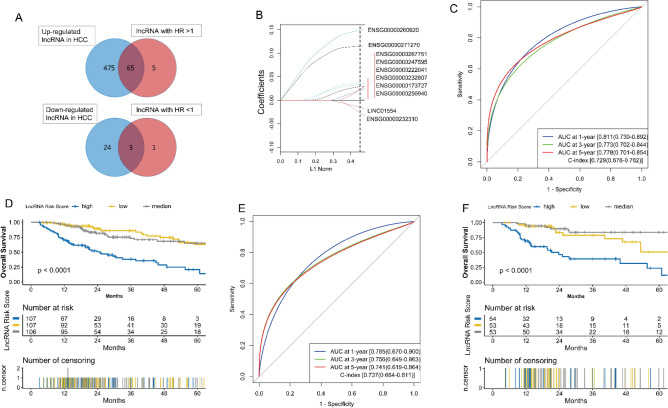
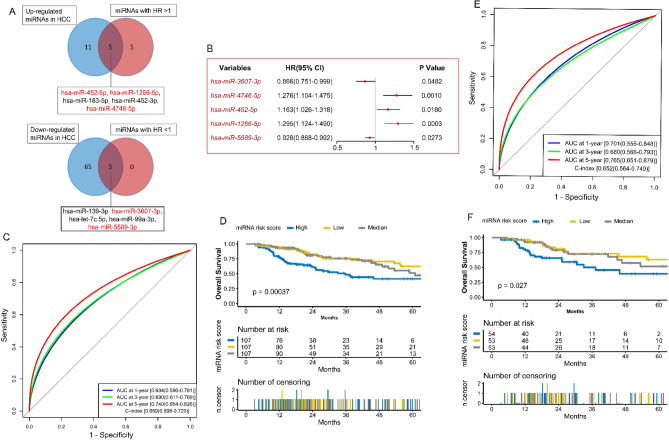
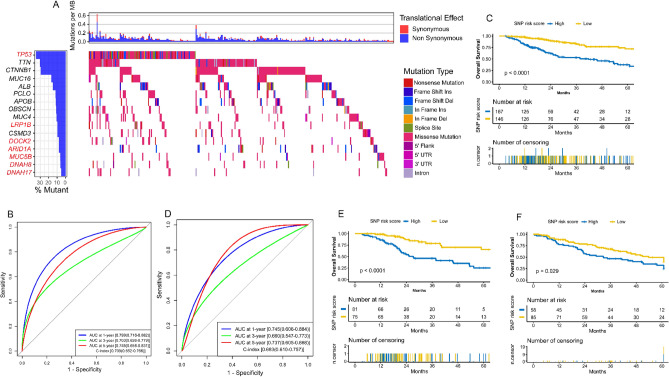
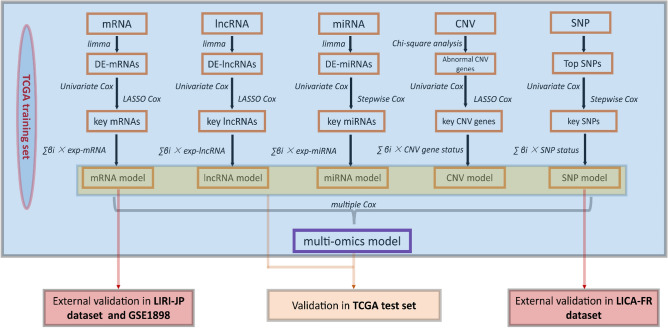
Genome changes play a crucial role in carcinogenesis, and many biomarkers can be used as effective prognostic indicators in various tumors. Although previous studies have constructed many predictive models for hepatocellular carcinoma (HCC) based on molecular signatures, the performance is unsatisfactory. Because multi-omics data can more comprehensively reflect the biological phenomenon of disease, we hope to build a more accurate predictive model by multi-omics analysis. We use the TCGA to identify crucial biomarkers and construct prognostic models through difference analysis, univariate Cox, and LASSO/stepwise Cox analysis. The performances of predictive models were evaluated and validated through survival analysis, Harrell's concordance index (C-index), receiver operating characteristic (ROC) curve, and decision curve analysis (DCA). Multiple mRNAs, lncRNAs, miRNAs, CNV genes, and SNPs were significantly associated with the prognosis of HCC. We constructed five single-omic models, and the mRNA and lncRNA models showed good performance with c-indexes over 0.70. The multi-omics model presented a robust predictive ability with a c-index over 0.77. This study identified many biomarkers that may help study underlying carcinogenesis mechanisms in HCC. In addition, we constructed multiple single-omic models and an integrated multi-omics model that may provide practical and reliable guides for prognosis assessment.


Conflict of interest statement

The authors declare no competing interests.

Figures

Figure 1
Figure 1
Construction and validation of the mRNA model. (A) Selection of mRNAs with HR > 1 and up-regulation, and mRNAs with HR < 1 and down-regulation in HCC. (B) LASSO coefficients of the six key mRNAs. The dotted vertical line is drawn at the λ value chosen by the minimum criteria. L1 Norm represents the summation of absolute nonzero coefficients at each λ. Y-axis represents the values of nonzero coefficients at each λ. (C) The evaluation of the mRNA model via the ROC curve and C-index in the TCGA training set. (D) Kaplan–Meier survival analysis of the different risk groups stratified with the trisection of the mRNA risk score in the TCGA training set. (E) The verification of the mRNA model via the ROC curve and C-index in the TCGA test set. (F) The verification of the mRNA model with Kaplan–Meier survival analysis in the TCGA test set. (G) The external validation of the mRNA model via the ROC curve and C-index in the LIRI-JP dataset. (H) The external validation of the mRNA model with Kaplan–Meier survival analysis in the LIRI-JP dataset. HCC hepatocellular carcinoma, TCGA The Genome Cancer Atlas, C-index Harrell’s concordance index, ROC receiver operating characteristic, AUC area under the curve, LASSO least absolute shrinkage and selection operator, HR hazard rate ratio.
Figure 2
Figure 2
Construction and validation of the lncRNA model. (A) Selection of lncRNAs with HR > 1 and up-regulation, and lncRNAs with HR < 1 and down-regulation in HCC. (B) LASSO coefficients of the ten key lncRNAs. (C) The evaluation of the lncRNA model via the ROC curve and C-index in the TCGA training set. (D) Kaplan–Meier survival analysis of the different risk groups stratified with the trisection of the lncRNA risk score in the TCGA training set. (E) The verification of the lncRNA model via the ROC curve and C-index in the TCGA test set. (F) The validation of the lncRNA model with Kaplan–Meier survival analysis in the TCGA test set. HCC hepatocellular carcinoma, TCGA The Genome Cancer Atlas, C-index Harrell’s concordance index, ROC receiver operating characteristic, AUC area under the curve, LASSO least absolute shrinkage and selection operator, HR hazard rate ratio.
Figure 3
Figure 3
Construction and validation of the miRNA model. (A) Selection of miRNAs with HR > 1 and up-regulation, and miRNAs with HR < 1 and down-regulation in HCC. (B) Univariate Cox regression analysis of the five key miRNAs. (C) The evaluation of the miRNA model via the ROC curve and C-index in the TCGA training set. (D) Kaplan–Meier survival analysis of the different risk groups stratified with the trisection of the miRNA risk score in the TCGA training set. (E) The verification of the miRNA model via the ROC curve and C-index in the TCGA test set. (F) The validation of the miRNA model with Kaplan–Meier survival analysis in the TCGA test set. HCC hepatocellular carcinoma, TCGA The Genome Cancer Atlas, C-index Harrell’s concordance index, ROC receiver operating characteristic, AUC area under the curve, HR hazard rate ratio.
Figure 4
Figure 4
Construction and validation of the CNV model. (A) Circos plot shows genes with different copy number alterations between HCC and non-tumor samples. The blue dots represent genes with copy number loss, and the black dots represent genes with copy number gain. (B) LASSO coefficients of the five key CNV genes. (C) The evaluation of the CNV model via ROC curve and C-index in the TCGA training set. (D) Kaplan–Meier survival analysis of the different risk groups stratified with the CNV risk score in the TCGA training set. Patients with no copy number alteration of the five key CNV genes were attributed to the low-risk group and the others to the high-risk group. (E) The verification of the CNV model via the ROC curve and C-index in the TCGA test set. (F) The validation of the CVN model with Kaplan–Meier survival analysis in the TCGA test set. HCC hepatocellular carcinoma, TCGA The Genome Cancer Atlas; C-index, Harrell’s concordance index, ROC receiver operating characteristic, AUC area under the curve, LASSO Least absolute shrinkage and selection operator, CNV copy number variation.
Figure 5
Figure 5
Construction and validation of the SNP model. (A) Distributions of various mutation types of the sixteen high-frequency SNPs. The histogram at the top indicates the sum of non-synonymous and synonymous mutations in every case. The histogram on the right stands for the sample number suffering from a gene mutation. The different colors stand for various mutation types in the heatmap, whereas the white represents no mutation. (B) The evaluation of the SNP model via the ROC curve and C-index in the TCGA training set. (C) Kaplan–Meier survival analysis of the different risk groups stratified with the SNP risk score in the TCGA training set. Patients with no mutation of the seven key SNPs were attributed to the low-risk group, and the others were attributed to the high-risk group. (D) The verification of the SNP model via the ROC curve and C-index in the TCGA test set. (E) The validation of the SNP model with Kaplan–Meier survival analysis in the TCGA test set. (F) The external validation of the SNP model with Kaplan–Meier survival analysis in the LICA-FR dataset. HCC hepatocellular carcinoma, TCGA The Genome Cancer Atlas; C-index, Harrell’s concordance index, ROC receiver operating characteristic, AUC area under the curve, SNP single nucleotide polymorphism.
Figure 6
Figure 6
Construction and validation of the multi-omics model. (A) Nomogram of the multi-omics model for predicting 1-, 3-, and 5-year OS in the TCGA training set. (B) Calibration plot for 1-, 3-, and 5-year OS of the multi-omics model in the TCGA training set. (C) The evaluation of the multi-omics model via the ROC curve and C-index in the TCGA training set. (D) Kaplan–Meier survival analysis of the different risk groups stratified with the trisection of the total point of the proposed nomogram in the TCGA training set. (E,F) Decision curve analysis for the multi-omics model and the five single-omic models at 1- and 3-year points in the TCGA training set. (G) Comparison of the predictive power of different models with C-index and ROC analysis in the TCGA training set. (H) The verification of the multi-omics model via the ROC curve and C-index in the TCGA test set. (I) The validation of the multi-omics model with Kaplan–Meier survival analysis in the TCGA test set. TCGA The Genome Cancer Atlas; C-index, Harrell’s concordance index, ROC receiver operating characteristic, AUC area under the curve, DCA decision curve analysis, OS overall survival, CNV copy number variation, SNP single nucleotide polymorphism.
Figure 7
Figure 7
Overall workflow. We used all HCCs in TCGA as a training set and 50% of HCCs as a test set. In the training set, we performed the limma analysis to identify DE-mRNAs, DE-lncRNAs, and DE-miRNAs. Chi-square analysis was used to screen abnormal CNV genes. The high-frequency SNPs (Top SNPs) in HCC were selected for further research. The univariate Cox regression analysis, LASSO Cox analysis, and backward stepwise Cox proportional hazard analysis were used to identify critical markers. We constructed five single-omic models (mRNA, lncRNA, miRNA, CNV, and SNP model) through LASSO Cox analysis or stepwise Cox. The multi-omics model was constructed based on the five single-omic models through multiple Cox regression analysis. These models were evaluated and verified in the training set and test set, respectively. Moreover, we externally validated the mRNA and SNP models in the LIRI-JP, GSE1898, and LICA-FR, respectively. HCC hepatocellular carcinoma, TCGA The Genome Cancer Atlas, LASSO Least absolute shrinkage and selection operator, OS overall survival, DE-mRNAs Differentially expressed mRNAs, DE-lncRNAs, differently expressed lncRNAs, DE-miRNAs differentially expressed miRNA, CNV copy number variation, SNP single nucleotide polymorphism.

Similar articles

Cited by

References

    1. Siegel RL, Miller KD, Jemal A. Cancer statistics, 2020. CA Cancer J. Clin. 2020;70:7–30. doi: 10.3322/caac.21590. - DOI - PubMed
    1. Bakiri L, et al. Liver carcinogenesis by FOS-dependent inflammation and cholesterol dysregulation. J. Exp. Med. 2017;214:1387–1409. doi: 10.1084/jem.20160935. - DOI - PMC - PubMed
    1. Chen CH, et al. Long-term trends and geographic variations in the survival of patients with hepatocellular carcinoma: Analysis of 11,312 patients in Taiwan. J. Gastroenterol. Hepatol. 2006;21:1561–1666. doi: 10.1111/j.1440-1746.2006.04425.x. - DOI - PubMed
    1. Kulik L, El-Serag HB. Epidemiology and management of hepatocellular carcinoma. Gastroenterology. 2019;156:477–491. doi: 10.1053/j.gastro.2018.08.065. - DOI - PMC - PubMed
    1. McGlynn KA, Petrick JL, El-Serag HB. Epidemiology of hepatocellular carcinoma. Hepatology (Baltimore) 2021;73(Suppl 1):4–13. doi: 10.1002/hep.31288. - DOI - PMC - PubMed

Publication types