. 2022 Jul 15;12(1):12146.
doi: 10.1038/s41598-022-16394-x.

Discovery of a novel class of benzimidazoles as highly effective agonists of bone morphogenetic protein (BMP) receptor signaling

Affiliations

Discovery of a novel class of benzimidazoles as highly effective agonists of bone morphogenetic protein (BMP) receptor signaling

Sheyda Najafi et al. Sci Rep. .

Abstract

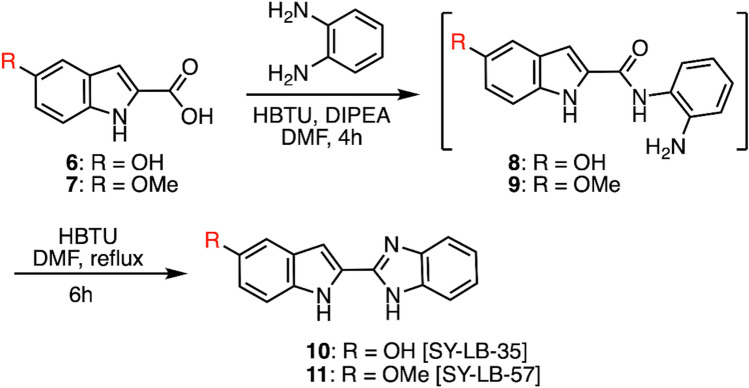
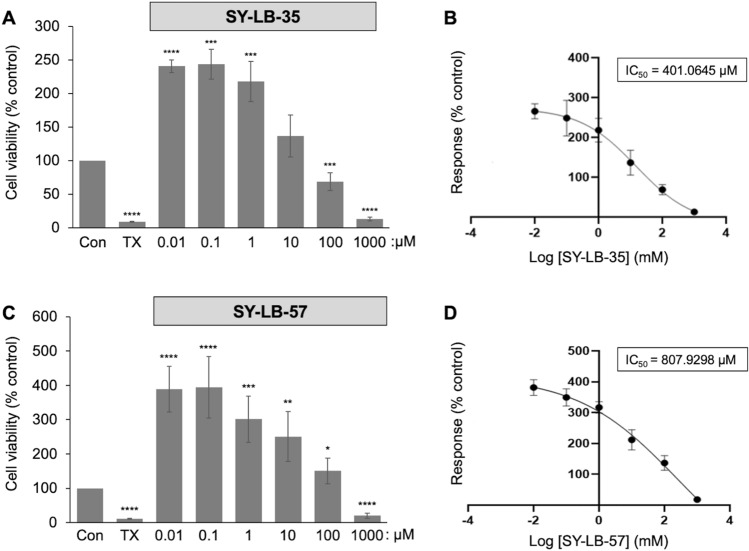
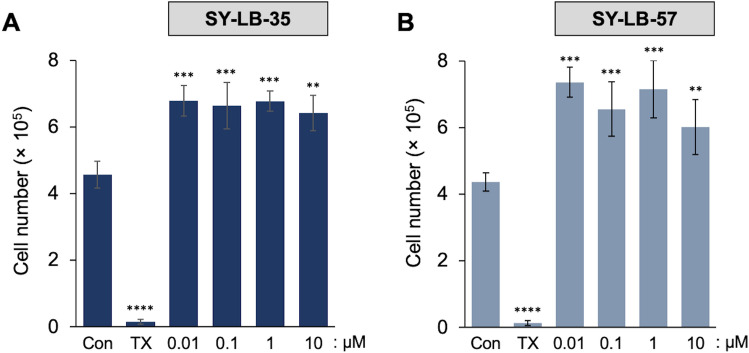
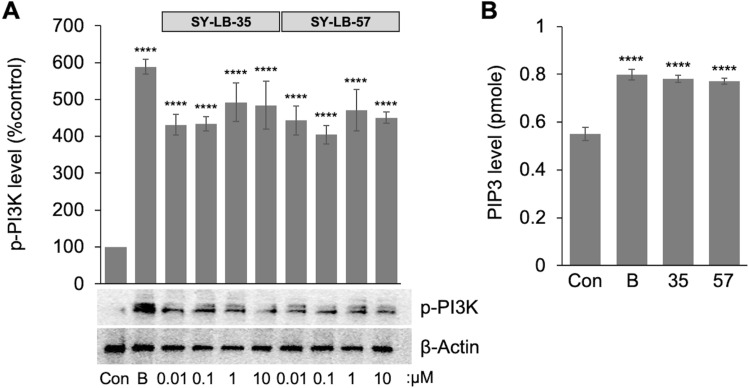
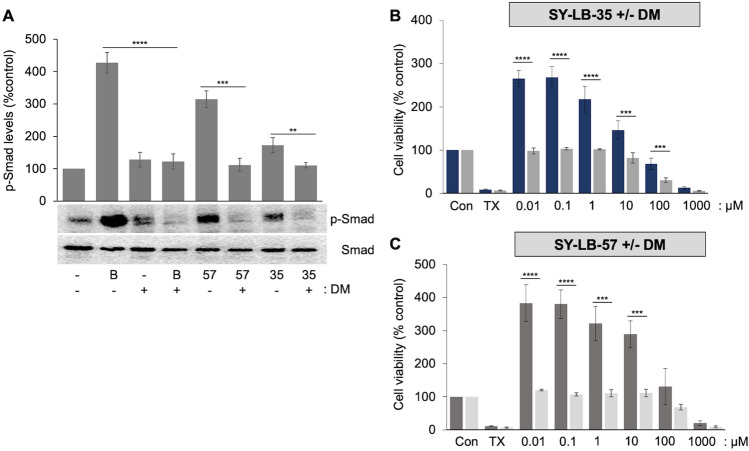
Increasing or restoring Bone Morphogenetic Protein receptor signaling is an effective therapy for conditions such as bone fracture and pulmonary arterial hypertension. However, direct use of recombinant BMPs has encountered significant obstacles. Moreover, synthetic, full agonists of BMP receptor signaling have yet to be identified. Here, we report the discovery of a novel class of indolyl-benzimidazoles, synthesized using a one-pot synthetic methodology, which appear to mimic the biochemical and functional activity of BMPs. The first-in-series compounds, SY-LB-35 and SY-LB-57, stimulated significant increases in cell number and cell viability in the C2C12 myoblast cell line. Cell cycle analysis revealed that these compounds induced a shift toward proliferative phases. SY-LB-35 and SY-LB-57 stimulated canonical Smad and non-canonical PI3K/Akt, ERK, p38 and JNK intracellular signaling pathways, similar to BMP2-stimulated responses. Importantly, increases in Smad phosphorylation and cell viability were dependent on type I BMP receptor activity. Thus, these compounds robustly activate intracellular signaling in a BMP receptor-dependent manner and may signify the first known, full agonists of BMP receptor signaling. Moreover, discovery of small molecule activators of BMP pathways, which can be efficiently formulated and targeted to diseased or damaged areas, could potentially substitute recombinant BMPs for treatment of BMP-related pathologies.


Conflict of interest statement

The authors declare no competing interests.

Figures

Figure 1
Figure 1
Reported small molecules that act as activators/partial agonists of BMP receptor-associated signaling. The figure illustrates the chemical structures of known BMP modulators. Images are modified from Feng et al. (compound 1), Vrijens et al. (compound 2) and Bradford et al. (compounds 3, 4 and 5). Compounds 1, 3, 4, and 5 are synthetic molecules, while compound 2 is a natural product,,.
Figure 2
Figure 2
Synthesis and structures of indolyl-benzimidazoles. The figure describes the synthetic scheme used to prepare the two indolyl-benzimidazoles. The carboxylic acid (compounds 6 and 7) was converted after 4 h to the amide (compounds 8 and 9) in the first step, and the amide was subsequently converted after 6 h into the benzimidazole (compounds 10 and 11) via a one-pot process.
Figure 3
Figure 3
Significant increases in C2C12 cell viability are stimulated by SY-LB-35 or SY-LB-57. C2C12 cells were serum-starved overnight and treated with the indicated concentrations of SY-LB-35 (A) or SY-LB-57 (C) for 24 h. Treatments with Triton X-100 (TX, 125 µM) was used as negative control for viability in the MT Glo assay. Cell viability is presented as a percent of luminescence detected in control, untreated cells. (A) Treatment of C2C12 cells with SY-LB-35 at 100 µM and 1 mM significantly reduced cell viability when compared to control cells (69%, ***p < 0.001 and 13%, ****p < 0.0005%; respectively). In contrast, at lower concentrations of 0.01 µM, 0.1 µM and 1 µM, the cell viability was significantly increased (241%, ****p < 0.0005; 244%, and 218%, ***p < 0.001, respectively). Cell viability measured at 10 µM SY-LB-35 was not different from control (137%). Data are expressed as mean ± SEM (n = 3) with each experiment performed in triplicate. (B) Non-linear regression analysis reveals an IC50 value of 401.0645 µM for SY-LB-35. (C) Treatment of C2C12 cells with SY-LB-57 at 1 mM reduced cell viability significantly (20%, ****p < 0.0005). Significant increases in cell viability were observed in response to all other concentrations tested (0.01 µM: 390%; 0.1 µM: 394%, ****p < 0.0005; 1 µM: 301%, ***p < 0.001; 10 µM: 251%, **p < 0.01; 100 µM: 151%, *p < 0.05). Data are expressed as mean ± SEM (n = 3) with each experiment performed in triplicate. (D) Non-linear regression analysis reveals an IC50 value of 807.9298 µM for SY-LB-57.
Figure 4
Figure 4
SY-LB-35 and SY-LB-57 increased cell concentration in C2C12 cells. Serum-starved C2C12 cells were treated with (A) SY-LB-35 and (B) SY-LB-57 (0.01–10 µM) for 24 h. Triton X-100 (TX) was used as negative control. C2C12 cells were collected after trypsinization, and the cell count was measured using Propidium iodide/Acridine orange. (A) Treatment with SY-LB-35 caused a significant increase in cell number compared with control, untreated cells (Con: 4.6 × 105 cells; 0.01 µM: 6.8 × 105 cells, 0.1 µM: 6.6 × 105 cells, 1 µM: 6.8 × 105 cells, ***p < 0.001; 10 µM: 6.4 × 105 cells, **p < 0.01). (B) Treatment with SY-LB-57 caused a significant increase in cell number compared with control, untreated cells (Con: 4.4 × 105 cells; 0.01 µM: 7.4 × 105 cells, 0.1 µM: 6.5 × 105 cells, 1 µM: 7.2 × 105 cells, ***p < 0.001; 10 µM: 6.0 × 105 cells, **p < 0.01). Data are expressed as mean ± SEM (n = 3) and each experiment was conducted in triplicate.
Figure 5
Figure 5
Smad phosphorylation and nuclear translocation in the presence of SY-LB-35 or SY-LB-57. (A) Serum-starved C2C12 cells were treated with increasing concentrations of SY-LB-35 or SY-LB-57 (0.01–10 µM) for 30 min. BMP2 (50 ng/mL) was used as a positive control. Western blot analysis using anti-p-Smad and anti-total Smad antibodies showed that SY-LB-35 and SY-LB-57 mimicked BMP2 by increasing Smad phosphorylation levels. Quantification of p-Smad levels compared to control confirms significant upregulation of p-Smad following 30-min stimulation with BMP2 (195%, ****p < 0.0005), SY-LB-35 (0.01 µM: 150%, 0.1 µM: 170%, *p < 0.05; 1 µM: 282%, ****p < 0.0005; 10 µM: 188%, **p < 0.01) and SY-LB-57 (0.01 µM: 234%, ***p < 0.001; 0.1 µM: 316%, 1 µM: 276%, 10 µM: 357%, ****p < 0.0005). Levels of p-Smad were normalized to total Smad levels and are expressed as a percent of control (mean ± SEM; n = 3). The original, uncropped blots are presented in Supplemental Fig. S4. (BE). Serum-starved C2C12 cells grown on PDL-coated glass coverslips were treated with BMP2 (50 ng/mL), 1 µM SY-LB-35 or 1 µM SY-LB-57 for 30 min. Unstimulated cells served as the negative control. The cultures were stimulated, fixed, and labelled with phospho-specific anti-Smad primary antibodies and Cy3-conjugated secondary antibodies (red). The coverslips were mounted in medium containing DAPI to label nuclei (blue). Control cells (B) have low levels of p-Smad labelling in the nucleus. Stimulation with BMP2 (C) resulted in a drastic increase in the level of phosphorylated Smad localized to the nucleus. Both SY-LB-35 (D) and SY-LB-57 (E) stimulated robust increases in p-Smad levels as well as nuclear translocation of phosphorylated Smads. The merged panels show diffuse p-Smad in the cytoplasm in control cells, whereas the stimulated cells illustrate the complete overlap of p-Smad labelling and the DAPI stain (n = 3; scale = 10 µm).
Figure 6
Figure 6
Phosphorylation and cytoplasmic distribution of p-Akt induced by SY-LB-35 and SY-LB-57. (A) Western Blot analysis using anti-p-Akt and anti-total Akt antibodies was performed on whole cell lysates of serum-starved C2C12 cells treated with 50 ng/mL BMP2 as a positive control, SY-LB-35 (0.01–10 µM) or SY-LB-57 (0.01–10 µM) for 15 min. Quantification of p-Akt levels with respect to control, untreated cells demonstrates that BMP2 (913%, ****p < 0.0005), SY-LB-35 (0.01 µM: 945%, 0.1 µM: 826%, 1 µM: 887%, 10 µM: 766%, ****p < 0.0005) and SY-LB-57 (0.01 µM: 827%, 0.1 µM: 1033%, 1 µM: 1181%, 10 µM: 995%, ****p < 0.0005) caused significant stimulation of Akt phosphorylation after 15 min in C2C12 cells. Levels of p-Akt were normalized to total Akt levels and are expressed as a percent of control (mean ± SEM; n = 3). The original, uncropped blots are presented in Supplemental Fig. S5. (BE). Serum-starved C2C12 cells grown on PDL-coated glass coverslips were treated with BMP2 (50 ng/mL) as positive control, and SY-LB-35 or SY-LB-57 (1 µM) for 15 min. Unstimulated cells were used as the negative control. The cultures were stimulated, fixed, and labelled with phospho-specific anti-Akt primary antibodies and Cy3-conjugated secondary antibodies (red). The coverslips were mounted in medium containing DAPI to label nuclei (blue). Control cells (B) have low levels of p-Akt labelling in the cytoplasm. Stimulation with BMP2 (C) resulted in a drastic increase in the level of phosphorylated Akt localized to the cytoplasm. SY-LB-35 (D) and SY-LB-57 (E) stimulated increases in p-Akt levels as well as cytoplasmic translocation of phosphorylated Akt after 15 min of treatment in C2C12 cells. The merged panels illustrate that the increase in p-Akt labelling does not completely overlap with the nuclear DAPI stain (n = 3; scale = 10 µm).
Figure 7
Figure 7
SY-LB-35 and SY-LB-57 stimulate the phosphorylation and activation of PI3K. (A) Western Blot analysis using anti-p-PI3K and anti-β-actin antibodies was performed on whole cell lysates of C2C12 cells treated with 50 ng/mL BMP2 as positive control, SY-LB-35 (0.01–10 µM) or SY-LB-57 (0.01–10 µM) for 15 min. Quantification of p-PI3K levels with respect to control, untreated C2C12 cells demonstrates that BMP2 (589%, ****p < 0.0005), SY-LB-35 (0.01 µM: 431%, 0.1 µM: 434%, 1 µM: 492%, 10 µM: 484%, ****p < 0.0005) and SY-LB-57 (0.01 µM: 443%, 0.1 µM: 404%, 1 µM: 471%, 10 µM: 451%, ****p < 0.0005) caused significant increases in p-PI3K levels after 15 min. Levels of p-PI3K were normalized to β-actin levels and are expressed as a percent of control (mean ± SEM; n = 3). The original, uncropped blots are presented in Supplemental Figure S6. (B) Serum-starved C2C12 cells were stimulated with SY-LB-35 and SY-LB-57 at 10 µM for 15 min. BMP2 (50 ng/mL) was used as a positive control. Whole cell lysates were prepared and PI3K was immunoprecipitated from the samples and PI3K activity was assessed using a PI3K ELISA. The amount of the product, PIP3, produced by PI3K enzyme was significantly higher in BMP2- (0.79 pmol), SY-LB-35- (0.77 pmol) and SY-LB-57-treated samples (0.77 pmol) compared to control (0.61 pmol; ****p ˂ 0.0005, n = 3). The optical density of all samples was measured at 450 nm and the enzyme activity was expressed as the amount of product (PIP3 level) generated in each sample by the PI3K per minute of reaction.
Figure 8
Figure 8
Activation of ERK, p38 and JNK phosphorylation by SY-LB-35 and SY-LB-57. (A) Western Blot analysis was performed on whole cell lysates of serum-starved C2C12 cells stimulated by SY-LB-35 or SY-LB-57 (0.01–10 µM) for 15 min. BMP2 (50 ng/mL) served as the positive control. Blots were probed with antibodies against p-ERK, ERK, p-p38, p38, p-JNK and JNK. SY-LB-35 and SY-LB-57 stimulated increases in phosphorylation of all three intracellular signaling targets at all concentrations tested (n = 3). The original, uncropped blots are presented in Supplemental Fig. S8 (ERK blots), S9 (p38 blots) and S10 (JNK blots).
Figure 9
Figure 9
Shifts to S and G2/M phases of the cell cycle induced by SY-LB-35 and SY-LB-57. Serum-starved C2C12 cells were treated with SY-LB-35 (top row) and SY-LB-57 (bottom row) for 24 h. An equal number of cells (~ 106 cells per treatment) was collected for flow cytometry analysis. Quantitative analysis of the distribution or proportion of cells in each phase was carried out with at least 20,000 cells per sample. Cell cycle analysis demonstrated that SY-LB-35 and SY-LB-57 (0.01–10 µM) caused significant shifts in the phases of the cell cycle from G0/G1 phases (A) to S (B) and G2/M (C) phases compared with control, untreated C2C12 cells. SY-LB-35: Con (G0/G1: 88%, S: 6%, G2/M: 8%); 0.01 µM (G0/G1: 76%, S: 11%, G2/M: 13%); 0.1 µM (G0/G1: 76%, S: 12%, G2/M: 12%); 1 µM (G0/G1: 77%, S: 12%, G2/M: 11%); 10 µM (G0/G1: 76%, S: 12%, G2/M: 11%); SY-LB-57: Con (G0/G1: 87%, S: 6%, G2/M: 6%); 0.01 µM (G0/G1: 76%, S: 13%, G2/M: 13%); 0.1 µM (G0/G1: 76%, S: 14%, G2/M: 11%); 1 µM (G0/G1: 77%, S: 12%, G2/M: 11%); 10 µM (G0/G1: 79%, S: 13%, G2/M: 10%). Each bar represents mean ± SEM (n = 3) with each experiment carried out in triplicate (****p < 0.0005; ***p < 0.001; **p < 0.01; *p < 0.05).
Figure 10
Figure 10
Increases in p-Smad by SY-LB-35 and SY-LB-57 is mediated by type I BMP receptor activity. (A) Western blot analysis using anti-p-Smad and anti-total Smad antibodies of serum-starved C2C12 whole cell lysates stimulated with BMP2 (50 ng/mL) as a positive control and 1 µM SY-LB-35 or SY-LB-57 in presence or absence of an inhibitor of type I BMP receptor activity, Dorsomorphin (DM; 10 µM), for 30 min. Pretreatment of C2C12 cells with DM for 1 h inhibited increases in Smad phosphorylation stimulated by BMP2 (DM(−) 428% versus DM(+) 122%, ****p < 0.0005), SY-LB-35 (DM(−) 315% versus DM(+) 112%, ***p < 0.001) and SY-LB-57 (DM(−) 172% versus DM(+) 111%, **p < 0.01). The level of p-Smad was normalized to Smad levels. Data are expressed as mean ± SEM (n = 3). The original, uncropped blots are presented in Supplemental Fig. S11. (B,C). C2C12 cells were seeded in a 96-well plate, starved for 16 h, and stimulated with SY-LB-35 (B) or SY-LB-57 (C) (0.01–1000 µM) in presence or absence of DM (10 µM) for 24 h. Triton X-100 (125 µM) was used as negative control. DM blocked all increases in cell viability induced by SY-LB-35 (0.01 µM: DM(−) 266% versus DM(+) 98%; 0.1 µM: DM(−) 269% versus DM(+) 103%; 1 µM: DM(−) 218% versus DM(+) 102%, ****p < 0.0005; 10 µM: DM(−) 147% versus DM(+) 82%; 100 µM: DM(−) 69% versus DM(+) 30%, ***p < 0.001) and SY-LB-57 (0.01 µM: DM(−) 384% versus DM(+) 120%; 0.1 µM: DM(−) 380% versus DM(+) 107%, ****p < 0.0005; 1 µM: DM(−) 321% versus DM(+) 111%; 10 µM: DM(−) 289% versus DM(+) 111%, ***p < 0.001). The data are expressed as mean ± SEM with each experiment conducted in triplicate (n = 3).

Similar articles

Cited by

References

    1. Urist M. R. Bone: Formation by autoinduction. Science. 1965;150(3698):893–899. doi: 10.1126/science.150.3698.893. - DOI - PubMed
    1. Wang RN, et al. Bone morphogenetic protein (BMP) signaling in development and human diseases. Genes Dis. 2014;1(1):87–105. doi: 10.1016/j.gendis.2014.07.005. - DOI - PMC - PubMed
    1. Wagner DO, et al. BMPs: From bone to body morphogenetic proteins. Sci. Signal. 2010 doi: 10.1126/scisignal.3107mr1. - DOI - PubMed
    1. Liu A, Niswander LA. Bone morphogenetic protein signalling and vertebrate nervous system development. Nat. Rev. Neurosci. 2005;6(12):945–954. doi: 10.1038/nrn1805. - DOI - PubMed
    1. Spiekerkoetter E, et al. FK506 activates BMPR2, rescues endothelial dysfunction, and reverses pulmonary hypertension. J. Clin. Investig. 2013;123(8):3600–3613. doi: 10.1172/JCI65592. - DOI - PMC - PubMed

Publication types

MeSH terms