. 2022 May;15(5):952-963.
doi: 10.1038/s41385-022-00545-4. Epub 2022 Jul 15.

Distinct airway epithelial immune responses after infection with SARS-CoV-2 compared to H1N1

Collaborators, Affiliations

Distinct airway epithelial immune responses after infection with SARS-CoV-2 compared to H1N1

Helen Stölting et al. Mucosal Immunol. 2022 May.

Abstract

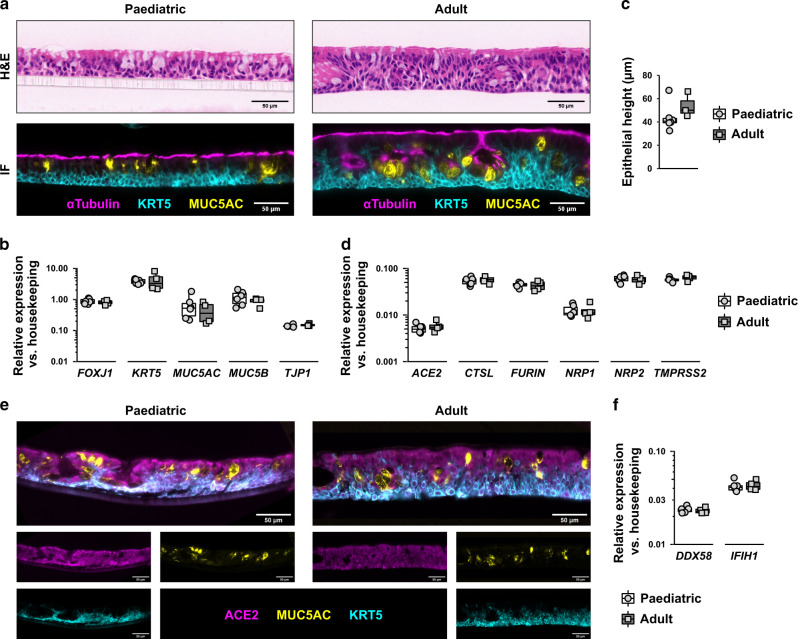
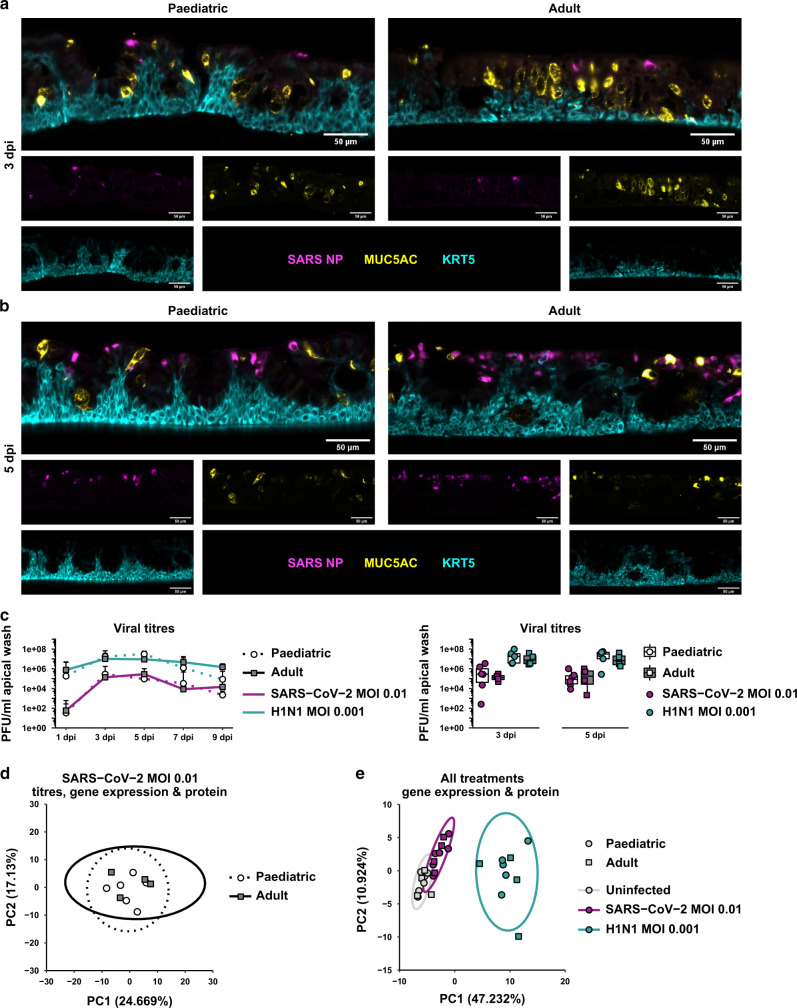
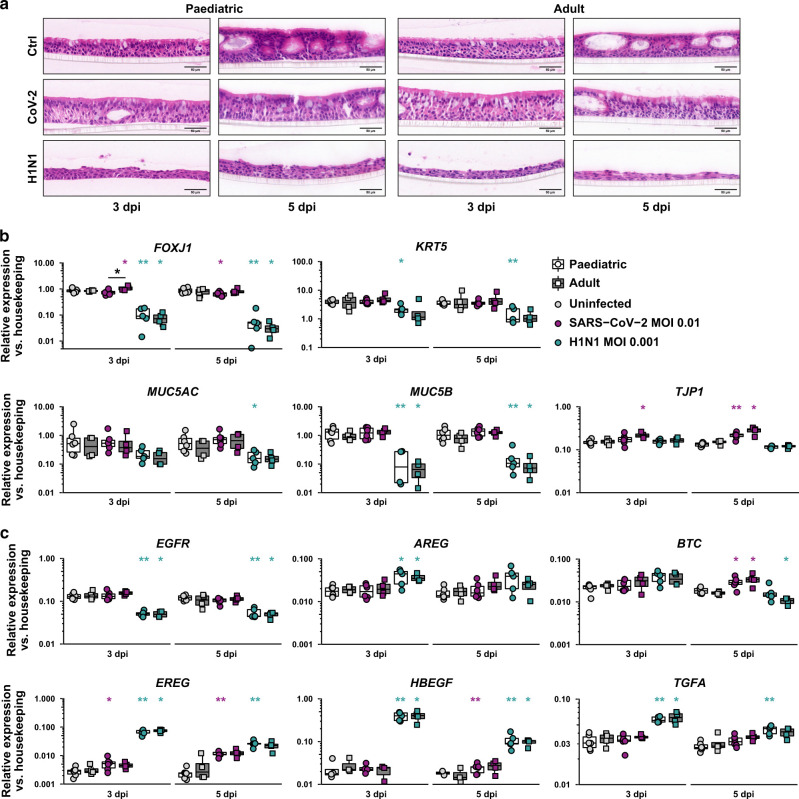
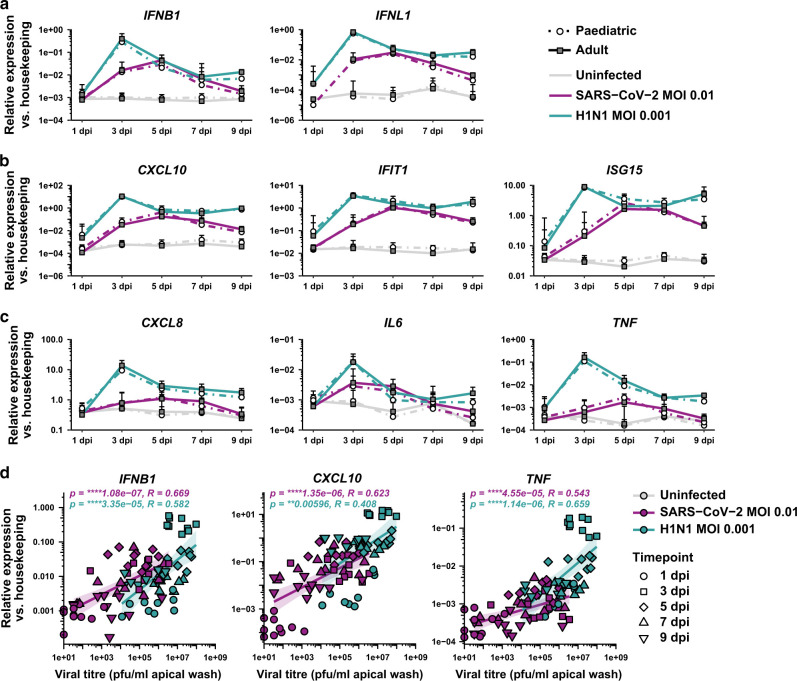
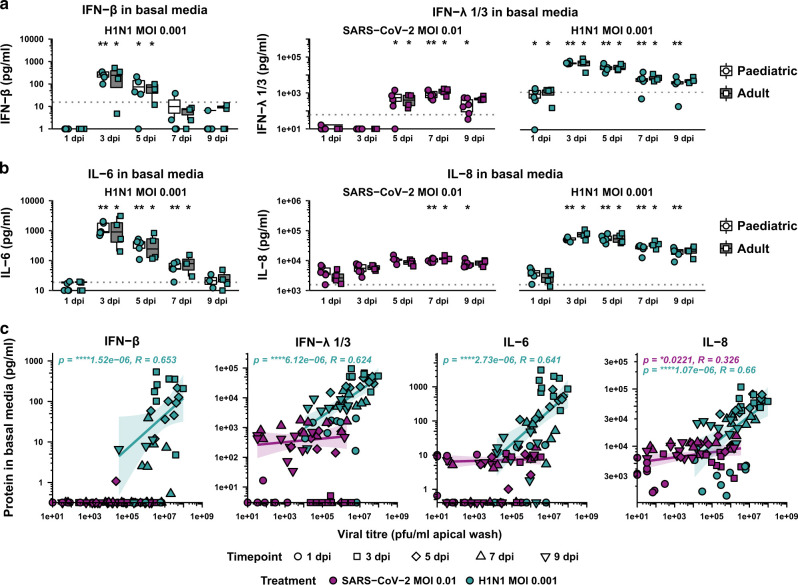
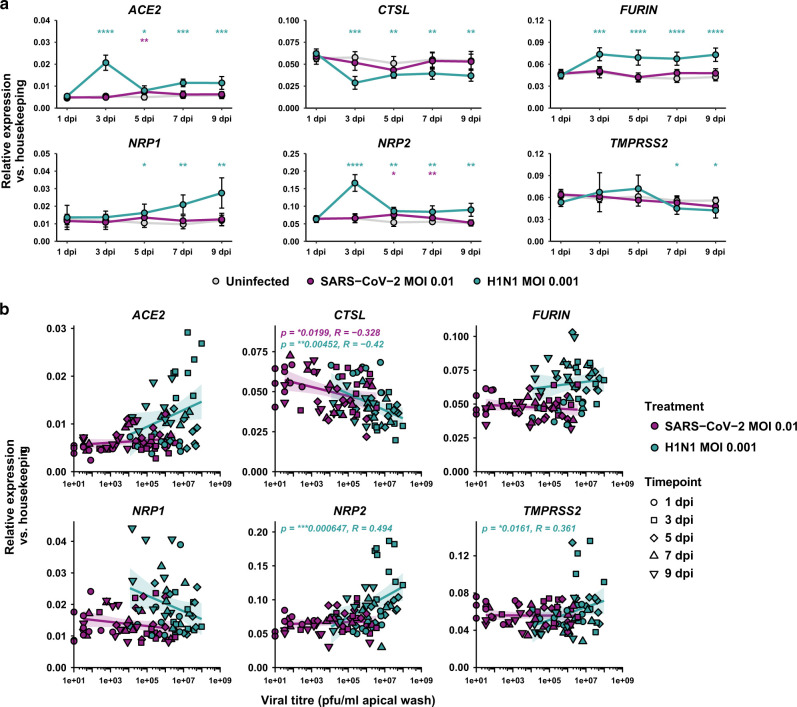
Children are less likely than adults to suffer severe symptoms when infected with severe acute respiratory syndrome coronavirus 2 (SARS-CoV-2), while influenza A H1N1 severity is comparable across ages except for the very young or elderly. Airway epithelial cells play a vital role in the early defence against viruses via their barrier and immune functions. We investigated viral replication and immune responses in SARS-CoV-2-infected bronchial epithelial cells from healthy paediatric (n = 6; 2.5-5.6 years old) and adult (n = 4; 47-63 years old) subjects and compared cellular responses following infection with SARS-CoV-2 or Influenza A H1N1. While infection with either virus triggered robust transcriptional interferon responses, including induction of type I (IFNB1) and type III (IFNL1) interferons, markedly lower levels of interferons and inflammatory proteins (IL-6, IL-8) were released following SARS-CoV-2 compared to H1N1 infection. Only H1N1 infection caused disruption of the epithelial layer. Interestingly, H1N1 infection resulted in sustained upregulation of SARS-CoV-2 entry factors FURIN and NRP1. We did not find any differences in the epithelial response to SARS-CoV-2 infection between paediatric and adult cells. Overall, SARS-CoV-2 had diminished potential to replicate, affect morphology and evoke immune responses in bronchial epithelial cells compared to H1N1.


Conflict of interest statement

C.M.L. and B.M. (of the Breathing Together consortium) are members of the editorial board for Mucosal Immunology. All other authors declare no conflict of interest.

Figures

Fig. 1
Fig. 1
Bronchial epithelial cells from paediatric and adult donors displayed comparable cellular composition and SARS-CoV-2 entry factor expression. a Representative images of H&E or immunofluorescence staining of uninfected bronchial epithelial cells from paediatric and adult donors. Immunofluorescence: Ciliated cells (acetylated alpha tubulin; magenta), basal cells (KRT5; cyan) and goblet cells (MUC5AC; yellow). Length of scale bar: 50 µm. b Gene expression analysis by qPCR from uninfected bronchial epithelial cells. c Epithelial height measured in cross-section of fixed bronchial epithelial cells from paediatric or adult donors. d Gene expression analysis by qPCR from uninfected bronchial epithelial cells. e Representative images of staining for KRT5 (cyan), ACE2 (magenta) and MUC5AC (yellow) in uninfected bronchial cells from paediatric and adult donors. Size of scale bar: 50 µm. f Gene expression analysis by qPCR from uninfected bronchial epithelial cells.
Fig. 2
Fig. 2
Age did not distinguish epithelial susceptibility and immune responses to SARS-CoV-2, which were minimal compared to H1N1. a, b Representative images of immunofluorescence staining for SARS-CoV-2 nucleocapsid protein (NP) (magenta), MUC5AC (yellow) and KRT5 (cyan) in SARS-CoV-2-infected cells at 3 (A) or 5 (B) days post-infection (dpi). Size of scale bar: 50 µm. c Viral titres in apical wash of epithelial cells infected with SARS-CoV-2 or H1N1 as determined by plaque assays. Line graph in (A) shows median + confidence interval. d Principal component analysis of SARS-CoV-2-infected cells based on 121 variables (viral titres, expression of 28 genes and concentration of 2 proteins across up to five time points). Each data point represents one donor. e Principal component analysis of epithelial cells based on 98 variables (expression of 28 genes and concentration of 2 proteins across up to five time points). Each data point represents one treatment of one donor.
Fig. 3
Fig. 3
Infection of epithelial cells with SARS-CoV-2 did not alter gross cellular morphology. a Representative images of H&E staining of paediatric or adult bronchial epithelial cells infected with SARS-CoV-2 (CoV-2), H1N1 or treated with medium (ctrl) at 3 and 5 days post-infection (dpi). b, c Gene expression analysis by qPCR of infected bronchial epithelial cells. Coloured asterisks indicate statistically significant changes from uninfected conditions. Black bar and asterisk indicate statistically significant differences between paediatric and adult cells. Statistics: Mann–Whitney test. *p < 0.05; **p < 0.01.
Fig. 4
Fig. 4
Infection with SARS-CoV-2 elicited antiviral and pro-inflammatory transcriptional programmes, which were significantly weaker than with H1N1 infection. ac Gene expression analysis by qPCR of infected bronchial epithelial cells. Data are shown as median + confidence interval. d Spearman correlation between viral titres and gene expression of IFNB1 or TNF of paediatric and adult cells infected with SARS-CoV-2 or H1N1. Correlation coefficients and p values are shown for each treatment individually (purple, SARS-CoV-2; teal, H1N1).
Fig. 5
Fig. 5
Protein production by epithelial cells in response to SARS-CoV-2 infection was minimal compared to H1N1. a, b Concentrations of indicated proteins in the basal media from epithelial cells infected with SARS-CoV-2 or H1N1. Dotted lines denote lower limit of detection. Asterisks denote statistically significant change from uninfected controls. Statistics: Mann–Whitney test. *p < 0.05; **p < 0.01. c Spearman correlation between viral titres and protein concentrations in basal media of cells paediatric and adult cells infected with SARS-CoV-2 or H1N1. Correlation coefficients and p values are shown for each treatment individually (purple, SARS-CoV-2; teal, H1N1).
Fig. 6
Fig. 6
Infection of bronchial epithelial cells with H1N1 resulted in prolonged upregulation of SARS-CoV-2 entry-related genes independent of viral titres. a Gene expression analysis by qPCR of infected bronchial epithelial cells. Data shown as median ± confidence interval of paediatric (n = 5–6) and adult (n = 4) donors pooled together. Asterisks denote statistically significant change from uninfected control. Statistics: Mann–Whitney test. *p < 0.05; **p < 0.01; ***p < 0.001; ****p < 0.0001. b Spearman correlation between viral titres and gene expression of indicated genes in cells infected with SARS-CoV-2 or H1N1. Correlation coefficients and p values are shown for each treatment individually (purple, SARS-CoV-2; teal, H1N1).

Similar articles

Cited by

References

    1. Jhung MA, et al. Epidemiology of 2009 pandemic influenza A (H1N1) in the United States. Clin. Infect. Dis. 2011;52:S13–S26. doi: 10.1093/cid/ciq008. 21342884. - DOI - PubMed
    1. Li J, et al. Epidemiology of COVID-19: a systematic review and meta-analysis of clinical characteristics, risk factors, and outcomes. J. Med Virol. 2021;93:1449–1458. doi: 10.1002/jmv.26424. 1:CAS:528:DC%2BB3cXhs1Gqu7fL. 32790106. - DOI - PMC - PubMed
    1. Wu Z, McGoogan JM. Characteristics of and important lessons from the coronavirus disease 2019 (COVID-19) outbreak in China: summary of a report of 72314 cases from the Chinese Center for Disease Control and Prevention. JAMA. 2020;323:1239–1242. doi: 10.1001/jama.2020.2648. 1:CAS:528:DC%2BB3cXnsFCqsrs%3D. 32091533. - DOI - PubMed
    1. O'Driscoll M, et al. Age-specific mortality and immunity patterns of SARS-CoV-2. Nature. 2021;590:140–145. doi: 10.1038/s41586-020-2918-0. 1:CAS:528:DC%2BB3cXisFCgtLvI. 33137809. - DOI - PubMed
    1. Lu X, et al. SARS-CoV-2 infection in children. N. Engl. J. Med. 2020;382:1663–1665. doi: 10.1056/NEJMc2005073. 32187458. - DOI - PMC - PubMed

Publication types