Review
. 2023 Jan;24(1):21-43.
doi: 10.1038/s41576-022-00509-1. Epub 2022 Jul 15.

Characterizing cis-regulatory elements using single-cell epigenomics

Affiliations
Review

Characterizing cis-regulatory elements using single-cell epigenomics

Sebastian Preissl et al. Nat Rev Genet. 2023 Jan.

Abstract

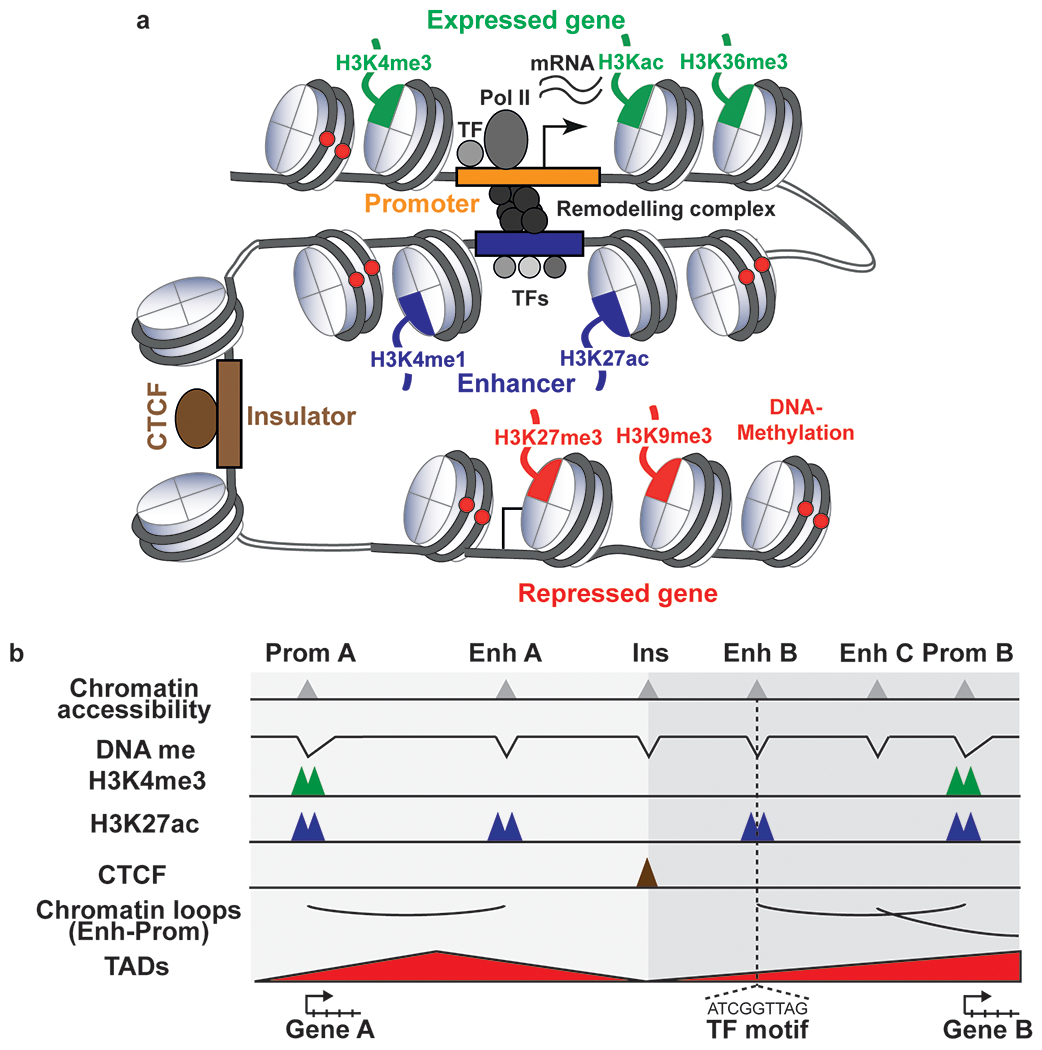
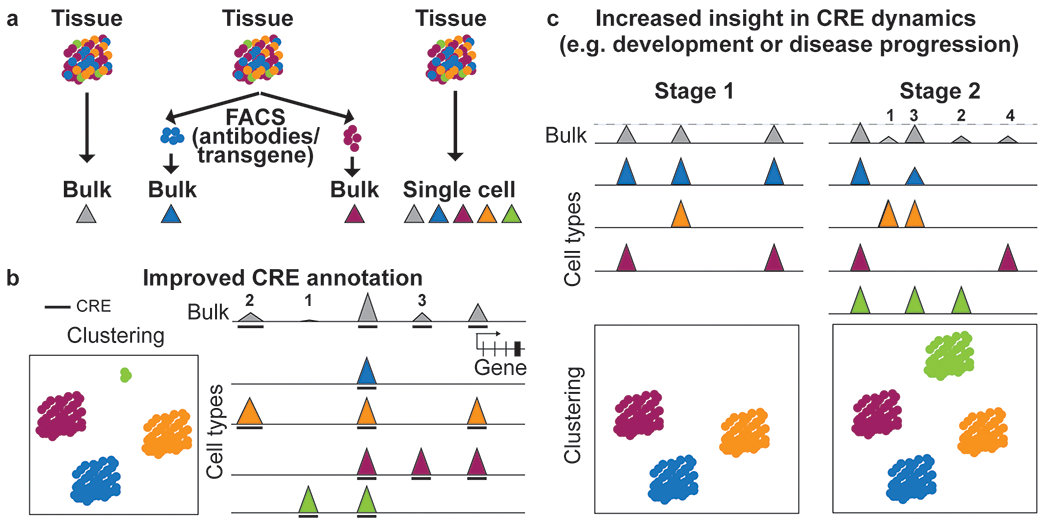
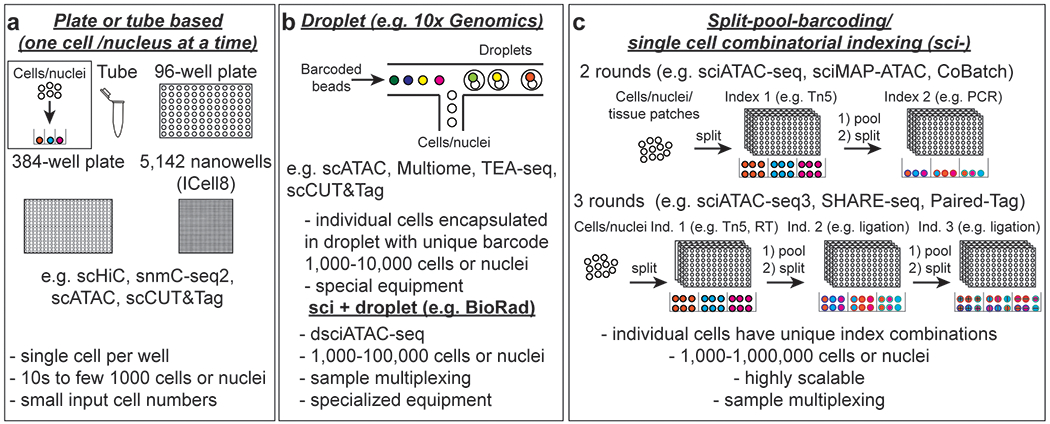
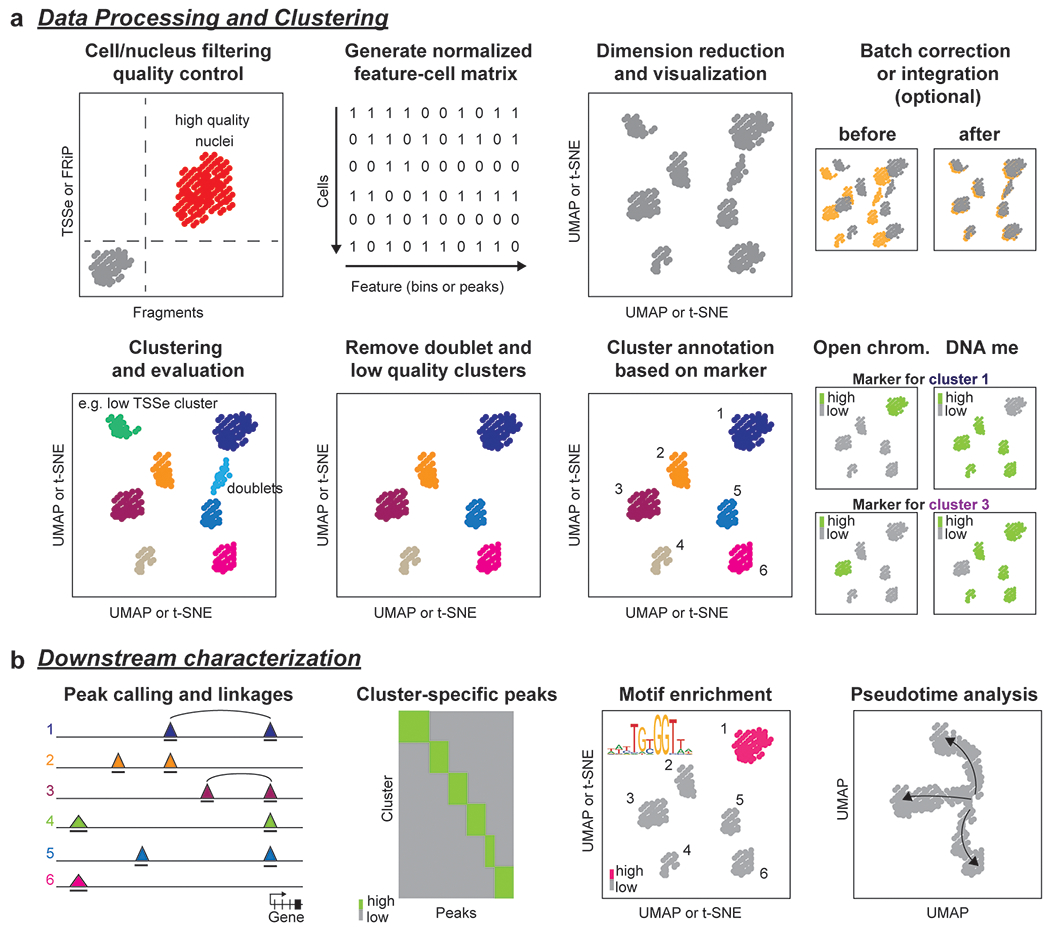
Cell type-specific gene expression patterns and dynamics during development or in disease are controlled by cis-regulatory elements (CREs), such as promoters and enhancers. Distinct classes of CREs can be characterized by their epigenomic features, including DNA methylation, chromatin accessibility, combinations of histone modifications and conformation of local chromatin. Tremendous progress has been made in cataloguing CREs in the human genome using bulk transcriptomic and epigenomic methods. However, single-cell epigenomic and multi-omic technologies have the potential to provide deeper insight into cell type-specific gene regulatory programmes as well as into how they change during development, in response to environmental cues and through disease pathogenesis. Here, we highlight recent advances in single-cell epigenomic methods and analytical tools and discuss their readiness for human tissue profiling.


Conflict of interest statement

Competing interests

B.R. is a shareholder and consultant of Arima Genomics, Inc., and a co-founder of Epigenome Technologies, Inc. K.J.G. is a consultant of Genentech and a shareholder in Vertex Pharmaceuticals and Neurocrine Biosciences. These relationships have been disclosed to and approved by the UCSD Independent Review Committee.

Figures

Figure 1:
Figure 1:. Epigenomic marks at cis regulatory elements and their association with gene expression.
a Activity of cis-regulatory elements (CREs) and gene regions can be identified using distinct chromatin modifications. Promoters of expressed genes show high levels of chromatin accessibility, low DNA methylation levels and high levels of histone H3 trimethylated at lysine 4 (H3K4me3) and acetylated at other lysine residues, such as H3K27ac. The histone modification H3K36me3 is found at gene bodies of expressed genes. Gene expression can be modulated by enhancers, distal cis-regulatory elements that can be brought in close proximity to the promoter of target genes through the folding of chromatin. Active enhancers are characterized by high chromatin accessibility, low DNA methylation levels and high H3K4me1 and H3K27ac levels. Transcription factors bind to enhancers and promoters, and recruit chromatin remodelers and transcription machinery to regulate gene expression. Repressed genes or heterochromatic regions show high levels of DNA methylation and histone marks such as H3K9me3 and H3K27me3. Insulators, characterized by open chromatin and binding of CTCF, can prevent enhancer-dependent gene activation when placed between the promoter and enhancer or the spread of heterochromatin to euchromatin. Pol II: RNA Polymerase II, TF: Transcription factor. b Schematic representation of epigenetic features associated with different classes of CREs viewed on a genome browser. CREs are characterized by accessible chromatin and low DNA methylation levels. Active promoters (Genes 1,4) have a strong signal for H3K4me3 and H3K27ac and active enhancers have a strong signal for H3K4me1 and H3K27ac. Poised promoters have a strong signal for H3K4me3 (Gene 3) and inactive promoters are devoid of H3K4me3 (Gene 2). Poised or primed enhancers are marked by H3K4me1. Enhancer and promoter contacts are constrained by TADs, which are separated by boundaries bound by CTCF. The DNA sequence in the peak region of the chromatin accessibility track or the valley of the DNA methylation track can be used to infer binding motifs of transcription factors. Enhancers do not always act on the closest genes (Genes 2 and 3) and are brought into proximity of their target genes by chromatin loops, which can increase gene expression (Gene 4). DNA me: DNA methylation, Enh: Enhancer, Prom: Promoter, Ins: Insulator, TAD: Topologically associated domain, TF: Transcription factor
Figure 2:
Figure 2:. Single-cell epigenomic profiling enables insight into cell-type-specific CRE annotation and activity.
a Schematic of different ways to profile epigenomes from tissue samples. Traditionally, bulk assays are used that result in one average dataset for the tissue (left). Cell types with established surface or intracellular markers that can be identified using antibodies, transgenic expression or lineage tracers can be sorted prior to epigenomic profiling to enable insight into distinct cell types. Cell types without known epitope or validated antibody and unknown cell types could be missed or under-represented in this approach (middle). Single-cell profiling captures known and unknown cell types. By combining reads from individual cells, it also provides a pseudobulk dataset for each cell type (right). b Single-cell epigenomic datasets can be used to group cells with similar profiles into clusters corresponding to cell types or cell states and to infer tissue composition (left). Single-cell epigenomic profiles can be used to deconvolute activities of CREs (1-4 and 6) in each cell type making up the heterogeneous sample and enable annotation of an additional CRE (5) only active in the rare cell type (green) that was not detected in the bulk dataset. Lower signal strength in bulk as compared to the maximum signal (CRE 1) can be due to full activity in only one cell type (CRE 2,4,6) or lower activity of the CRE in several cell types (CRE 3). Activity of distal and proximal CREs can also be used to predict putative enhancer-promoter pairs (CRE 2 and 6). Height of peaks indicates signal strength. Arc indicates linkage between enhancer and promoter. The bold line beneath the tracks indicates peak calls. c Cell type resolution is critical to studying dynamic activities of CREs in development and disease. Clustering analysis shows that a tissue at Stage B contains an additional cell type compared to Stage A and two of the cell types transitioned to a new state (indicated by arrows) (top). Multiple different scenarios could explain the changes seen in the bulk profile. An increase in signal between stages can result from an increase in the activity of a single CRE (Scenario 1); from activation of a CRE in a cell type already present in Stage B (Scenario 2); from activity of a CRE in the Stage B-specific cell type (Scenario 3); or a combination of these mechanisms (Scenario 4). A CRE with lower signal strength in bulk data can be caused by changes solely in the cellular composition, for example if a CRE is not active in the stage B specific cell type which leads to a lower fraction of cell types in which the CRE is active (Scenario 5, see ‘cluster proportion’ graph on the top right). A CRE with unaltered signal strength can result from changes in multiple cell types that compensate each other (Scenario 6). Height of peaks indicates signal strength.
Figure 3:
Figure 3:. Overview of technologies for barcoding single cells
a In plate, tube, microfluidicsor nanowell chip-based assays, single cells are dispensed into individual wells or tubes or captured in reaction chambers where library preparation and molecular barcoding are carried out. These approaches usually have low throughput but can yield high coverage libraries. Plate and tube-based assays are well suited for rare cell types or assays that require high coverage such as DNA methylation and single-cell Hi-C. Throughput for plate-based assays can be increased using liquid handling robotics. IFC: Integrated fluidic circuit b Droplet-based assays allow ten thousand cells or nuclei to be profiled in parallel (left). An initial sample indexing step allows sample multiplexing prior to loading. If samples are indexed at the fragment level, channels can be superloaded to enable profiling of large numbers of cells for one sample or multiplexing of many samples. If a droplet contains more than one nucleus, sequencing reads can be assigned to individual samples or sublibraries with the initial sample index sequence.(right). Both sample and cell barcodes are used to assign reads to specific cells or nuclei. c Single-cell combinatorial indexing (sci-) or split-pool barcoding assays provide very high scalability and enables sample multiplexing by introducing a sample barcode in the first indexing round. After each indexing step nuclei are pooled and distributed to another set of plates for a total of 2 or more rounds. The cell barcode is composed of the combination of indexes from each round. With automation this approach delivers high data quality and reproducibility. RT: reverse transcription.
Figure 4:
Figure 4:. General workflow for analysis of single-cell epigenomics datasets
a After preprocessing and mapping, high quality nuclei or cells are detected using quality control criteria such as transcriptional start site enrichment (TSSe) for scATAC-seq, fraction of reads in peaks (FRiP) or the number of fragments/reads per nucleus. Next, a normalized cell-feature matrix is generated followed by dimension reduction and visualization in 2D space. Datasets from different modalities can be integrated to increase cell-type resolution and, if processing datasets from multiple experimental batches, batch correction might be necessary. b The nuclei are first grouped into clusters, then cell clusters with low quality or representing likely doublets are removed from downstream analysis. High quality clusters are annotated using, for example, high chromatin accessibility or low DNA methylation levels at marker gene loci. c Downstream analysis is exemplified for chromatin accessibility datasets. Reads from all nuclei from a cluster are combined to a cell-type-specific pseudobulk dataset to call peaks (triangles indicate signal pile-up and bold lines underneath tracks indicate peak regions) from scATAC-seq. Distal elements can be linked to target genes by assessing if two sites are accessible in the same cell (co-accessible sites are indicated by black arcs). If datasets were integrated with scRNA-seq data or data were generated using joint profiling of RNA and chromatin accessibility, accessibility of distal elements can be associated to putative target gene expression levels. To further characterize gene regulatory networks, cCREs are identified as peaks in each cell cluster followed by analysis of transcription factor motifs or footprints within the cCREs. Single-cell epigenomics data can also be used to generate pseudotime trajectories for analysis of developmental or cell state transitions. Here, computational integration or joint profiling of RNA and chromatin from the same cell can provide insight into the crosstalk and differences in timing between chromatin dynamics and gene expression changes.

References

    1. Lee TI & Young RA Transcriptional regulation and its misregulation in disease. Cell 152, 1237–1251, doi: 10.1016/j.cell.2013.02.014 (2013). - DOI - PMC - PubMed
    1. Levine M, Cattoglio C & Tjian R Looping back to leap forward: transcription enters a new era. Cell 157, 13–25, doi: 10.1016/j.cell.2014.02.009 (2014). - DOI - PMC - PubMed
    1. Oudelaar AM & Higgs DR The relationship between genome structure and function. Nat Rev Genet 22, 154–168, doi: 10.1038/s41576-020-00303-x (2021). - DOI - PubMed
    1. Consortium EP et al. Expanded encyclopaedias of DNA elements in the human and mouse genomes. Nature 583, 699–710, doi: 10.1038/s41586-020-2493-4 (2020). - DOI - PMC - PubMed
    1. Cramer P Organization and regulation of gene transcription. Nature 573, 45–54, doi: 10.1038/s41586-019-1517-4 (2019). - DOI - PubMed

Publication types