

Construction of a novel necroptosis-related lncRNA signature for prognosis prediction in esophageal cancer
- PMID: 35840890
- PMCID: PMC9287891
- DOI: 10.1186/s12876-022-02421-8
Construction of a novel necroptosis-related lncRNA signature for prognosis prediction in esophageal cancer
Abstract
Background: Esophageal cancer (EC), one highly malignant gastrointestinal cancer, is the 6th leading cause of cancer-related deaths worldwide. Necroptosis and long non-coding RNA (lncRNA) play important roles in the occurrence and development of EC, but the research on the role of necroptosis-related lncRNA in EC is not conclusive. This study aims to use bioinformatics to investigate the prognostic value of necroptosis-related lncRNA in EC.
Methods: Transcriptome data containing EC and normal samples, and clinical information were obtained from the Cancer Genome Atlas database. 102 necroptosis-related genes were obtained from Kanehisa Laboratories. Necroptosis-related lncRNAs were screened out via univariate, multivariate Cox and the least absolute shrinkage and selection operator regression analyses to construct the risk predictive model. The reliability of the risk model was evaluated mainly through quantitative real-time PCR (qRT-PCR), the receiver operating characteristic (ROC) curves and the constructed nomogram. KEGG pathways were explored in the high- and low-risk groups of EC patients via gene set enrichment analyses (GSEA) software. Immune microenvironment and potential therapeutic agents in risk groups were also analyzed.
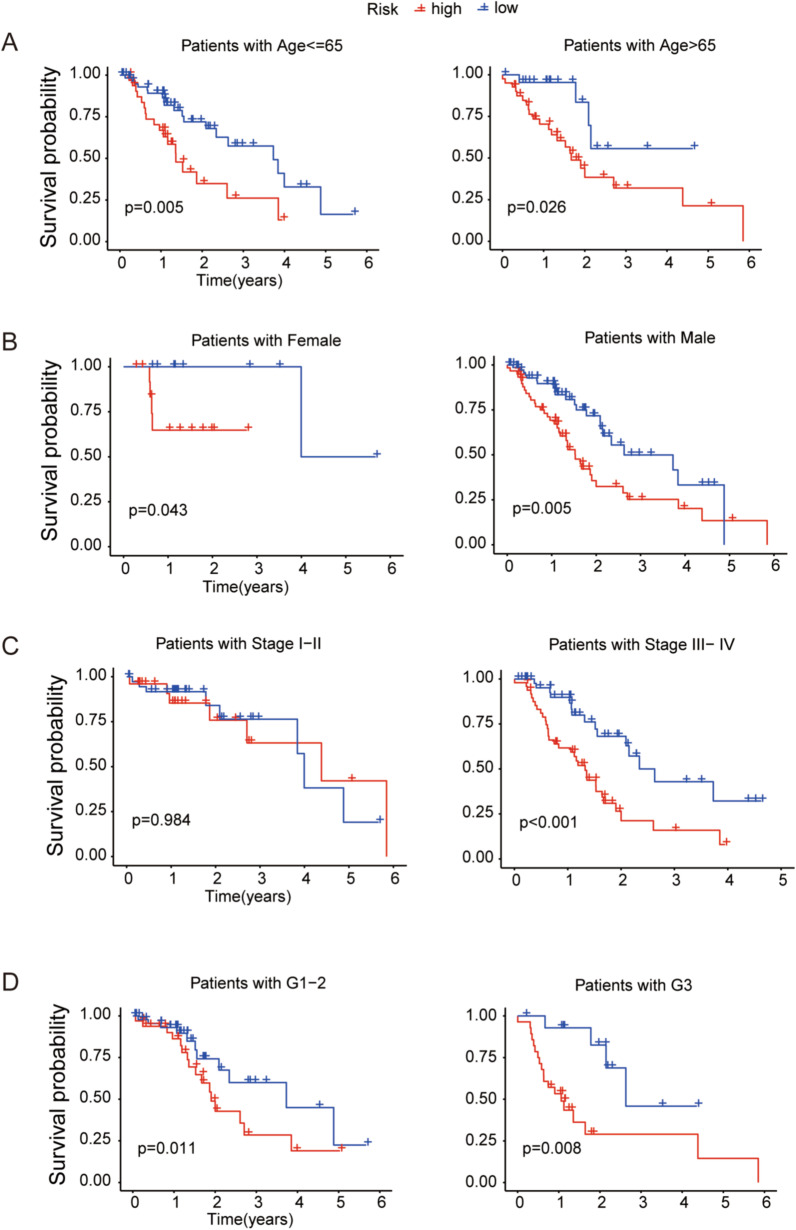
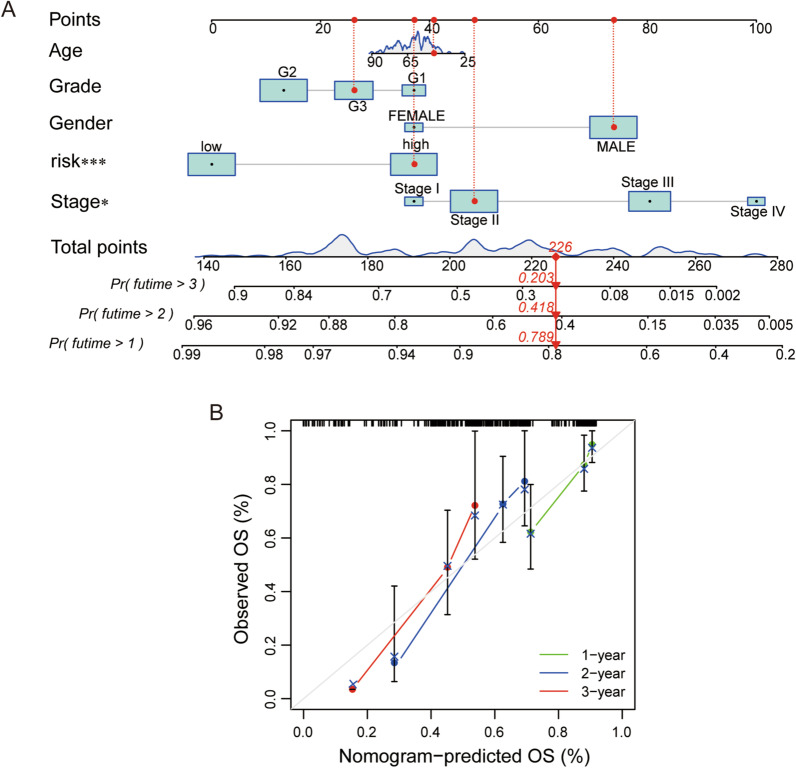
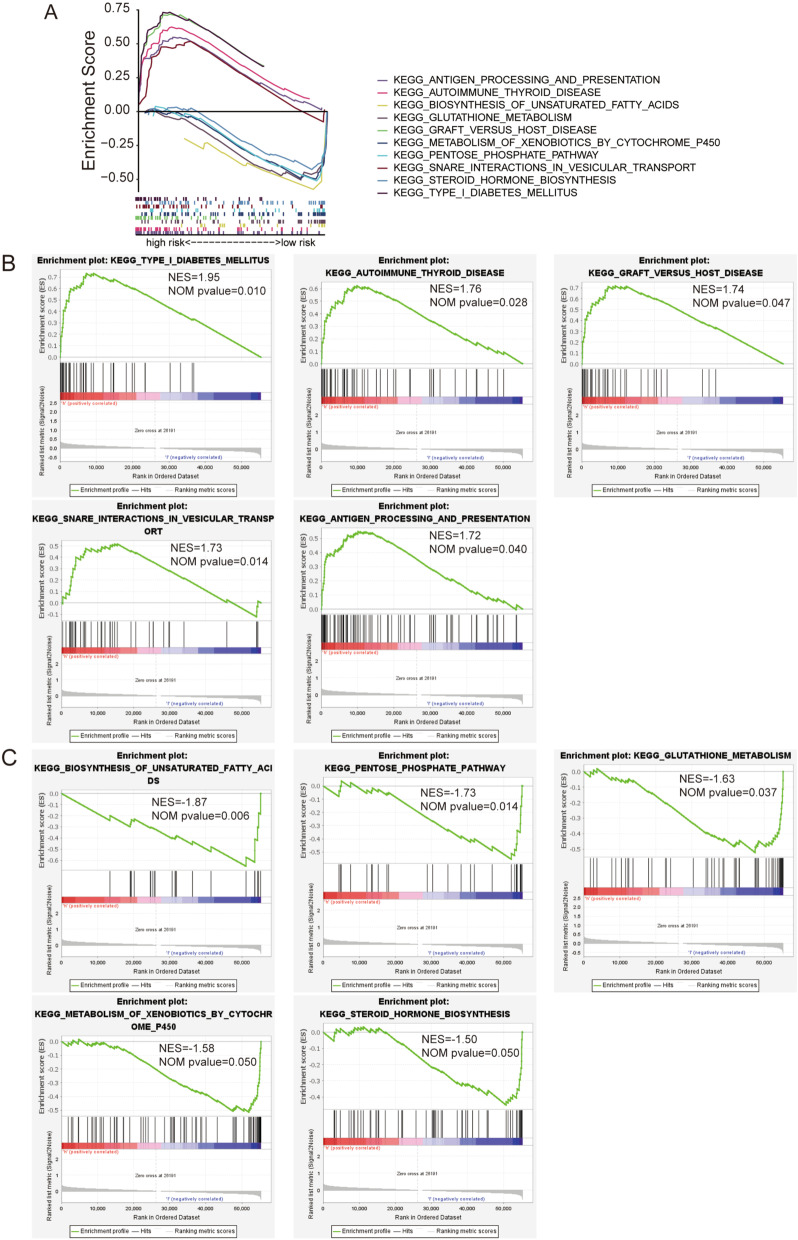
Results: A 6 necroptosis-related lncRNAs risk model composed of AC022211.2, Z94721.1, AC007991.2, SAMD12-AS1, AL035461.2 and AC051619.4 was established to predict the prognosis level of EC patients. qRT-PCR analysis showed upregulated Z94721.1 and AL035461.2 mRNA levels and downregulated AC051619.4 mRNA level in EC tissues compared with normal tissues. According to clinical characteristics, the patients in the high-risk group had a shorter overall survival than the low-risk group. The ROC curve and nomogram confirmed this model as one independent and predominant predictor. GSEA analysis showed metabolic and immune-related pathways enriched in the risk model. Most of the immune cells and immune checkpoints were positively correlated with the risk model, mainly active in the high-risk group. For the prediction of potential therapeutic drugs, 16 compounds in the high-risk group and 2 compounds in the low-risk group exhibited higher sensitivity.
Conclusions: Our results supported the necroptosis-related lncRNA signature could independently predict prognosis of EC patients, and provided theoretical basis for improving the clinical treatment of EC.
Keywords: EC; Immune; Necroptosis; Prognosis; lncRNA.
© 2022. The Author(s).
Conflict of interest statement
The authors declare no competing interests.
Figures


Similar articles
-
The necroptosis-related signature and tumor microenvironment immune characteristics associated with clinical prognosis and drug sensitivity analysis in stomach adenocarcinoma.Aging (Albany NY). 2024 Mar 27;16(7):6098-6117. doi: 10.18632/aging.205690. Epub 2024 Mar 27. Aging (Albany NY). 2024. PMID: 38546403 Free PMC article.
-
Predicting Prognosis and Distinguishing Cold and Hot Tumors in Bladder Urothelial Carcinoma Based on Necroptosis-Associated lncRNAs.Front Immunol. 2022 Jul 4;13:916800. doi: 10.3389/fimmu.2022.916800. eCollection 2022. Front Immunol. 2022. PMID: 35860239 Free PMC article.
-
A novel prognosis prediction of esophageal cancer based on chromatin regulator-related lncRNA.Medicine (Baltimore). 2023 Jul 14;102(28):e34281. doi: 10.1097/MD.0000000000034281. Medicine (Baltimore). 2023. PMID: 37443468 Free PMC article.
-
A Novel Necroptosis-Related lncRNA Signature for Predicting Prognosis and Immune Response of Glioma.Biomed Res Int. 2022 Jun 16;2022:3742447. doi: 10.1155/2022/3742447. eCollection 2022. Biomed Res Int. 2022. PMID: 35757472 Free PMC article.
-
Subtype cluster analysis unveiled the correlation between m6A- and cuproptosis-related lncRNAs and the prognosis, immune microenvironment, and treatment sensitivity of esophageal cancer.Front Immunol. 2025 Feb 17;16:1539630. doi: 10.3389/fimmu.2025.1539630. eCollection 2025. Front Immunol. 2025. PMID: 40034693 Free PMC article.
Cited by
-
Prognostic analysis and risk assessment based on RNA editing in hepatocellular carcinoma.J Appl Genet. 2024 Sep;65(3):519-530. doi: 10.1007/s13353-023-00819-y. Epub 2024 Jan 13. J Appl Genet. 2024. PMID: 38217666
-
A four-gene signature predicts overall survival of patients with esophageal adenocarcinoma.Transl Cancer Res. 2024 Mar 31;13(3):1382-1393. doi: 10.21037/tcr-23-1798. Epub 2024 Mar 7. Transl Cancer Res. 2024. PMID: 38617513 Free PMC article.
References
MeSH terms
Substances
Grants and funding
LinkOut - more resources
Full Text Sources
Medical
