

ASIC1α up-regulates MMP-2/9 expression to enhance mobility and proliferation of liver cancer cells via the PI3K/AKT/mTOR pathway
- PMID: 35840921
- PMCID: PMC9287982
- DOI: 10.1186/s12885-022-09874-w
ASIC1α up-regulates MMP-2/9 expression to enhance mobility and proliferation of liver cancer cells via the PI3K/AKT/mTOR pathway
Abstract
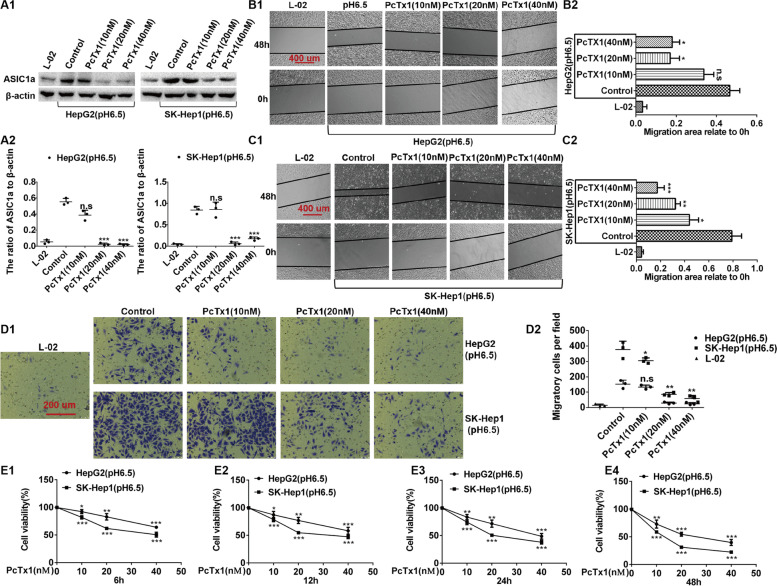
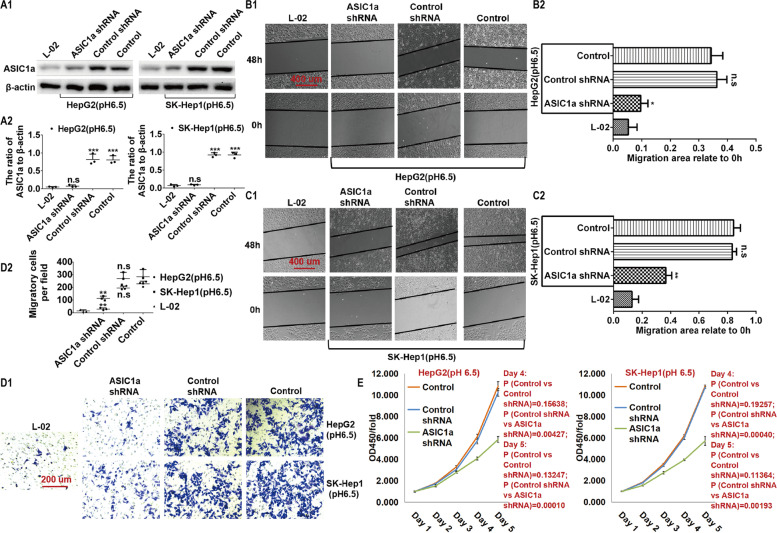
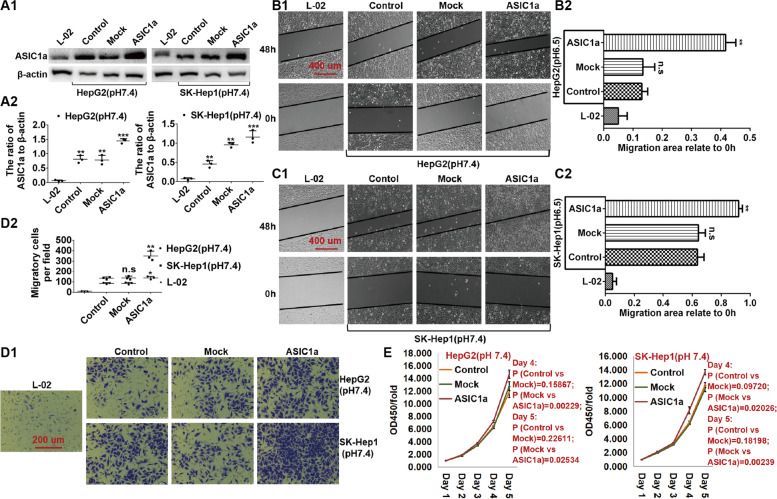
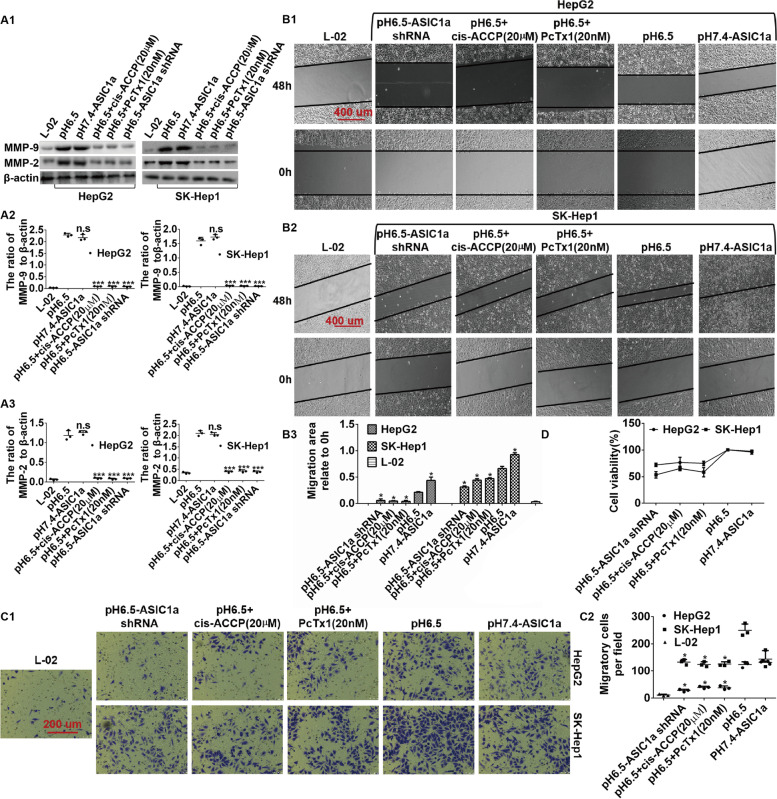
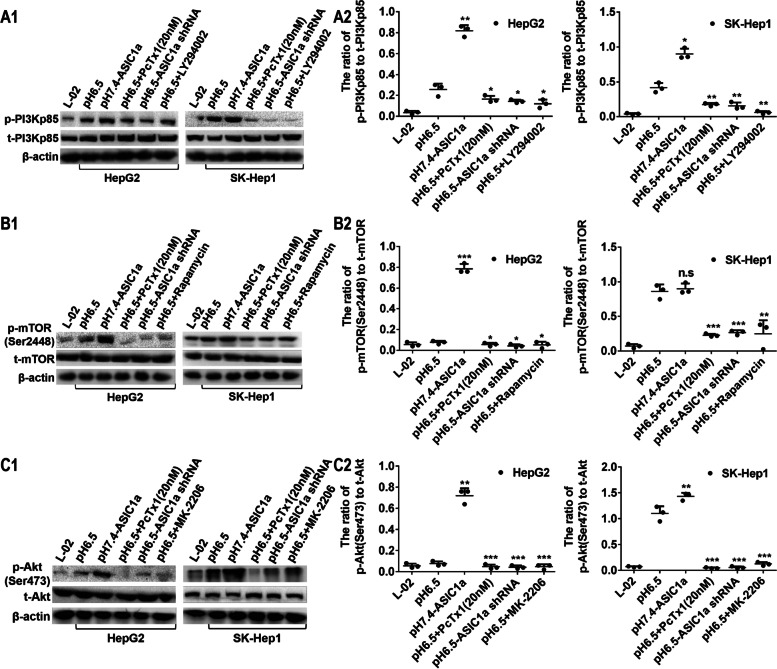
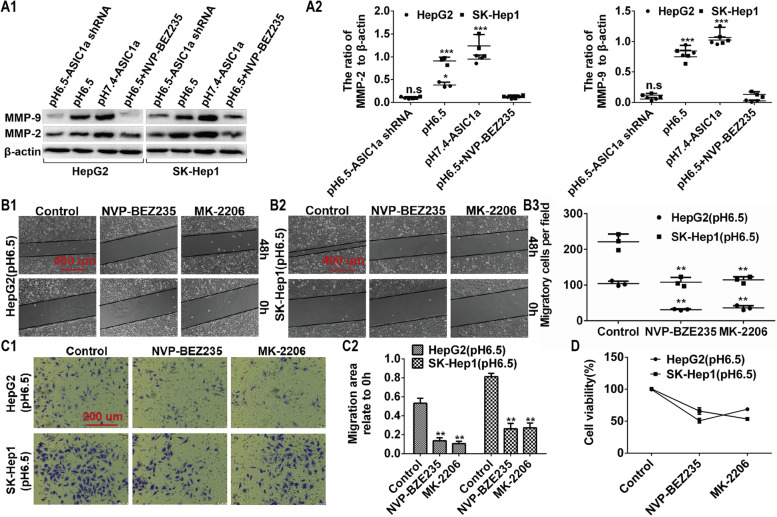
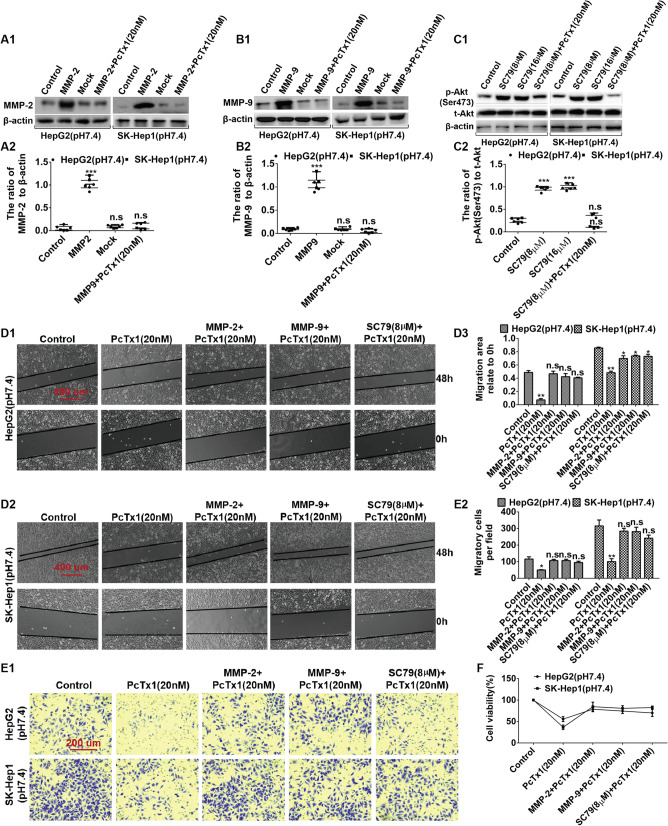
A major challenge in the treatment of liver cancer is that a large proportion of patients fail to achieve long-term disease control, with death from liver cancer cell migration and invasion. Acid-sensitive ion channel 1α (ASIC1α) is involved in the migration, invasion, and proliferation of liver cancer cells. Therefore, we explored the mechanism of ASIC1α-mediated liver cancer cell migration and invasion. We determined the levels of ASIC1α by western blotting and immunofluorescence in HepG2 and SK-Hep1 cells cultured in various acidic conditions. In addition, wound healing assay, transwell invasion assay, and MTT assay were conducted to assess the migration, invasion, and proliferation abilities of liver cancer cells. Western blotting was conducted to determine the levels of MMP2, MMP9, ASIC1α, p-PI3Kp85, t-PI3Kp85, p-AKT(Ser473), t-AKT, p-mTOR (Ser2448), t-mTOR. We first found that the levels of ASIC1α in the HepG2 and SK-Hep1 cells in acidic conditions (pH 6.5) were significantly increased. Inhibition and knockdown of ASIC1α down-regulated MMP-2/9 expression and inhibited the migration, invasion, and proliferation of HepG2 and SK-Hep1 cells; overexpression of ASIC1α had the opposite effect. We further demonstrated that ASIC1α up-regulates MMP-2/9 via activation of the PI3K/AKT/mTOR pathway, thereby promoting migration, invasion, and proliferation of liver cancer cells. Overexpression of MMP-2/9 and activation of AKT reversed these effects on liver cancer cells caused by inhibition of ASIC1α. We conclude that ASIC1α can regulate migration, invasion, and proliferation of liver cancer cells through the MMP-2/9/PI3K/AKT/mTOR pathway. These observations may provide a new reference for liver cancer chemotherapy.
Keywords: Acid-sensitive ion channel 1α; HepG2 cells; Liver cancer; MMP-2/9; PI3K/AKT/mTOR; SK-Hep1cells.
© 2022. The Author(s).
Conflict of interest statement
The authors declare that they have no competing interests.
Figures

Similar articles
-
[Kuwanon G inhibits growth, migration and invasion of gastric cancer cells by regulating the PI3K/AKT/mTOR pathway].Nan Fang Yi Ke Da Xue Xue Bao. 2024 Aug 20;44(8):1476-1484. doi: 10.12122/j.issn.1673-4254.2024.08.06. Nan Fang Yi Ke Da Xue Xue Bao. 2024. PMID: 39276043 Free PMC article. Chinese.
-
Suppressive effects of microRNA-16 on the proliferation, invasion and metastasis of hepatocellular carcinoma cells.Int J Mol Med. 2015 Dec;36(6):1713-9. doi: 10.3892/ijmm.2015.2379. Epub 2015 Oct 16. Int J Mol Med. 2015. PMID: 26499886
-
Alpha1-ACT Functions as a Tumour Suppressor in Hepatocellular Carcinoma by Inhibiting the PI3K/AKT/mTOR Signalling Pathway via Activation of PTEN.Cell Physiol Biochem. 2017;41(6):2289-2306. doi: 10.1159/000475648. Epub 2017 Apr 26. Cell Physiol Biochem. 2017. PMID: 28456796
-
Kaempferol inhibits proliferation, migration, and invasion of liver cancer HepG2 cells by down-regulation of microRNA-21.Int J Immunopathol Pharmacol. 2018 Mar-Dec;32:2058738418814341. doi: 10.1177/2058738418814341. Int J Immunopathol Pharmacol. 2018. Retraction in: Int J Immunopathol Pharmacol. 2021 Jan-Dec;35:20587384211040394. doi: 10.1177/20587384211040394. PMID: 30477356 Free PMC article. Retracted.
-
PTEN inhibits the migration and invasion of HepG2 cells by coordinately decreasing MMP expression via the PI3K/Akt pathway.Oncol Rep. 2010 Jun;23(6):1593-600. doi: 10.3892/or_00000800. Oncol Rep. 2010. PMID: 20428814
Cited by
-
Overexpression of YEATS2 Remodels the Extracellular Matrix to Promote Hepatocellular Carcinoma Progression via the PI3K/AKT Pathway.Cancers (Basel). 2023 Mar 20;15(6):1850. doi: 10.3390/cancers15061850. Cancers (Basel). 2023. PMID: 36980736 Free PMC article.
-
IGF-1R down regulates the sensitivity of hepatocellular carcinoma to sorafenib through the PI3K / akt and RAS / raf / ERK signaling pathways.BMC Cancer. 2023 Jan 25;23(1):87. doi: 10.1186/s12885-023-10561-7. BMC Cancer. 2023. PMID: 36698167 Free PMC article.
-
Apoptotic vesicles of mesenchymal stem cells promote M2 polarization and alleviate early-onset preeclampsia via miR-191-5p.Stem Cell Res Ther. 2025 Jul 30;16(1):414. doi: 10.1186/s13287-025-04546-5. Stem Cell Res Ther. 2025. PMID: 40739581 Free PMC article.
-
Antioxidant and anti-inflammatory agents in chronic liver diseases: Molecular mechanisms and therapy.World J Hepatol. 2023 Feb 27;15(2):180-200. doi: 10.4254/wjh.v15.i2.180. World J Hepatol. 2023. PMID: 36926234 Free PMC article. Review.
-
Indirect bilirubin impairs invasion of osteosarcoma cells via inhibiting the PI3K/AKT/MMP-2 signaling pathway by suppressing intracellular ROS.J Bone Oncol. 2023 Feb 23;39:100472. doi: 10.1016/j.jbo.2023.100472. eCollection 2023 Apr. J Bone Oncol. 2023. PMID: 36876225 Free PMC article.
References
-
- Song N, Lu Z, Zhang J, Shi Y, Ning Y, Chen J, Jin S, Shen B, Fang Y, Zou J, Teng J, Chu XP, Shen L, Ding X. Acid-sensing ion channel 1a is involved in ischaemia/reperfusion induced kidney injury by increasing renal epithelia cell apoptosis. J Cell Mol Med. 2019;23:3429–3440. doi: 10.1111/jcmm.14238. - DOI - PMC - PubMed
-
- Zuo L, Zhu Y, Hu L, Liu Y, Wang Y, Hu Y, Wang H, Pan X, Li K, Du N, Huang Y. PI3-kinase/Akt pathway-regulated membrane transportation of acid-sensing ion channel 1a/Calcium ion influx/endoplasmic reticulum stress activation on PDGF-induced HSC Activation. J Cell Mol Med. 2019;23(6):3940–3950. doi: 10.1111/jcmm.14275. - DOI - PMC - PubMed
MeSH terms
Substances
LinkOut - more resources
Full Text Sources
Medical
Miscellaneous
