. 2022 Jul 15;20(1):163.
doi: 10.1186/s12915-022-01340-0.

Proton export upregulates aerobic glycolysis

Affiliations

Proton export upregulates aerobic glycolysis

Shonagh Russell et al. BMC Biol. .

Abstract

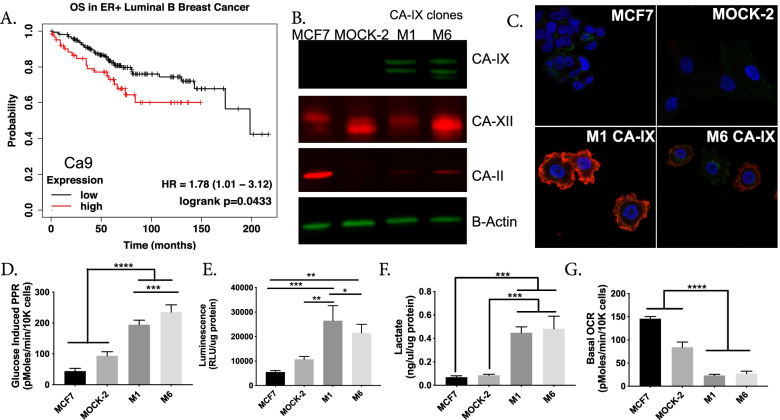
Introduction: Aggressive cancers commonly ferment glucose to lactic acid at high rates, even in the presence of oxygen. This is known as aerobic glycolysis, or the "Warburg Effect." It is widely assumed that this is a consequence of the upregulation of glycolytic enzymes. Oncogenic drivers can increase the expression of most proteins in the glycolytic pathway, including the terminal step of exporting H+ equivalents from the cytoplasm. Proton exporters maintain an alkaline cytoplasmic pH, which can enhance all glycolytic enzyme activities, even in the absence of oncogene-related expression changes. Based on this observation, we hypothesized that increased uptake and fermentative metabolism of glucose could be driven by the expulsion of H+ equivalents from the cell.

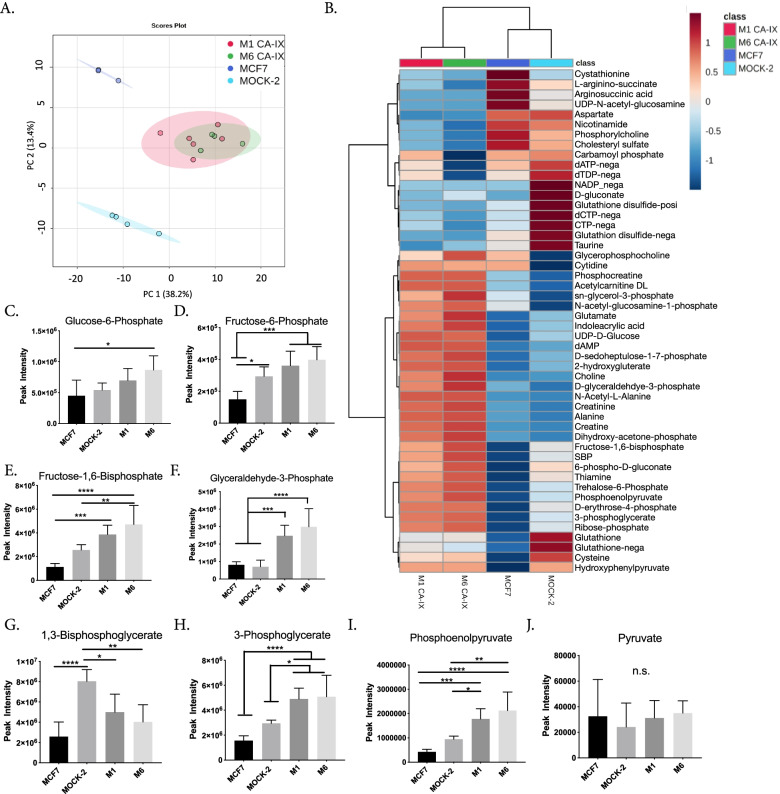
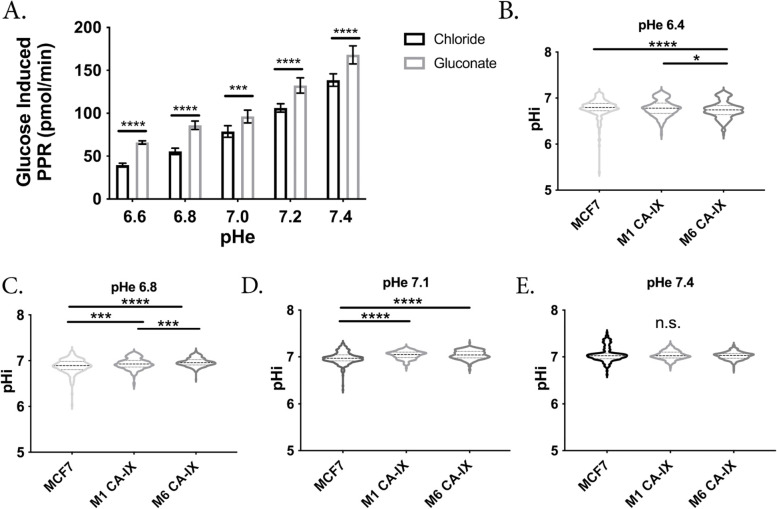
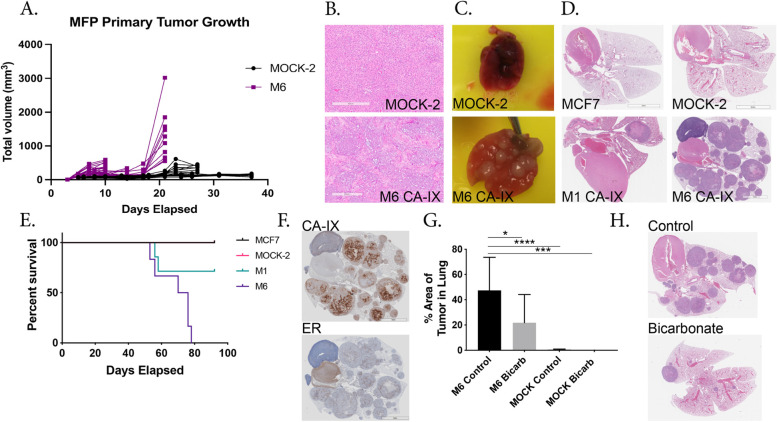
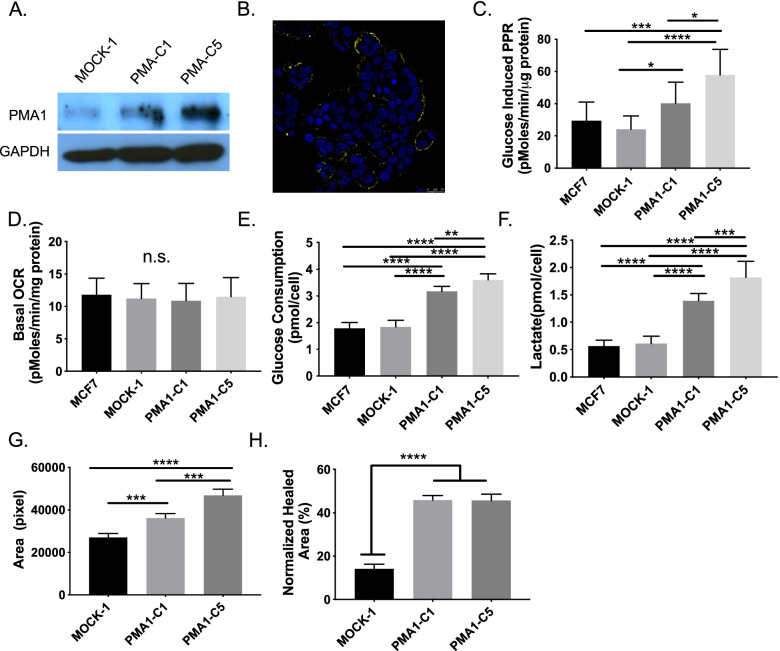
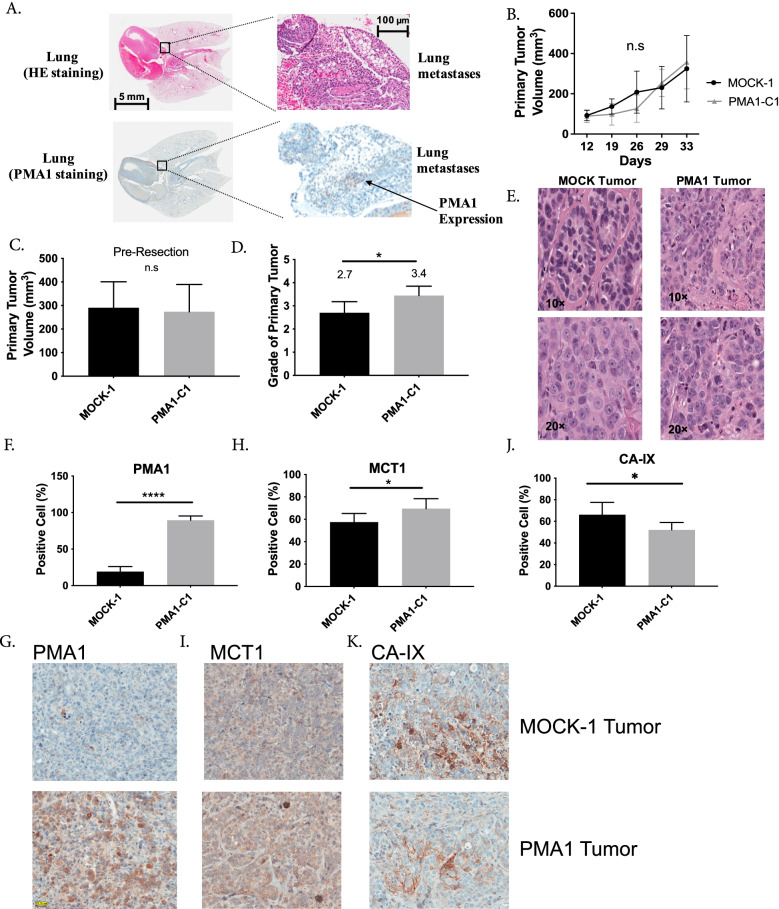
Results: To test this hypothesis, we stably transfected lowly glycolytic MCF-7, U2-OS, and glycolytic HEK293 cells to express proton-exporting systems: either PMA1 (plasma membrane ATPase 1, a yeast H+-ATPase) or CA-IX (carbonic anhydrase 9). The expression of either exporter in vitro enhanced aerobic glycolysis as measured by glucose consumption, lactate production, and extracellular acidification rate. This resulted in an increased intracellular pH, and metabolomic analyses indicated that this was associated with an increased flux of all glycolytic enzymes upstream of pyruvate kinase. These cells also demonstrated increased migratory and invasive phenotypes in vitro, and these were recapitulated in vivo by more aggressive behavior, whereby the acid-producing cells formed higher-grade tumors with higher rates of metastases. Neutralizing tumor acidity with oral buffers reduced the metastatic burden.

Conclusions: Therefore, cancer cells which increase export of H+ equivalents subsequently increase intracellular alkalization, even without oncogenic driver mutations, and this is sufficient to alter cancer metabolism towards an upregulation of aerobic glycolysis, a Warburg phenotype. Overall, we have shown that the traditional understanding of cancer cells favoring glycolysis and the subsequent extracellular acidification is not always linear. Cells which can, independent of metabolism, acidify through proton exporter activity can sufficiently drive their metabolism towards glycolysis providing an important fitness advantage for survival.

Keywords: CA-IX; Cancer; Glycolysis; Metastasis; PMA1; Proton; Warburg; pH.


Conflict of interest statement

RJG is supported by a grant from Helix, Biopharma. The other authors declare that they have no competing interests.

Figures

Fig. 1
Fig. 1
Over-expression of CA-IX in MCF-7 breast cancer cells increases glycolytic metabolism in vitro. A Overall survival Kaplan–Meier curve in ER-positive luminal B breast cancer comparing low and high CA9 gene expression n = 226 (kmplot.com). Statistical analysis using Log-rank P test p = 0.0433. B Immunoblotting of protein lysates from MCF-7 cells transfected with empty vector (MOCK-2) or Ca9 vector (M1 and M6). Proteins from total cell extracts were immunoblotted for CA-IX, CA-II, CA-XII, and B-actin (loading control). C Representative immunocytochemistry images of CA-IX protein expression in MCF-7, MOCK-2, and CA-IX clones M1 and M6. CA-IX clones (M1 & M6) exhibit CA-IX membrane staining, whereas MOCK-2 and parental MCF-7 cells do not. DAPI nuclear stain (blue), wheat germ agglutinin membrane stain (green), and CA-IX stain (red). D Glucose induced proton production rate (PPR) using the Seahorse extracellular flux analyzer, measured post glucose injection (N = 8 biological replicates per group). E Glucose uptake of cells in each group (n = 3 biological replicates) over 24 h, measured as luminescence generated using Glucose Uptake-Glo assay (Promega). F Lactate measured in extracellular media after 24 h using Sigma kit (n = 3 biological replicates per group). G Basal oxygen consumption rate (OCR) measured using the Seahorse extracellular flux analyzer in 5.8 mM glucose concentration (N = 8 biological replicates per group). D–G Data are shown as mean ± SD, statistical analysis using ordinary one-way ANOVA. *p < 0.05, **p < 0.01, ***p < 0.001, ****p < 0.0001
Fig. 2
Fig. 2
Unlabeled metabolic profiling and analysis of intracellular metabolites of CA-IX expressing MCF-7 cells. A Principal component analysis of intracellular metabolites in CA-IX expressing, MOCK-2, and parental MCF-7 cells. B Heatmap (hierarchical clustering) of the fifty most significant fold changes of intracellular metabolites between CA-IX expressing clones, MOCK-2, and parental cells. Numerous glycolytic intermediates were significantly higher in CA-IX expressing cells compared to MOCK-2 and parental. C–J Average peak intensity of each glycolytic intermediate in CA-IX expressing, MOCK-2, and parental MCF-7 cells. N = 5–6 biological replicates per group, statistical analysis using ordinary one-way ANOVA. *p < 0.05, **p < 0.01, ***p < 0.001, ****p < 0.0001
Fig. 3
Fig. 3
Increased intracellular pH enhances glycolysis in breast cancer cells. A Increased intracellular pH, using gluconate substituted media, increases the glucose-induced PPR in MCF7 cells irrespective of pHe. N = 8 per group, statistical analysis using Welch’s T-test; B–E Intracellular pH as measured using cSNARF1 in varying extracellular pH, n = 158–438 cells analyzed per group, statistical analysis using Kruskal–Wallis test. *p < 0.05, ***p < 0.001, ****p < 0.0001
Fig. 4
Fig. 4
In vivo CA-IX expressing cell studies on tumor growth, metastasis, and response to buffer therapy. A Primary tumor volume of control or CA-IX cells implanted in the mammary fat pad, n = 10 mice per group, statistical analysis using Welch’s T-test. Statistical analysis of the tumor volume was carried out to determine if tumor growth rate was different between the Mock-2 and M6 groups. Linear regression analysis showed the differences between the slopes were extremely significant. F = 21.03. DFn = 1, DFd = 116, P < 0.0001. B Representative H&E staining of resected primary tumors. M6 CA-IX group showed high infiltration of stromal cells compared to MOCK-2. C Representative whole lung images from MOCK-2 and M6 experimental metastasis model showing the extent of metastasis visible. D Representative immunohistochemistry of H&E staining in the lungs of the experimental metastasis groups, showing gross metastasis in the lungs. E Kaplan–Meier survival curve of experimental metastasis study in SCID beige mice, 90-day endpoint after tail vein injection of cells. Log-rank test performed p = 0.0062, df = 3. N = 5(MCF-7), 6(MOCK-2), 7(M1), 7(M6) mice. F Representative immunohistochemistry of M6 lungs with antibodies towards CA-IX and ER, to confirm the generated M6 clones were the cells forming tumors in the lungs. MCF-7 cells are ER-positive. G Effect of buffer therapy on experimental metastasis of CA-IX clone M6 and MOCK-2 cells in SCID beige mice and the % of tumor burden in the lungs, 77 days after IV injection of cells. Data are shown as average % ± SD, N = 6(M6), 9(M6 Bicarb), 9(MOCK-2), 7(MOCK-2 Bicarb) mice, statistical analysis using ordinary one-way ANOVA. H Immunohistochemistry of H&E staining in the lungs of the M6 control and bicarb-treated experimental metastasis study groups, showing gross metastasis of the lungs. *p < 0.05, **p < 0.01, ***p < 0.001, ****p < 0.0001
Fig. 5
Fig. 5
Effects of over-expression of yeast ATPase proton pump, PMA1, in MCF-7 breast cancer cells in vitro. A Immunoblotting of protein lysates from empty vector (MOCK-1) or PMA1 vector (C1 and C5) transfected MCF-7 cells for PMA1 and GAPDH (loading control). B Representative immunocytochemistry image of PMA1 expression (yellow), overlayed with DAPI nuclear stain (blue), in PMA1-C5 non-permeabilized MCF-7 cells. C Seahorse extracellular flux analysis of glucose-induced proton production rate in MCF-7 parental, MOCK-1, PMA1-C1, and PMA1-C5 MCF-7 cells (n = 9 biological replicates). D Seahorse extracellular flux analysis of basal oxygen consumption in the presence of glucose for MCF-7 parental, MOCK-1, PMA1-C1, and PMA1-C5 MCF-7 cells (n = 20 biological replicates). E Glucose concentration in tumor-conditioned media collected after culturing to confluence from MCF-7 parental, MOCK-1, PMA1-C1, and PMA1-C5 MCF-7 cells for 24 h, measured using hexokinase activity assay (n = 9 biological replicates). F Lactate concentration in tumor-conditioned media collected after culturing to confluence from MCF-7 parental, MOCK-1, PMA1-C1, and PMA1-C5 MCF-7 cells for 24 h, measured using fluorescent lactate assay (n = 9 biological replicates). G Gel escape assay to measure migration and invasion in MOCK-1, PMA1-C1, and PMA1-C5 MCF-7 cells. Cells are embedded in a Matrigel droplet without serum, and they are surrounded by media containing serum. Droplets are monitored over 1 week for cell invasion out of the droplet and the area measured is normalized to cellular proliferation rates (n = 4 biological replicates). H Circular wound healing assay of MOCK-1, PMA1-C1, and PMA1-C5 MCF-7 cells. A circular wound is created with a rubber stopper and then cells are monitored migrating into the area to close the wound. The area healed is quantified in % relative to starting area and normalized to the cellular proliferation rate (N = 4 biological replicates). Data are shown as mean ± SD. Statistical analysis using ordinary one-way ANOVA. *p < 0.05, **p < 0.01, ***p < 0.001, ****p < 0.0001
Fig. 6
Fig. 6
In vivo PMA1 expressing cell studies on tumor growth, metastasis, and expression of metabolic markers. A Representative lung images (5 mm and 100 µm) from the experimental metastasis study in SCID beige mice, whereby MOCK-1 or PMA1-C1 cells were injected via the tail vein and allowed to grow for 3 months. At the endpoint lungs were resected and sections were stained with H & E to look for metastases, and PMA1 to confirm expression in the PMA1-C1 metastases. B Primary tumor growth rate in SCID beige mice of MOCK-1 or PMA1-C1 cell lines, injected subcutaneously (n = 7(MOCK-1) n = 6 (PMA1-C1)). C Quantification of primary tumor volume, MOCK-1 or PMA1-C1, resected after 33 days of growth in SCID beige mice. Tumors were resected to allow for spontaneous metastasis studies to continue (n = 9 (MOCK-1) and n = 9 (PMA1)). D Histological grade of MOCK-1 and PMA1 tumors (n = 10 (MOCK-1) and n = 9 (PMA1). E Representative images of H & E staining in MOCK-1 and PMA1 primary tumors were used to score histological grade. F,G Quantification of immunohistochemistry staining and representative images of PMA1 protein in FFPE sections of resected primary tumors, MOCK-1 and PMA1-C1 (N = 10 (MOCK-1) and N = 9 (PMA1)). H,I Quantification of immunohistochemistry staining and representative images of MCT1 protein in FFPE sections of resected primary tumors, MOCK-1 and PMA1-C1 (n = 10 (MOCK-1) and n = 9 (PMA1)). J,K Quantification of immunohistochemistry staining and representative images of CA-IX protein in FFPE sections of resected primary tumors, MOCK-1 and PMA1-C1 (n = 10 (MOCK-1) and n = 9 (PMA1)). Data are shown as mean ± SD. Statistical analysis using unpaired t-test with Welch’s correction *p < 0.05, **p < 0.01, ***p < 0.001, ****p < 0.0001

Similar articles

Cited by

References

    1. Beketic-Oreskovic L, Ozretic P, Rabbani ZN, Jackson IL, Sarcevic B, Levanat S, Vujaskovic Z. Prognostic significance of carbonic anhydrase IX (CAIX), endoglin (CD105), and 8-hydroxy-2deoxyguanosine (8-OHdG) in breast cancer patients. J Clin Oncol. 2010;28:e21048–e21048. doi: 10.1200/jco.2010.28.15_suppl.e21048. - DOI - PubMed
    1. Birchmeier C, Birchmeier W, Gherardi E, Vande Woude GF. Met, metastasis, motility and more. Nat Rev Mol Cell Biol. 2003;4:915–925. doi: 10.1038/nrm1261. - DOI - PubMed
    1. Boedtkjer E. Na(+), HCO3(-) cotransporter NBCn1 accelerates breast carcinogenesis. Cancer Metastasis Rev. 2019;38:165–178. doi: 10.1007/s10555-019-09784-7. - DOI - PubMed
    1. Brand A, Singer K, Koehl GE, Kolitzus M, Schoenhammer G, Thiel A, Matos C, Bruss C, Klobuch S, Peter K, et al. LDHA-associated lactic acid production blunts tumor immunosurveillance by T and NK cells. Cell Metab. 2016;24:657–671. doi: 10.1016/j.cmet.2016.08.011. - DOI - PubMed
    1. Buzzai M, Bauer DE, Jones RG, Deberardinis RJ, Hatzivassiliou G, Elstrom RL, Thompson CB. The glucose dependence of Akt-transformed cells can be reversed by pharmacologic activation of fatty acid beta-oxidation. Oncogene. 2005;24:4165–4173. doi: 10.1038/sj.onc.1208622. - DOI - PubMed

Publication types