Amphiregulin regulates odontogenic differentiation of dental pulp stem cells by activation of mitogen-activated protein kinase and the phosphatidylinositol 3-kinase signaling pathways
- PMID: 35841013
- PMCID: PMC9284861
- DOI: 10.1186/s13287-022-02971-4
Amphiregulin regulates odontogenic differentiation of dental pulp stem cells by activation of mitogen-activated protein kinase and the phosphatidylinositol 3-kinase signaling pathways
Abstract
Background: Human dental pulp stem cells (hDPSCs) have received widespread attention in the fields of tissue engineering and regenerative medicine. Although amphiregulin (AREG) has been shown to play a vital function in the biological processes of various cell types, its effects on DPSCs remain largely unknown. The aim of this study was to explore the specific role of AREG as a biologically active factor in the regeneration of dental pulp tissue.
Methods: The growth of hDPSCs, together with their proliferation and apoptosis, in response to AREG was examined by CCK-8 assay and flow cytometry. We explored the effects of AREG on osteo/odontogenic differentiation in vitro and investigated the regeneration and mineralization of hDPSCs in response to AREG in vivo. The effects of AREG gain- and loss-of-function on DPSC differentiation were investigated following transfection using overexpression plasmids and shRNA, respectively. The involvement of the mitogen-activated protein kinase (MAPK) or phosphatidylinositol 3-kinase (PI3K)/Akt pathways in the mineralization process and the expression of odontoblastic marker proteins after AREG induction were investigated by using Alizarin Red S staining and Western blotting, respectively.
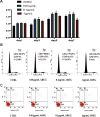
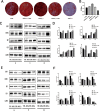
Results: AREG (0.01-0.1 µg/mL) treatment of hDPSCs from 1 to 7 days increased hDPSCs growth and affected apoptosis minimally compared with negative controls. AREG exposure significantly promoted hDPSC differentiation, shown by increased mineralized nodule formation and the expression of odontoblastic marker protein expression. In vivo micro-CT imaging and quantitative analysis showed significantly greater formation of highly mineralized tissue in the 0.1 μg/mL AREG exposure group in DPSC/NF-gelatin-scaffold composites. AREG also promoted extracellular matrix production, with collagen fiber, mineralized matrix, and calcium salt deposition on the composites, as shown by H&E, Masson, and Von Kossa staining. Furthermore, AREG overexpression boosted hDPSC differentiation while AREG silencing inhibited it. During the differentiation of hDPSCs, AREG treatment led to phosphorylation of extracellular signal-regulated kinase (ERK), c-Jun N-terminal kinase (JNK), and PI3K/Akt. Notably, a specific inhibitor of ERK, JNK, and PI3K/Akt signaling markedly reduced AREG-induced differentiation, as well as levels of phosphorylated ERK and JNK in hDPSCs.
Conclusions: The data indicated that AREG promoted odontoblastic differentiation and facilitated regeneration and mineralization processes in hDPSCs.
Keywords: Cell differentiation; Signal transduction; Tissue regeneration.
© 2022. The Author(s).
Conflict of interest statement
The authors declared no potential conflicts of competing interest with respect to the research, authorship, and/or publication of this article.
Figures


Similar articles
-
ETV2 promotes osteogenic differentiation of human dental pulp stem cells through the ERK/MAPK and PI3K-Akt signaling pathways.Stem Cell Res Ther. 2022 Oct 4;13(1):495. doi: 10.1186/s13287-022-03052-2. Stem Cell Res Ther. 2022. PMID: 36195958 Free PMC article.
-
Insulin promotes the bone formation capability of human dental pulp stem cells through attenuating the IIS/PI3K/AKT/mTOR pathway axis.Stem Cell Res Ther. 2024 Jul 29;15(1):227. doi: 10.1186/s13287-024-03843-9. Stem Cell Res Ther. 2024. PMID: 39075596 Free PMC article.
-
LPS promote the odontoblastic differentiation of human dental pulp stem cells via MAPK signaling pathway.J Cell Physiol. 2015 Mar;230(3):554-61. doi: 10.1002/jcp.24732. J Cell Physiol. 2015. PMID: 25104580
-
Effects of different signaling pathways on odontogenic differentiation of dental pulp stem cells: a review.Front Physiol. 2023 Oct 19;14:1272764. doi: 10.3389/fphys.2023.1272764. eCollection 2023. Front Physiol. 2023. PMID: 37929208 Free PMC article. Review.
-
Notch and Wnt Signaling Modulation to Enhance DPSC Stemness and Therapeutic Potential.Int J Mol Sci. 2023 Apr 17;24(8):7389. doi: 10.3390/ijms24087389. Int J Mol Sci. 2023. PMID: 37108549 Free PMC article. Review.
Cited by
-
In Vitro and In Vivo Evaluation of Epidermal Growth Factor (EGF) Loaded Alginate-Hyaluronic Acid (AlgHA) Microbeads System for Wound Healing.J Funct Biomater. 2023 Jul 28;14(8):403. doi: 10.3390/jfb14080403. J Funct Biomater. 2023. PMID: 37623648 Free PMC article.
-
Amphiregulin blockade decreases the levodopa-induced dyskinesia in a 6-hydroxydopamine Parkinson's disease mouse model.CNS Neurosci Ther. 2023 Oct;29(10):2925-2939. doi: 10.1111/cns.14229. Epub 2023 Apr 26. CNS Neurosci Ther. 2023. PMID: 37101388 Free PMC article.
-
hsa_circ_0001599 promotes odontogenic differentiation of human dental pulp stem cells by increasing ITGA2 expression and stability.Commun Biol. 2025 Jan 17;8(1):74. doi: 10.1038/s42003-025-07488-z. Commun Biol. 2025. PMID: 39825107 Free PMC article.
-
VPA Enhances Pulp Regeneration by Regulating LPS-Induced Human Dental Pulp Stem Cells Odontogenic Differentiation.Int Dent J. 2025 Aug;75(4):100850. doi: 10.1016/j.identj.2025.100850. Epub 2025 Jun 9. Int Dent J. 2025. PMID: 40494210 Free PMC article.
-
Three-dimensional matrix stiffness-based stem cell soil: Tri-phase biomechanical structure promoted human dental pulp stem cells to achieve pulpodentin regeneration.Mater Today Bio. 2025 Feb 21;31:101591. doi: 10.1016/j.mtbio.2025.101591. eCollection 2025 Apr. Mater Today Bio. 2025. PMID: 40104646 Free PMC article.
References
-
- d'Aquino R, Graziano A, Sampaolesi M, Laino G, Pirozzi G, De Rosa A, et al. Human postnatal dental pulp cells co-differentiate into osteoblasts and endotheliocytes: a pivotal synergy leading to adult bone tissue formation. Cell Death Differ. 2007;14(6):1162–1171. doi: 10.1038/sj.cdd.4402121. - DOI - PubMed
Publication types
MeSH terms
Substances
LinkOut - more resources
Full Text Sources
Medical
Research Materials
Miscellaneous

