. 2022 Jul 15;13(1):305.
doi: 10.1186/s13287-022-02992-z.

Metformin combats high glucose-induced damage to the osteogenic differentiation of human periodontal ligament stem cells via inhibition of the NPR3-mediated MAPK pathway

Affiliations

Metformin combats high glucose-induced damage to the osteogenic differentiation of human periodontal ligament stem cells via inhibition of the NPR3-mediated MAPK pathway

Yi-Lin Zhang et al. Stem Cell Res Ther. .

Abstract

Background: High glucose-induced damage to the osteogenic differentiation of human periodontal ligament stem cells (PDLSCs) has long been a challenge to periodontal regeneration for diabetic individuals. Metformin is an anti-hyperglycemic drug that exhibits abundant biological activities associated with cell metabolism and downstream tissue regeneration. However, how metformin combats damage to PDLSC osteogenic differentiation under high glucose and the underlying mechanisms remain unknown.

Methods: Osteogenic differentiation of PDLSCs was assessed by alkaline phosphatase (ALP) staining, ALP activity, Alizarin Red staining and quantitative assay, quantitative real-time polymerase chain reaction (qRT-PCR) and Western blot analysis. RNA-seq analysis was performed to screen target genes of metformin, and the effects of target genes were confirmed using lentivirus transfection. Western blot analysis was also used to detect the protein level of underlying signaling pathways.

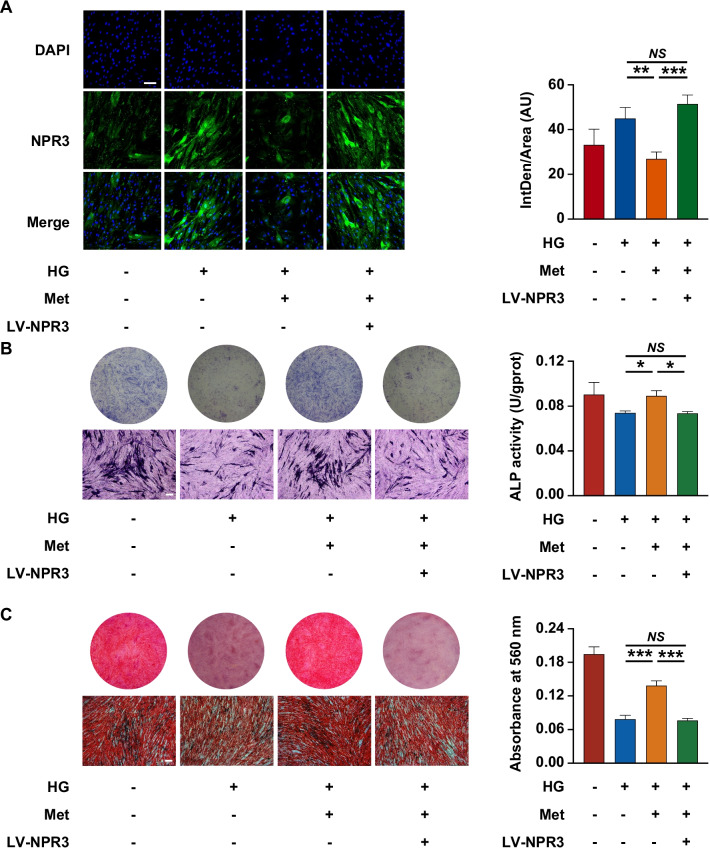
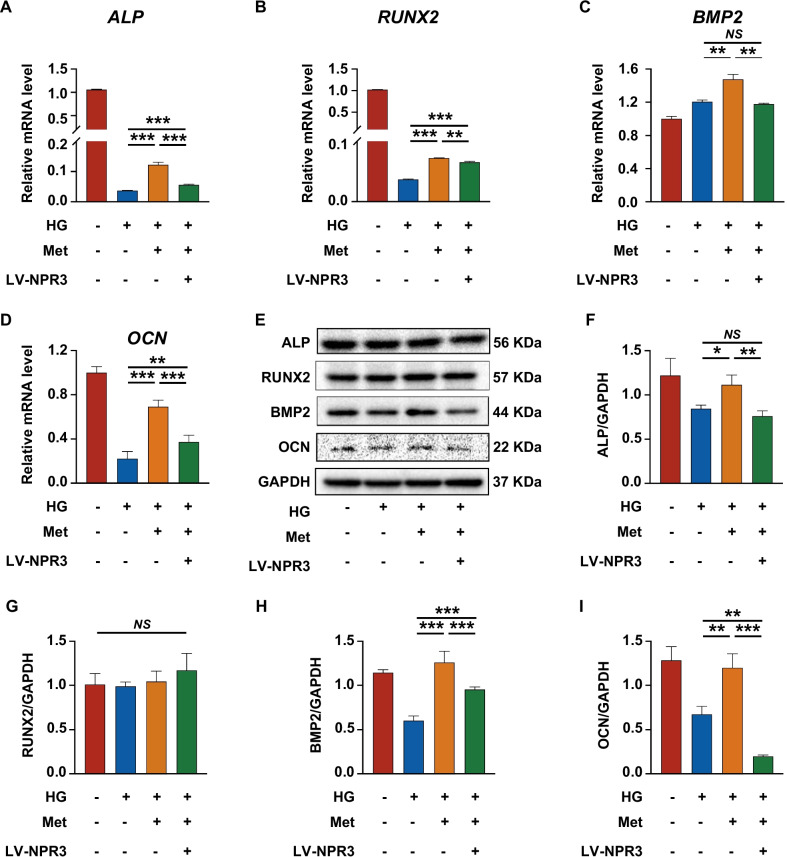
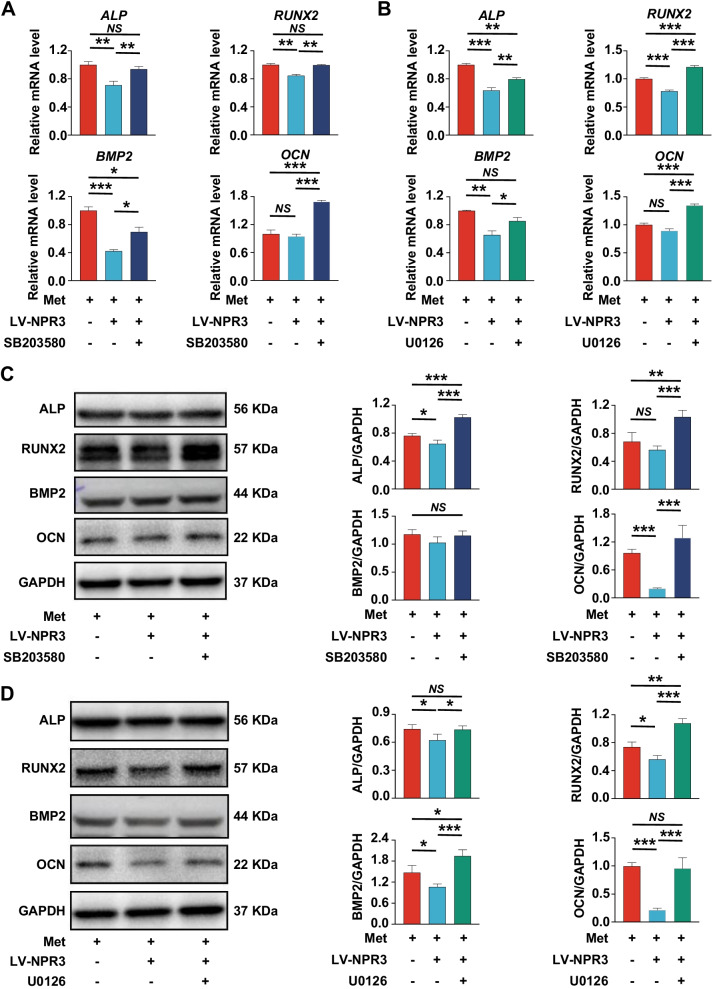
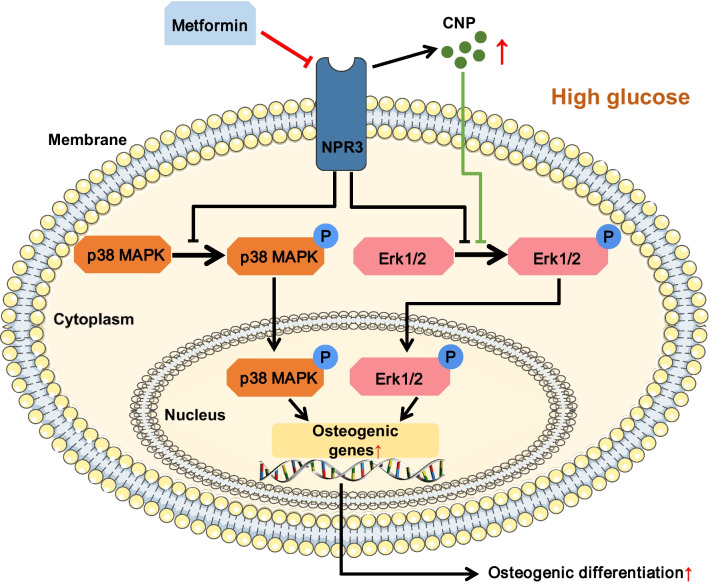
Results: We found that osteogenic differentiation of PDLSCs under high glucose was decreased, and metformin addition enhanced this capacity of differentiation. Furthermore, the results of RNA-seq analysis showed that natriuretic peptide receptor 3 (NPR3) was upregulated in PDLSCs under high glucose and downregulated after metformin addition. When the underlying pathways involved were investigated, we found that upregulation of NPR3 can compromise the metformin-enhanced PDLSC osteogenic differentiation and activate the MAPK pathway (especially the p38 MAPK and Erk1/2 pathway), and that inhibition of the NPR3-mediated p38 MAPK or Erk1/2 pathway enhanced the osteogenic differentiation of PDLSCs under high glucose.

Conclusions: The present study suggests that metformin may enhance the osteogenic differentiation of PDLSCs under high glucose via downregulation of NPR3 and inhibition of its downstream MAPK pathway. This is the first report identifying the involvement of NPR3-mediated MAPK pathway in the metformin-enhanced osteogenic differentiation, indicating that NPR3 antagonists, such as metformin, may be feasible therapeutics for periodontal tissue regeneration in diabetic individuals.

Keywords: High glucose; MAPK pathway; Metformin; NPR3; Osteogenic differentiation; Periodontal tissue regeneration.


Conflict of interest statement

The authors declare that they have no competing interests.

Figures

Fig. 1
Fig. 1
High glucose impaired the osteogenic differentiation of periodontal ligament stem cells (PDLSCs). A ALP staining and ALP activity assay of PDLSCs when they were cultured in normal (CON) or high glucose (HG) condition following a 7-day osteogenic induction (scale bar = 200 µm). B Alizarin Red staining and quantitative analysis of the stained calcium deposits formed by PDLSCs when they were cultured in CON or HG condition following a 21-day osteogenic induction (scale bar = 200 µm). C Expression of osteoblast differentiation-related genes (ALP, RUNX2, BMP2 and OCN) in PDLSCs when they were cultured in CON or HG condition following a 14-day osteogenic induction (mRNA expression levels detected by qRT-PCR). D Expression of osteoblast differentiation-related proteins (ALP, RUNX2, BMP2 and OCN) in PDLSCs when they were cultured in CON or HG condition following a 14-day osteogenic induction (protein expression levels detected by Western blot analysis). The displayed bands were cropped from the corresponding original blots. Experiments for P4 cells from three different donors were repeated independently for at least 3 times, and data are presented as the means ± SD (n = 3). p value was based on t test. *p < 0.05, **p < 0.01, and ***p < 0.001 represent significant differences between the indicated columns, while NS represents no significant difference
Fig. 2
Fig. 2
Metformin enhanced the osteogenic differentiation of PDLSCs under high glucose. A ALP staining and ALP activity assay of PDLSCs when they were cultured in normal (CON), high glucose (HG) or high glucose with metformin addition (HG + MET) following a 7-day osteogenic induction (scale bar = 200 µm). B Alizarin Red staining and quantitative analysis of the stained calcium deposits formed by PDLSCs when they were cultured in normal (CON), high glucose (HG) or high glucose with metformin addition (HG + MET) following a 21-day osteogenic induction (scale bar = 200 µm). C Expression of osteoblast differentiation-related genes (ALP, RUNX2, BMP2 and OCN) in PDLSCs when they were cultured in normal, high glucose or high glucose with metformin addition following a 14-day osteogenic induction (mRNA expression levels detected by qRT-PCR). D Expression of osteoblast differentiation-related proteins (ALP, RUNX2, BMP2 and OCN) in PDLSCs when they were cultured in normal, high glucose or high glucose with metformin addition following a 14-day osteogenic induction (protein expression levels detected by Western blot analysis). The displayed bands were cropped from the corresponding original blots. HG, high glucose. Met, metformin. Experiments for P4 cells from three different donors were repeated independently for at least 3 times, and data are presented as the means ± SD (n = 3). p value was based on one-way analysis of variance (one-way ANOVA). *p < 0.05, **p < 0.01, and ***p < 0.001 represent significant differences between the indicated columns, while NS represents no significant difference
Fig. 3
Fig. 3
Screening and identification of osteogenesis-related genes mediating metformin-enhanced osteogenic differentiation under high glucose. A Venn diagram showing the number of differentially expressed genes in PDLSCs when they were cultured in normal (CON), high glucose (HG) or high glucose with metformin addition (HG + MET) following a 14-day osteogenic induction. B Heatmap showing all the differentially expressed genes in PDLSCs when they were cultured in normal (CON), high glucose (HG) or high glucose with metformin addition (HG + MET) following a 14-day osteogenic induction. The color key (from purple to red) of Z-score value (− 1.95 to 2.77) indicated low to high expression levels. C Heatmap showing the osteogenesis-related genes in PDLSCs when they were cultured in normal (CON), high glucose (HG) or high glucose with metformin addition (HG + MET) following a 14-day osteogenic induction. The color key (from purple to red) of Z-score value (− 1.24 to 2.08) indicated low to high expression levels. D The statistical analysis of expressed levels of osteogenesis-related genes (AREG, IGFBP5, GPR68, SFRP2 and NPR3) in PDLSCs when they were cultured in normal, high glucose or high glucose with metformin addition following a 14-day osteogenic induction (mRNA expression levels detected by qRT-PCR). E Protein expression of SFRP2 and NPR3 in PDLSCs when they were cultured in normal, high glucose or high glucose with metformin addition following a 14-day osteogenic induction (protein expression levels detected by Western blot analysis). The displayed bands were cropped from the corresponding original blots. HG, high glucose. Met, metformin. Experiments for P4 cells from three different donors were repeated independently for at least 3 times, and data are presented as the means ± SD (n = 3). p value was based on one-way analysis of variance (one-way ANOVA). *p < 0.05, **p < 0.01, and ***p < 0.001 represent significant differences between the indicated columns, while NS represents no significant difference
Fig. 4
Fig. 4
Upregulation of NPR3 compromised the metformin-enhanced osteogenic differentiation of PDLSCs under high glucose. A Representative confocal images and quantitative analysis of natriuretic peptide receptor 3 (NPR3) in PDLSCs transfected with or without LV-NPR3 when they were cultured in normal, high glucose, or high glucose with metformin addition following a 14-day osteogenic induction (scale bar = 100 µm, ×200 magnification). B ALP staining and ALP activity assay of PDLSCs transfected with or without LV-NPR3 when they were cultured in normal, high glucose, or high glucose with metformin addition following a 7-day osteogenic induction (scale bar = 200 µm). C Alizarin Red staining and quantitative analysis of the stained calcium deposits formed by PDLSCs transfected with or without LV-NPR3 when they were cultured in normal, high glucose, or high glucose with metformin addition following a 21-day osteogenic induction (scale bar = 200 µm). HG, high glucose. Met, metformin. LV-NPR3, NPR3-overexpression lentivirus. Experiments for P4 cells from three different donors were repeated independently for at least 3 times, and data are presented as the means ± SD (n = 3). p value was based on one-way analysis of variance (one-way ANOVA). *p < 0.05, **p < 0.01, and ***p < 0.001 represent significant differences between the indicated columns, while NS represents no significant difference
Fig. 5
Fig. 5
Upregulation of NPR3 decreased the metformin-enhanced expression of osteoblast differentiation-related genes and proteins. AD Expression of osteoblast differentiation-related genes (ALP, RUNX2, BMP2 and OCN) in PDLSCs transfected with or without LV-NPR3 when they were cultured in normal, high glucose, or high glucose with metformin addition following a 14-day osteogenic induction (mRNA expression levels detected by qRT-PCR). EI Expression of osteoblast differentiation-related proteins (ALP, RUNX2, BMP2 and OCN) in PDLSCs transfected with or without LV-NPR3 when they were cultured in normal, high glucose, or high glucose with metformin addition following a 14-day osteogenic induction (protein expression levels detected by Western blot analysis). The displayed bands were cropped from the corresponding original blots. HG, high glucose. Met, metformin. LV-NPR3, NPR3-overexpression lentivirus. Experiments for P4 cells from three different donors were repeated independently for at least 3 times, and data are presented as the means ± SD (n = 3). p value was based on one-way analysis of variance (one-way ANOVA). *p < 0.05, **p < 0.01, and ***p < 0.001 represent significant differences between the indicated columns, while NS represents no significant difference
Fig. 6
Fig. 6
Metformin enhanced PDLSC osteogenic differentiation under high glucose via inhibition of the NPR3-mediated MAPK pathway. A Gene expression of C-type natriuretic peptide (CNP) in PDLSCs transfected with or without LV-NPR3 when they were cultured in normal, high glucose, or high glucose with metformin addition (mRNA expression levels detected by qRT-PCR). B Total CNP content in PDLSCs transfected with or without LV-NPR3 when they were cultured in normal, high glucose, or high glucose with metformin addition (total content in the cell culture supernates detected by ELISA). C, D Protein expression of MAPK pathway-related proteins (p38 MAPK, p-p38 MAPK, Erk1/2, p-Erk1/2, JNK, p-JNK) in PDLSCs transfected with or without LV-NPR3 when they were cultured in normal, high glucose, or high glucose with metformin addition (protein expression levels detected by Western blot analysis). The displayed bands were cropped from the corresponding original blots. HG, high glucose. Met, metformin. LV-NPR3, NPR3-overexpression lentivirus. Experiments for P4 cells from three different donors were repeated independently for at least 3 times, and data are presented as the means ± SD (n = 3). p value was based on one-way analysis of variance (one-way ANOVA). *p < 0.05, **p < 0.01, and ***p < 0.001 represent significant differences between the indicated columns, while NS represents no significant difference
Fig. 7
Fig. 7
Inhibition of the NPR3-mediated p38 MAPK or Erk1/2 pathway enhanced PDLSC osteogenic differentiation under glucose. A Expression of osteoblast differentiation-related genes (ALP, RUNX2, BMP2 and OCN) in PDLSCs transfected with or without LV-NPR3 when they were cultured in high glucose with metformin addition or high glucose with metformin and SB203580 addition following a 14-day osteogenic induction (mRNA expression levels detected by qRT-PCR). B Expression of osteoblast differentiation-related genes (ALP, RUNX2, BMP2 and OCN) in PDLSCs transfected with or without LV-NPR3 when they were cultured in high glucose with metformin addition or high glucose with metformin and U0126 addition following a 14-day osteogenic induction (mRNA expression levels detected by qRT-PCR). C Expression of osteoblast differentiation-related proteins (ALP, RUNX2, BMP2 and OCN) in PDLSCs transfected with or without LV-NPR3 when they were cultured in high glucose with metformin addition or high glucose with metformin and SB203580 addition following a 14-day osteogenic induction (protein expression levels detected by Western blot analysis). D Expression of osteoblast differentiation-related proteins (ALP, RUNX2, BMP2 and OCN) in PDLSCs transfected with or without LV-NPR3 when they were cultured in high glucose with metformin addition or high glucose with metformin and U0126 addition following a 14-day osteogenic induction (protein expression levels detected by Western blot analysis). The displayed bands were cropped from the corresponding original blots. HG, high glucose. Met, metformin. LV-NPR3, NPR3-overexpression lentivirus. SB203580, p38 MAPK pathway inhibitor. U0126, Erk1/2 pathway inhibitor. Experiments for P4 cells from three different donors were repeated independently for at least 3 times, and data are presented as the means ± SD (n = 3). p value was based on one-way analysis of variance (one-way ANOVA). *p < 0.05, **p < 0.01, and ***p < 0.001 represent significant differences between the indicated columns, while NS represents no significant difference
Fig. 8
Fig. 8
Schematic of the identified signaling molecules/pathways involved in the metformin-enhanced osteogenic differentiation of periodontal ligament stem cells under high glucose

Similar articles

Cited by

References

    1. Kinane DF. Causation and pathogenesis of periodontal disease. Periodontol. 2000;2001(25):8–20. - PubMed
    1. Sanz M, Del Castillo AM, Jepsen S, Gonzalez-Juanatey JR, D'Aiuto F, Bouchard P, et al. Periodontitis and cardiovascular diseases. Consensus report. Glob Heart. 2020;15(1):1. doi: 10.5334/gh.400. - DOI - PMC - PubMed
    1. Katz PP, Wirthlin MR, Jr, Szpunar SM, Selby JV, Sepe SJ, Showstack JA. Epidemiology and prevention of periodontal disease in individuals with diabetes. Diabetes Care. 1991;14(5):375–385. doi: 10.2337/diacare.14.5.375. - DOI - PubMed
    1. Lalla E, Papapanou PN. Diabetes mellitus and periodontitis: a tale of two common interrelated diseases. Nat Rev Endocrinol. 2011;7(12):738–748. doi: 10.1038/nrendo.2011.106. - DOI - PubMed
    1. Safkan-Seppala B, Ainamo J. Periodontal conditions in insulin-dependent diabetes mellitus. J Clin Periodontol. 1992;19(1):24–29. doi: 10.1111/j.1600-051X.1992.tb01144.x. - DOI - PubMed

Publication types

MeSH terms

Substances

LinkOut - more resources