. 2022 Nov 2;30(11):3430-3449.
doi: 10.1016/j.ymthe.2022.07.008. Epub 2022 Jul 16.

Engineered bispecific antibodies targeting the interleukin-6 and -8 receptors potently inhibit cancer cell migration and tumor metastasis

Affiliations

Engineered bispecific antibodies targeting the interleukin-6 and -8 receptors potently inhibit cancer cell migration and tumor metastasis

Huilin Yang et al. Mol Ther. .

Abstract

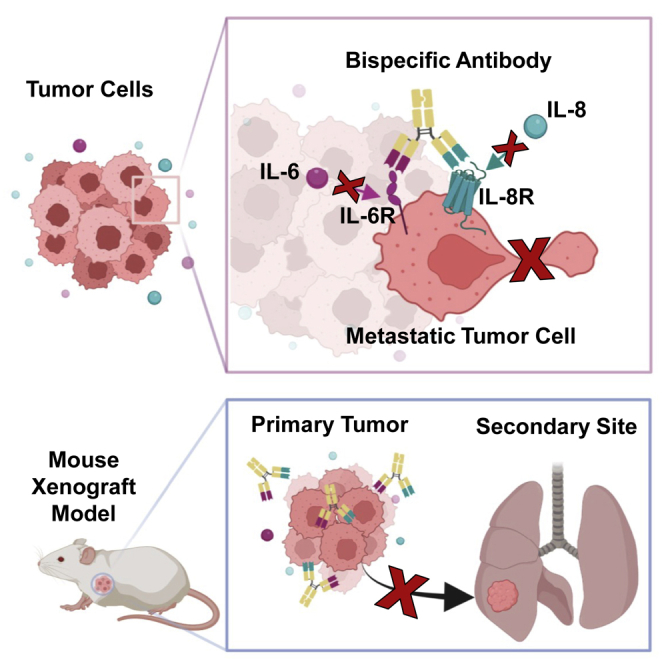
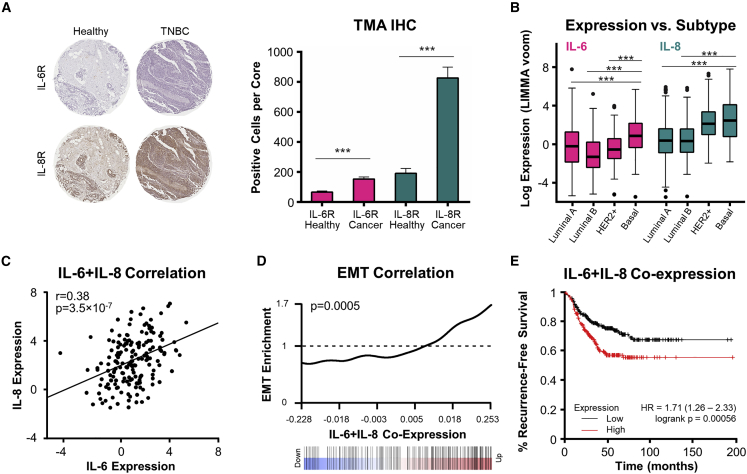
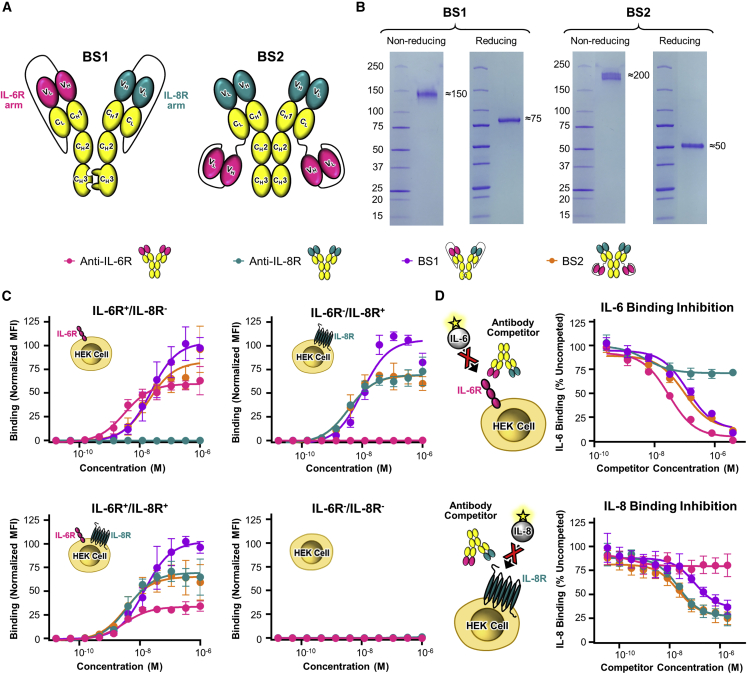
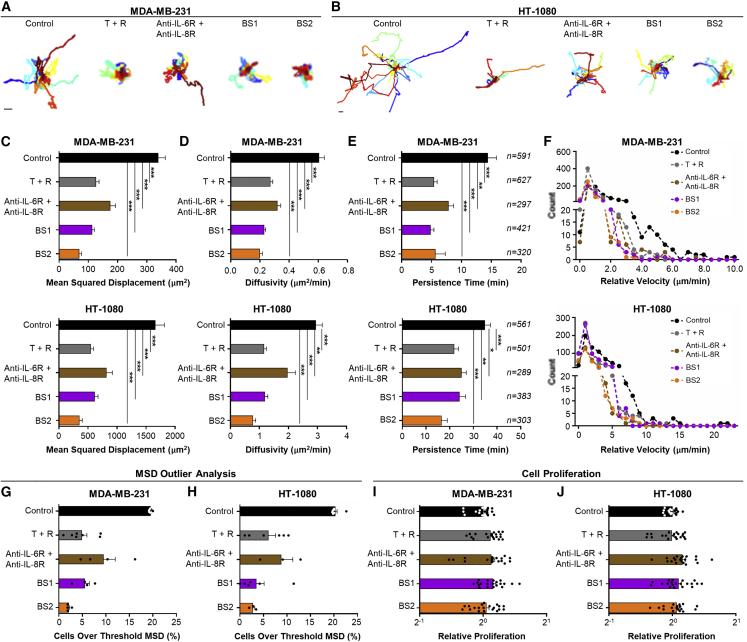
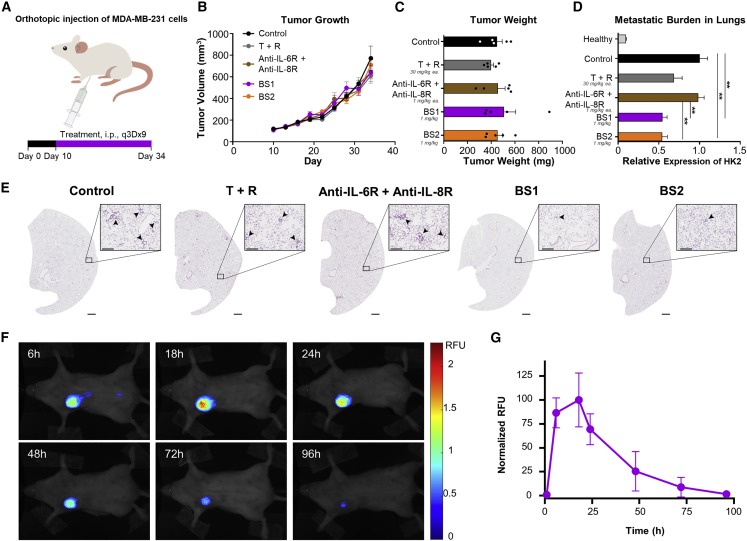
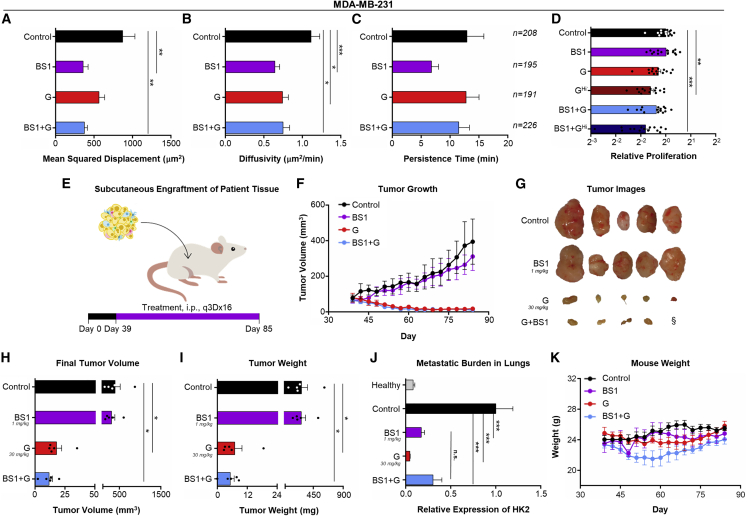
Simultaneous inhibition of interleukin-6 (IL-6) and interleukin-8 (IL-8) signaling diminishes cancer cell migration, and combination therapy has recently been shown to synergistically reduce metastatic burden in a preclinical model of triple-negative breast cancer. Here, we have engineered two novel bispecific antibodies that target the IL-6 and IL-8 receptors to concurrently block the signaling activity of both ligands. We demonstrate that a first-in-class bispecific antibody design has promising therapeutic potential, with enhanced selectivity and potency compared with monoclonal antibody and small-molecule drug combinations in both cellular and animal models of metastatic triple-negative breast cancer. Mechanistic characterization revealed that our engineered bispecific antibodies have no impact on cell viability, but profoundly reduce the migratory potential of cancer cells; hence they constitute a true anti-metastatic treatment. Moreover, we demonstrate that our antibodies can be readily combined with standard-of-care anti-proliferative drugs to develop effective anti-cancer regimens. Collectively, our work establishes an innovative metastasis-focused direction for cancer drug development.

Keywords: antibody; breast cancer; cell migration; interleukins; metastasis.


Conflict of interest statement

Declaration of interests The authors have filed intellectual property covering the technologies described herein. E.J.M., D.W., and J.B.S. are co-founders of AbMeta Therapeutics.

Figures

None
Graphical abstract
Figure 1
Figure 1
IL-6 and IL-8 receptors and ligands are upregulated in breast cancer tumors (A) IHC staining of IL-6 and IL-8 receptors on matched sequentially sectioned cores from human tissue microarrays (TMAs), with a representative triple-negative breast cancer (TNBC) sample (right) and representative healthy adjacent tissue sample (left). IL-6R- and IL-8R-positive cells were quantified for each TMA, using all breast cancer tissue cores and all healthy cores, revealing significantly higher IL-6R and IL-8R expression on tumor tissue (right). ∗∗∗p < 0.001 by unpaired two-tailed Student’s t test. Bar graph represents mean ± SEM (from left to right: n = 67, 119, 64, 115). (B) Boxplot depicting IL-6 and IL-8 expression in the indicated breast cancer subtypes, as reported in The Cancer Genome Atlas (TCGA). Significantly higher expression of ligands was observed in basal-like compared with luminal A and luminal B subtypes. p value was computed using the LIMMA RNA-seq pipeline. ∗∗∗p < 0.001. (C) Correlation between IL-6 and IL-8 expression in the basal-like breast cancer subtype. p values were computed with the LIMMA RNA-seq pipeline. (D) Barcode plot showing enrichment of epithelial-mesenchymal transition (EMT) pathway genes in IL-6 and IL-8 co-expressing basal-like breast cancer patient samples deposited in TCGA. False discovery rate adjusted p value is presented. (E) Kaplan-Meier recurrence-free survival plot for TNBC subtype (534 patients evaluated), grouped based on IL-6 and IL-8 co-expression. A median split was used to define high versus low IL-6 and IL-8 co-expression. Recurrence-free survival was defined as the length of time that the patient survived without any signs or symptoms of that cancer after the end of primary cancer treatment. Recurrence-free survival rates were significantly lower for patients with high expression levels of both IL-6 and IL-8. HR, hazard ratio.
Figure 2
Figure 2
Engineered bispecific antibodies simultaneously block IL-6:IL-6R and IL-8:IL-8R interactions (A) Schematics of two bispecific antibody formats (BS1 and BS2) targeting IL-6R (tocilizumab arm, magenta) and IL-8R (10H2 arm, teal). For BS1, the antibody heavy and light chains are connected by a long flexible linker and paired by knobs-into-holes mutations in the heavy chain constant domains. For BS2, a full-length antibody is fused to the single-chain variable fragment (scFv) of a second antibody. Variable and constant domains of the antibody heavy and light chains are labeled. (B) Non-reducing and reducing SDS-PAGE analyses of bispecific antibodies expressed in HEK 293F cells. (C) Flow-cytometry-based binding titrations of anti-IL-6R (tocilizumab), anti-IL-8R (10H2), BS1, and BS2 on IL-6R+/IL-8R, IL-6R/IL-8R+, IL-6R+/IL-8R+, and IL-6R/IL-8R HEK 293T cells demonstrated that engineered bispecific antibodies engage both IL-6R and IL-8R. (D) Top: flow-cytometry-based cell surface competition assays between soluble IL-6 cytokine and either anti-IL-6R, anti-IL-8R, BS1, or BS2 on IL-6R+/IL-8R HEK 293T cells revealed that bispecific antibodies block IL-6:IL-6R interaction. Bottom: flow-cytometry-based cell surface competition assays between soluble IL-8 cytokine and either anti-IL-6R, anti-IL-8R, BS1, or BS2 on IL-6R/IL-8R+ HEK 293T cells demonstrated that bispecific antibodies block IL-8:IL-8R interaction. All data represent mean ± SD (n = 3).
Figure 3
Figure 3
Bispecific antibodies significantly reduce in vitro cancer cell migration, without impacting proliferation (A and B) MDA-MB-231 cells (A) or HT-1080 cells (B) were suspended at 100 cells/μL in a 2 mg/mL type I collagen gel, then treated with either fresh medium (control), 150 nM tocilizumab plus reparixin at a 1:1 mass ratio (T + R), 150 nM anti-IL-6R (tocilizumab) plus 151 nM anti-IL-8R (10H2), 150 nM BS1, or 150 nM BS2. Cells from each condition were tracked for 12 h, and 16 randomly selected individual cell trajectories representative of each treatment condition are shown. Scale bar, 50 μm. (C–F) Analysis of MDA-MB-231 (top) and HT-1080 (bottom) cell migration. Mean squared displacement was calculated from the x,y coordinates of individual cell trajectories of cells, and diffusivity and persistence were calculated using the APRW model (total diffusivity and persistence time). The number of individual cells tracked per treatment group is noted on the right. (G and H) Outlier analysis was performed on each biological repeat for migration studies using MDA-MB-231 (G) or HT-1080 (H) cells, with six total biological repeats included for each cell line. (I and J) Relative proliferation of MDA-MB-231 (I) and HT-1080 (J) cells in collagen I gels, evaluated 48 h after the indicated treatment compared with the control condition. Dosing for each treatment matched that of migration studies described in (A) and (B). All data represent mean ± SEM. ∗p < 0.05; ∗∗p < 0.01; ∗∗∗p < 0.001, one-way ANOVA. For ease of visualization, only significance compared with the control cohort is shown in (C), (D), and (E). All p values are recorded in Table S10.
Figure 4
Figure 4
Bispecific antibodies perform better than combination treatments in a mouse model of TNBC (A) Illustration of mouse tumor xenograft study design and treatment schedule. NSG mice bearing orthotopic MDA-MB-231 TNBC xenografts were treated with either PBS (control), tocilizumab plus reparixin at a 1:1 mass ratio (T + R), anti-IL-6R (tocilizumab) plus anti-IL-8R (10H2), BS1, or BS2 (dosing as shown in figure; n = 5). Treatments were administered via intraperitoneal injection every 3 days beginning on day 10 for a total of nine injections (q3Dx9). (B) Tumor volume, as measured every 3 days throughout the study. (C) Tumor weight, as determined from resected tissue upon termination of the study. (D) qPCR analysis of human genomic content (HK2) in the lungs of each mouse relative to the PBS-treated control group. Bispecific antibody treatment led to significantly reduced metastatic burden in the lungs. qPCR was performed a minimum of three times using unique DNA, with three technical repeats per plate. All data represent mean ± SEM. ∗∗p < 0.01, one-way ANOVA. (E) Representative images of H&E-stained lung sections from each treatment cohort. Scale bars for full sections represent 1 mm, and scale bars for higher magnification pictograms illustrating micrometastases represent 200 μm. (F) Representative images of mice bearing MDA-MB-231 orthotopic xenograft at the indicated time point after intravenous injection of 1 mg/kg infrared dye-labeled BS1. (G) Quantification of total fluorescence intensity at each time point after injection. All data represent mean ± SD (n = 3). All p values are recorded in Table S10.
Figure 5
Figure 5
Engineered bispecific antibody complements standard-of-care cytotoxic therapy (A–C) MDA-MB-231 cells were suspended at 100 cells/μL in a 2 mg/mL type I collagen gel, then treated with either fresh medium (control), 150 nM BS1, 86 μM gemcitabine (G), or BS1 plus gemcitabine (BS1 + G). Mean squared displacement (A), total diffusivity (B), and persistence (C) calculated from tracked cells in each treatment group are presented. (D) Relative proliferation of MDA-MB-231 cells in collagen I gels treated with BS1, G, or BS1 + G for 48 h. Gemcitabine was used at a dose of either 86 μM (G) or 300 μM (GHi). All panels represent a minimum of three biological repeats per condition. (E) Illustration of patient-derived xenograft (PDX) tumor study design and treatment schedule. NSG mice with subcutaneous TNBC patient-derived tumor fragments engrafted at the flank of the animal were treated with either PBS (control), BS1, G, or BS1 + G (dosing as shown in figure; n = 5). Treatments were administered via intraperitoneal injection every 3 days beginning on day 39 for a total of 16 injections (q3Dx16). (F) Tumor volume, as measured every 3 days for the study duration. (G) Scaled pictures of the excised subcutaneous tumors from all treatment groups. Scale bar, 5 mm. §One tumor in the BS1 + G cohort was indistinguishable from the surrounding tissue and could not be isolated. (H) Final tumor volume, as measured from resected tumors. (I) Tumor weight, as determined from resected tissue upon termination of the study. (J) qPCR analysis of human genomic content (HK2) in the lungs of each mouse relative to the PBS-treated control group. qPCR was performed a minimum of three times using unique DNA, with three technical repeats per plate. (K) Mouse weight, as recorded every 3 days throughout the study. Cohorts that included G showed significantly reduced tumor growth, and cohorts that included BS1 showed significantly decreased metastatic burden in the lungs. All data represent mean ± SEM. ∗p < 0.05; ∗∗p < 0.01; ∗∗∗p < 0.001, one-way ANOVA. All p values are recorded in Table S10.

Similar articles

Cited by

References

    1. Weinberg R.A. W. W. Norton & Company; 2013. The Biology of Cancer.
    1. Steeg P.S. Targeting metastasis. Nat. Rev. Cancer. 2016;16:201–218. - PMC - PubMed
    1. Siegel R.L., Miller K.D., Fuchs H.E., Jemal A. Cancer statistics, 2021. Cancer J. Clin. 2021;71:7–33. - PubMed
    1. Budczies J., von Winterfeld M., Klauschen F., Bockmayr M., Lennerz J.K., Denkert C., Wolf T., Warth A., Dietel M., Anagnostopoulos I., et al. The landscape of metastatic progression patterns across major human cancers. Oncotarget. 2015;6:570–583. - PMC - PubMed
    1. Yao Y., Chu Y., Xu B., Hu Q., Song Q. Risk factors for distant metastasis of patients with primary triple-negative breast cancer. Biosci. Rep. 2019;39 BSR20190288. - PMC - PubMed

Publication types

LinkOut - more resources