

Altitude-adaption of gut microbiota in Tibetan chicken
- PMID: 35841636
- PMCID: PMC9293635
- DOI: 10.1016/j.psj.2022.101998
Altitude-adaption of gut microbiota in Tibetan chicken
Abstract
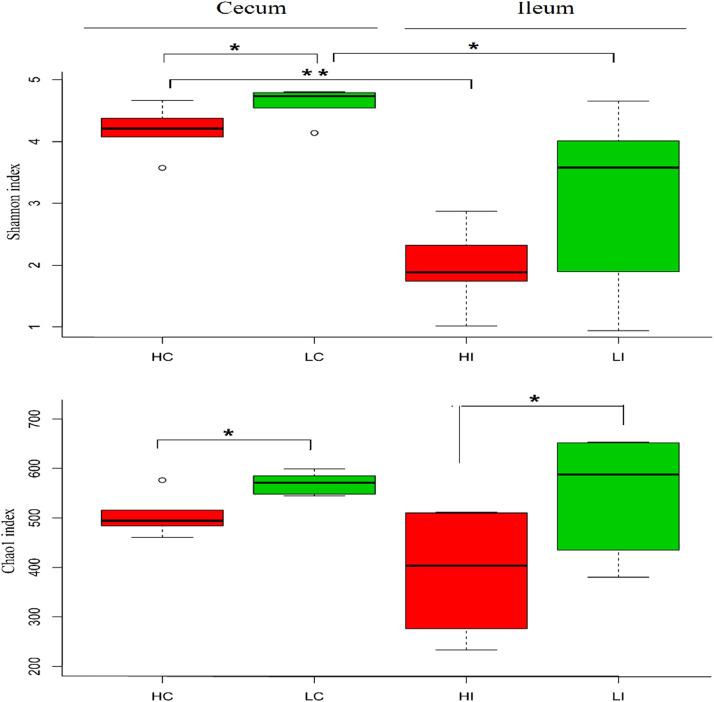
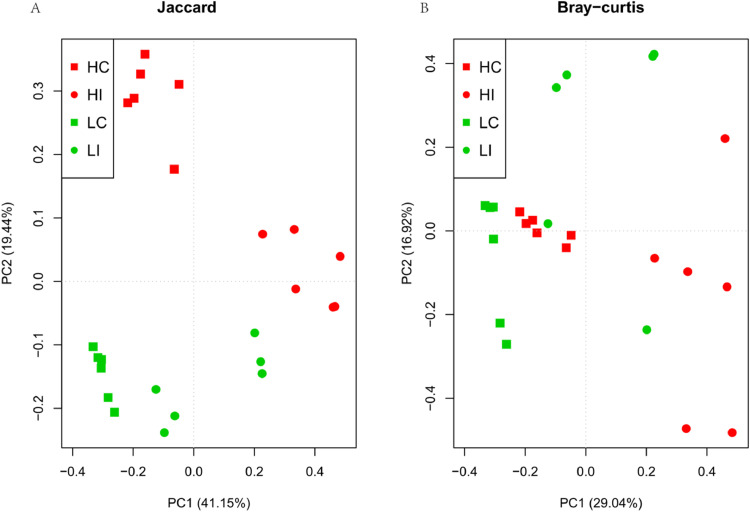
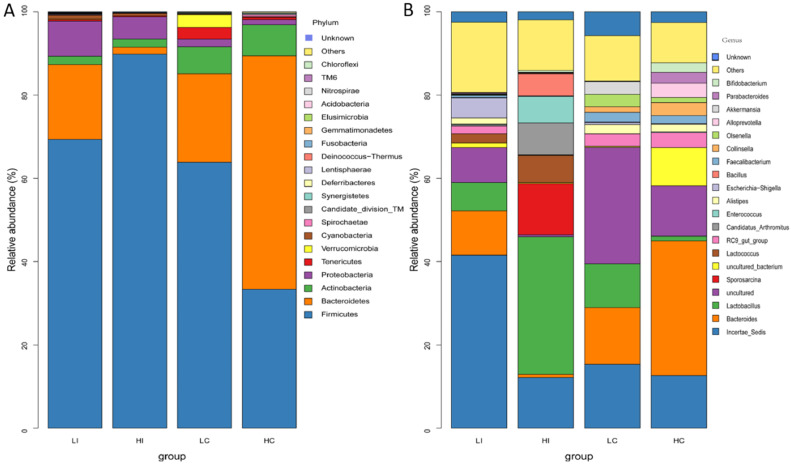
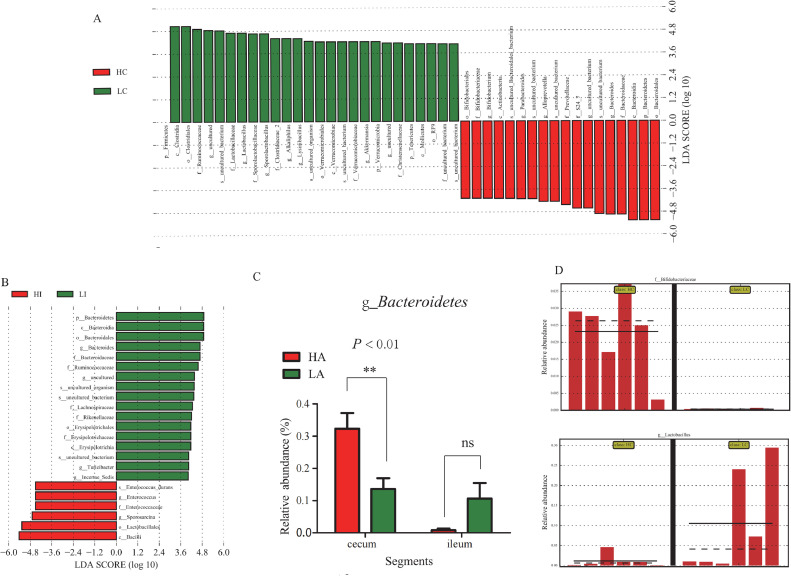
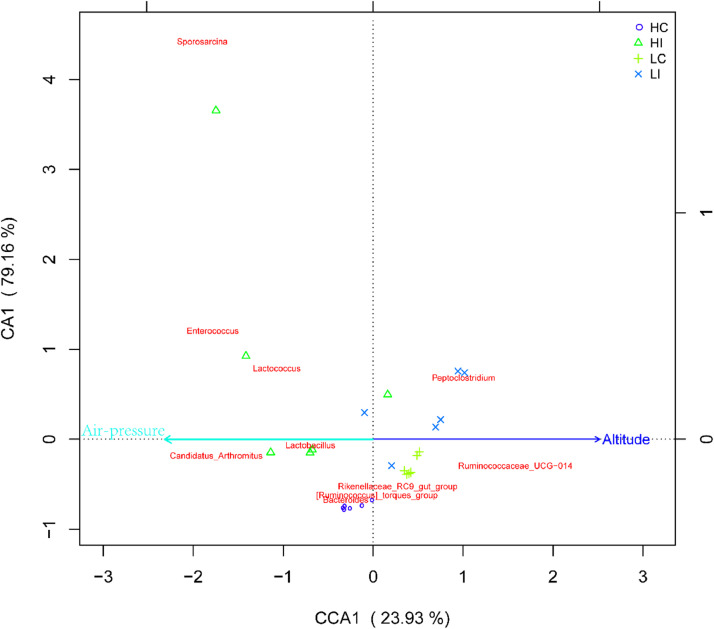
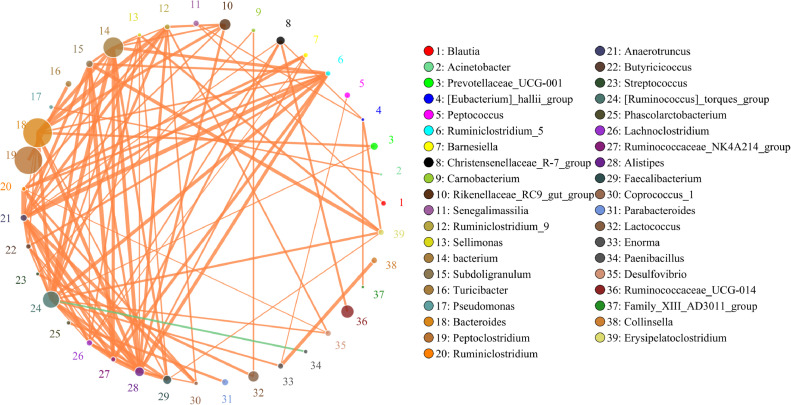
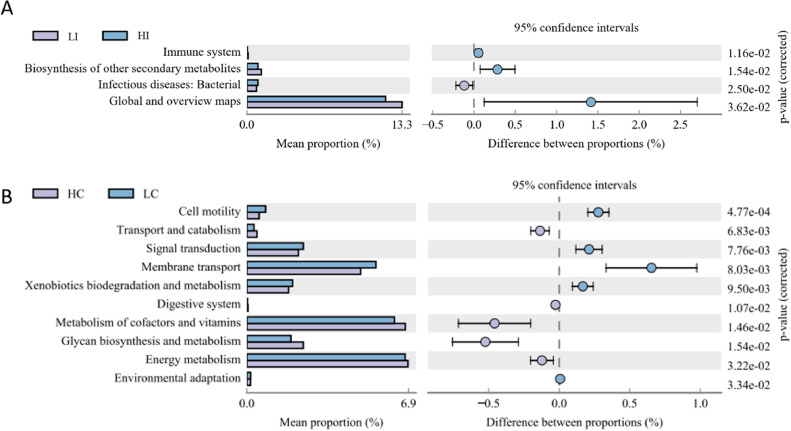
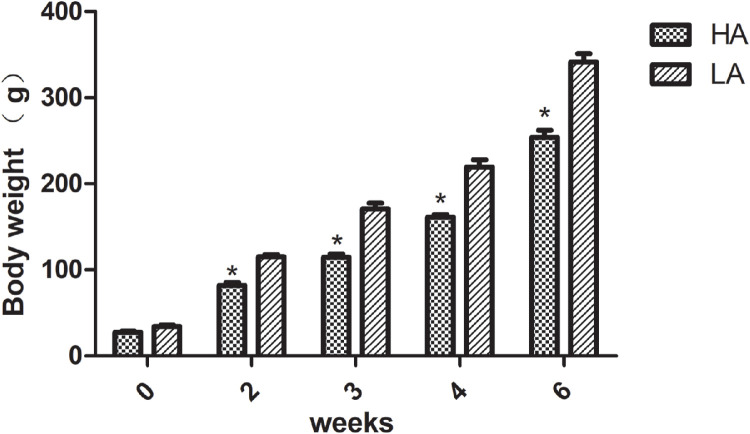
Low oxygen levels and extremely cold weather in high-altitude environments requires more energy intake to maintain body temperature in animals. However, little is known about the characteristics of cecal and ileac microbiota in Tibetan chicken and how the high and low altitude environments affect the gut microbiota communities in Tibetan chicken. In the present study, In the present study, Tibetan chickens (Group HA, 3572 m, 578.5 Pa) and their introduced flatland counterparts (Group LA, 580 m, 894.6 Pa) in the cecum and ileum to identify the possible bacterial species that are helpful for their host in environmental adaption. High-throughput sequencing was used to sequence the V3 to V4 hypervariable regions of the bacterial 16S rRNA gene. By comparing the gut microbial diversity of HA chicken with that of LA, the results indicated that the microbial diversity of the cecum and ileum in group HA was significantly lower (P < 0.05) than those in group LA. The cecum microbiome maintained higher population diversity and richness than the ileum (P < 0.05). Four phyla Firmicutes, Bacterioidetes, Actinobacteria, and Proteobacteria were dominant in two groups. Interestingly, there were significant differences in abundance ratio among the four groups (P < 0.05). The predominant bacteria in HA and LA ileum belong to Proteobacteria and Firmicutes, whereas in cecum, Bacterioidetes and Actinobacteria were predominant in both groups (P < 0.05). Correlation analysis showed that Sporosarcina, Enterococcus, and Lactococcus were strongly related to air pressure, and Peptoclostridium and Ruminococcaceae_UCG-014 are related to altitude and gut microbiota of LA group was influenced by altitude, while HA group affected by air pressure. Meanwhile, the Ruminococcus-torques-group was negatively correlated with the relative abundance of Paenibacillus, and positive correlated with those of other microorganisms. Furthermore, HA has higher abundance of microbiota involved in energy and glycan biosynthesis metabolism pathway, while LA has higher abundance of microbiota involved in membrane transport, signal transduction, and xenobiotics biodegradation and metabolism. Generally, our results suggested that the composition and diversity of gut microbes changed after Tibetan chickens were introduced to the plain. Tibetan chicken may adapt to new environment via reshaping the gut microbiota. Gut microbes may contribute to the host adaption to high altitude environments by increasing host energy and glycan biosynthesis.
Keywords: 16S rRNA; Tibetan chicken; environment; gut microbiota; high-altitude adaption.
Copyright © 2022 The Authors. Published by Elsevier Inc. All rights reserved.
Figures
Similar articles
-
Cecal microbiota of Tibetan Chickens from five geographic regions were determined by 16S rRNA sequencing.Microbiologyopen. 2016 Oct;5(5):753-762. doi: 10.1002/mbo3.367. Epub 2016 May 2. Microbiologyopen. 2016. PMID: 27139888 Free PMC article.
-
Unraveling the gut microbiota of Tibetan chickens: insights into highland adaptation and ecological advantages.Microbiol Spectr. 2024 Nov 5;12(11):e0051924. doi: 10.1128/spectrum.00519-24. Epub 2024 Sep 30. Microbiol Spectr. 2024. PMID: 39345125 Free PMC article.
-
Gut microbiota in two chickens' breeds: Characteristics and dynamic changes.Microb Pathog. 2024 Dec;197:107101. doi: 10.1016/j.micpath.2024.107101. Epub 2024 Nov 2. Microb Pathog. 2024. PMID: 39491567
-
The role of gut microbiota on cognitive development in rodents: a meta-analysis.J Physiol Sci. 2023 May 16;73(1):10. doi: 10.1186/s12576-023-00869-1. J Physiol Sci. 2023. PMID: 37193943 Free PMC article. Review.
-
The Gut Microbiota Profile in Heart Failure Patients: A Systematic Review.J Gastrointestin Liver Dis. 2023 Sep 29;32(3):393-401. doi: 10.15403/jgld-4779. J Gastrointestin Liver Dis. 2023. PMID: 37774217
Cited by
-
High-altitude and low-altitude adapted chicken gut-microbes have different functional diversity.Sci Rep. 2023 Nov 27;13(1):20856. doi: 10.1038/s41598-023-48147-9. Sci Rep. 2023. PMID: 38012260 Free PMC article.
-
Gut Microbial Adaptation to Varied Altitudes and Temperatures in Tibetan Plateau Yaks.Microorganisms. 2024 Jul 1;12(7):1350. doi: 10.3390/microorganisms12071350. Microorganisms. 2024. PMID: 39065118 Free PMC article.
-
Reciprocal translocation experiments reveal gut microbiome plasticity and host specificity in a Qinghai-Xizang Plateau lizard.Zool Res. 2025 Jan 18;46(1):139-151. doi: 10.24272/j.issn.2095-8137.2024.284. Zool Res. 2025. PMID: 39846192 Free PMC article.
-
Combined transcriptome and metabolome analysis reveals breed-specific regulatory mechanisms in Dorper and Tan sheep.BMC Genomics. 2024 Jan 17;25(1):70. doi: 10.1186/s12864-023-09870-9. BMC Genomics. 2024. PMID: 38233814 Free PMC article.
-
Effect of Ascites Syndrome on Diversity of Cecal Microbiota of Broiler Chickens.Vet Sci. 2025 Feb 5;12(2):126. doi: 10.3390/vetsci12020126. Vet Sci. 2025. PMID: 40005886 Free PMC article.
References
-
- Adak A., Maity C., Ghosh K., Pati B.R., Mondal K.C. Dynamics of predominant microbiota in the human gastrointestinal tract and change in luminal enzymes and immunoglobulin profile during high-altitude adaptation. Folia. Microbiol. 2013;58:523–528. - PubMed
-
- Bae J.Y., Kim K.Y., Kim J.H., Lee K., Cho J.C., Cha C.J. Paenibacillus aestuarii sp. nov., isolated from an estuarine wetland. Int. J. Syst. Evol. Microbiol. 2010;60:644–647. - PubMed
-
- Bai S.P., Wu A.M., Ding X.M., Lei Y., Bai J., Zhang K.Y., Chio J.S. Effects of probiotic-supplemented diets on growth performance and intestinal immune characteristics of broiler chickens. Poult. Sci. 2013;92:663–670. - PubMed
-
- Bueno I., Williams J.N., Hwang H., Sargeant J.M., Nault A.J., Singer R.S. Impact of point sources on antibiotic resistance genes in the natural environment: a systematic review of the evidence. Anim. Health. Res. Rev. 2017;18:112–127. - PubMed
MeSH terms
Substances
LinkOut - more resources
Full Text Sources
