. 2022 Aug;298(8):102259.
doi: 10.1016/j.jbc.2022.102259. Epub 2022 Jul 14.

The airway smooth muscle sodium/calcium exchanger NCLX is critical for airway remodeling and hyperresponsiveness in asthma

Affiliations

The airway smooth muscle sodium/calcium exchanger NCLX is critical for airway remodeling and hyperresponsiveness in asthma

Martin T Johnson et al. J Biol Chem. 2022 Aug.

Abstract

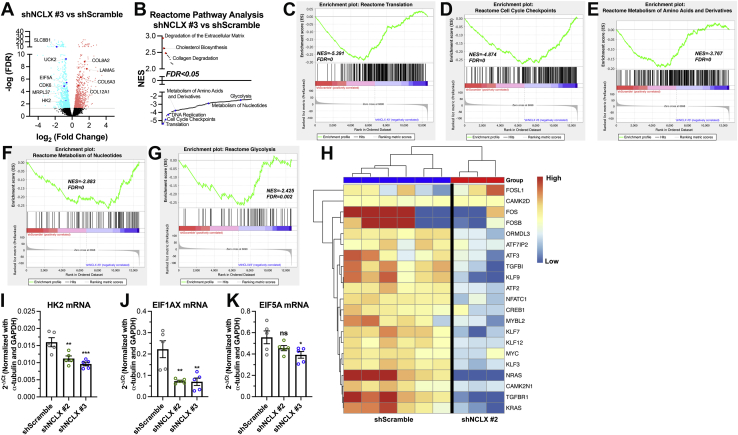
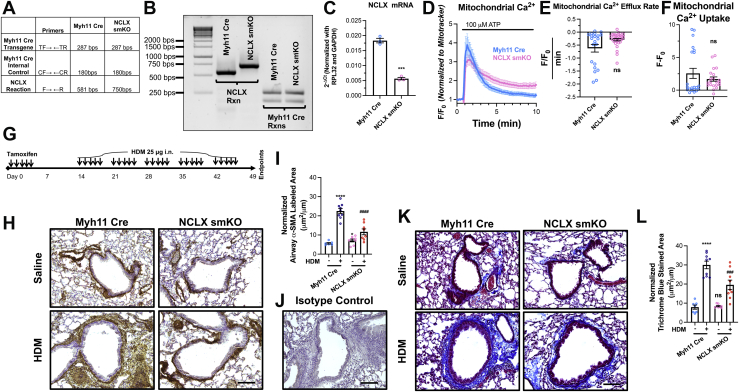
The structural changes of airway smooth muscle (ASM) that characterize airway remodeling (AR) are crucial to the pathogenesis of asthma. During AR, ASM cells dedifferentiate from a quiescent to a proliferative, migratory, and secretory phenotype. Calcium (Ca2+) is a ubiquitous second messenger that regulates many cellular processes, including proliferation, migration, contraction, and metabolism. Furthermore, mitochondria have emerged as major Ca2+ signaling organelles that buffer Ca2+ through uptake by the mitochondrial Ca2+ uniporter and extrude it through the Na+/Ca2+ exchanger (NCLX/Slc8b1). Here, we show using mitochondrial Ca2+-sensitive dyes that NCLX only partially contributes to mitochondrial Ca2+ extrusion in ASM cells. Yet, NCLX is necessary for ASM cell proliferation and migration. Through cellular imaging, RNA-Seq, and biochemical assays, we demonstrate that NCLX regulates these processes by preventing mitochondrial Ca2+ overload and supporting store-operated Ca2+ entry, activation of Ca2+/calmodulin-dependent kinase II, and transcriptional and metabolic reprogramming. Using small animal respiratory mechanic measurements and immunohistochemistry, we show that smooth muscle-specific NCLX KO mice are protected against AR, fibrosis, and hyperresponsiveness in an experimental model of asthma. Our findings support NCLX as a potential therapeutic target in the treatment of asthma.

Keywords: CaMKII; NCLX; SOCE; airway fibrosis; airway hyperresponsiveness; airway remodeling; asthma; calcium signaling; metabolism; mitochondrial calcium.


Conflict of interest statement

Conflict of interest The authors declare that they have no conflicts of interest with the contents of this article.

Figures

Figure 1
Figure 1
NCLX regulates SOCE in HASMCs.A, quantification of NCLX mRNA expression in shScramble (n = 3), shNCLX #2 (n = 3), and shNCLX #3 (n = 3) HASMCs using RT–qPCR (one-way ANOVA, F[2,6] = 59.18, p = 0.0001, with Dunnett’s post hoc test, p = 0.0003 for shNCLX #2 and p = 0.0001 for shNCLX #3). B, mitochondrial Ca2+ measurements in response to 500 nM bradykinin in the presence of 2 mM Ca2+ in shScramble (black trace) (n = 59), shNCLX #2 (green trace) (n = 39), and shNCLX #3 (blue trace) (n = 39) HASMCs. Mitochondrial Ca2+ is measured by dividing the fluorescence of Rhod-2 by MitoTracker Green. C, quantification of basal mitochondrial Ca2+ in the absence of agonist stimulation using Rhod-2/MitoTracker Green fluorescence (one-way ANOVA, F[2537] = 1151, p < 0.0001, with Dunnett’s post hoc test, p < 0.0001 for shNCLX #2 and p < 0.0001 for shNCLX #3). Quantification of (D) mitochondrial Ca2+ efflux rate (one-way ANOVA, Kruskal–Wallis statistic = 7.321, p = 0.0269, with Dunn’s post hoc test, p = 0.1174 for shNCLX #2 and p = 0.0244 for shNCLX #3) and (E) mitochondrial Ca2+ uptake (one-way ANOVA, Kruskal–Wallis statistic = 4.870, p = 0.0876, with Dunn’s post hoc test, p = 0.0578 for shNCLX #2 and p > 0.9999 for shNCLX #3) from B. F, cytosolic Ca2+ measurements using the standard Ca2+ off/Ca2+ on protocol with 2 μM thapsigargin in shScramble (black trace) (n = 95), shNCLX #2 (green trace) (n = 109), and shNCLX #3 (blue trace) (n = 103) HASMCs. G, quantification of maximal Ca2+ entry from E (one-way ANOVA, F[2304] = 6.096, p = 0.0025, with Dunnett’s post hoc test, p < 0.0013 for shNCLX #2 and p = 0.0446 for shNCLX #3). H, representative Western blots showing MCU protein expression in HASMCs transfected with shScramble and two NCLX shRNA (shNCLX #2 and shNCLX #3). (Note that the α-tubulin blot in H was reused for the α-tubulin blot for Figure 5C. The molecular weights for MCU and HIF1α were far enough to allow cutting and separate immunoblotting from the same blot). I, quantification of MCU protein levels in shScramble (n = 3), shNCLX #2 (n = 3), and shNCLX #3 (n = 3) HASMCs from H using densitometry normalized to α-tubulin (one-way ANOVA, F[2,6] = 0.1683, p = 0.8490, with Dunnett’s post hoc test, p = 0.9106 for shNCLX #2 and p = 0.7975 for shNCLX #3). J, representative Western blot showing STIM1, STIM2, and Orai1 protein expression in shScramble, shNCLX #2, and shNCLX #3 HASMCs. Quantification of (K) STIM1 (one-way ANOVA, F[2,9] = 0.7429, p = 0.5028, with Dunnett’s post hoc test, p = 0.8524 for shNCLX #2 and p = 0.4093 for shNCLX #3), (L) STIM2 (one-way ANOVA, F[2,6] = 0.1205, p = 0.8885, with Dunnett’s post hoc test, p = 0.9879 for shNCLX #2 and p = 0.8538 for shNCLX #3), and (M) Orai1 (one-way ANOVA, F[2,6] = 0.4989, p = 0.6304, with Dunnett’s post hoc test, p = 0.5532 for shNCLX #2 and p = 0.9385 for shNCLX #3) protein expression from C in shScramble (n = 3), shNCLX #2 (n = 3), and shNCLX #3 (n = 3) HASMCs using densitometry normalized to α-tubulin. Quantification of (N) Orai2 (one-way ANOVA, F[2,12] = 1.375, p = 0.2899, with Dunnett’s post hoc test, p = 0.4641 for shNCLX #2 and p = 0.2198 for shNCLX #3) and (O) Orai3 (one-way ANOVA, F[2,12] = 1.375, p = 0.2899, with Dunnett’s post hoc test, p = 0.4641 for shNCLX #2 and p = 0.2198 for shNCLX #3) mRNA expression in shScramble (n = 5), shNCLX #2 (n = 5), and shNCLX #3 (n = 5) HASMCs using RT–qPCR. ∗p < 0.05, ∗∗p < 0.01, ∗∗∗p < 0.001, and ns. HASMC, human airway smooth muscle cell; HIF1α, hypoxia-inducible factor 1α; MCU, mitochondrial Ca2+ uniporter; NCLX, Na+/Ca2+ exchanger; ns, not significant; qPCR, quantitative PCR; SOCE, store-operated Ca2+ entry.
Figure 2
Figure 2
NCLX is essential for proliferation, migration, and apoptosis in HASMCs.A, representative bright field images of HASMC migration at 0, 12, and 24 h in shScramble (n = 13), shNCLX #2 (n = 15), and shNCLX #3 (n = 14) HASMCs. The scale bar represents 500 μm. B, quantification of HASMC migration from A (for 12 h: one-way ANOVA, F[2,39] = 7.907, p = 0.0013, with Dunnett’s post hoc test, p = 0.0013 for shNCLX #2 and p = 0.0056 for shNCLX #3; for 24 h: one-way ANOVA, F[2,64] = 12.24, p < 0.0001, with Dunnett’s post hoc test, p = 0.0004 for shNCLX #2 and p < 0.0001 for shNCLX #3). C, quantification of normalized relative fluorescent units (RFUs) of proliferation from shScramble (black trace) (n = 6), shNCLX #2 (green trace) (n = 6), and shNCLX #3 (blue trace) (n = 6) HASMCs over 72 h (two-way ANOVA: interaction F[6,75] = 2.441, p = 0.0329; row factor F[3,75] = 70.00, p < 0.0001; column factor F[2,75] = 7.147, p = 0.0014; for Dunnett’s post hoc test, 24 h: p = 0.9966 for shNCLX #2 and p = 0.3135 for shNCLX #3, 48 h: p = 0.1135 for shNCLX #2 and p = 0.1774 for shNCLX #3, and 72 h: p = 0.0003 for shNCLX #2 and p = 0.0015 for shNCLX #3. D, representative flow cytometry dot plots of costaining for 7-AAD and annexin V in shScramble, shNCLX #2, and shNCLX #3 HASMCs. E, quantification of percent of cells in early apoptosis (quadrant 3) (one-way ANOVA, F[2,6] = 2.737, p = 0.1430, with Dunnett’s post hoc test, p = 0.1243 for shNCLX #2 and p = 0.9278 for shNCLX #3), late apoptosis (quadrant 2) (one-way ANOVA, F[2,6] = 17.02, p = 0.0034, with Dunnett’s post hoc test, p = 0.0075 for shNCLX #2 and p = 0.0028 for shNCLX #3), and total apoptosis (quadrant 2 + 3) (one-way ANOVA, F[2,6] = 6.971, p = 0.0272, with Dunnett’s post hoc test, p = 0.1373 for shNCLX #2 and p = 0.0174 for shNCLX #3) in shScramble (n = 3), shNCLX #2 (n = 3), and shNCLX #3 (n = 3) HASMCs from flow cytometry dot plots in D. ∗p < 0.05, ∗∗p < 0.01, ∗∗∗p < 0.001, ∗∗∗∗p < 0.0001, and ns. 7-AAD, 7-aminoactinomycin D; HASMC, human airway smooth muscle cell; Na+/Ca2+ exchanger; ns, not significant.
Figure 3
Figure 3
NCLX regulates the expression of genes involved in proliferation, metabolism, and translation.A, volcano plot comparing differentially expressed genes between shScramble and shNCLX #2 HASMCs. B, pathway analysis of A using the Reactome pathways gene set ranking significantly upregulated (red) and downregulated (blue) pathways based on normalized enrichment score (NES). Heatmaps comparing differential expression of shScramble and shNCLX #2 HASMCs for (C) translation, (D) glycolysis, and (E) cell cycle checkpoints from the Reactome pathway gene sets. F, GSEA enrichment plots using the Reactome pathways gene set comparing shNCLX #3 and shScramble HASMCs showing a positive correlation in the enrichment of degradation of the extracellular matrix. Quantification of (G) LAMA5 (one-way ANOVA, F[2,15] = 1.024, p = 0.3829, with Dunnett’s post hoc test, p = 0.8873 for shNCLX #2 and p = 0.5273 for shNCLX #3) and (H) COL15A1 (one-way ANOVA, F[2,12] = 2.069, p = 0.1690, with Dunnett’s post hoc test, p = 0.1409 for shNCLX #2 and p = 0.9244 for shNCLX #3) mRNA expression in shScramble (n = 5), shNCLX #2 (n = 5), and shNCLX #3 (n = 5) HASMCs using RT–quantitative PCR. GSEA, gene set enrichment analysis; HASMC, human airway smooth muscle cell; NCLX, Na+/Ca2+ exchanger; ns, not significant.
Figure 4
Figure 4
NCLX regulates the expression of transcription factors and metabolic genes.A, volcano plot comparing differentially expressed genes between shScramble and shNCLX #3 HASMCs. Genes are plotted by log2 fold change and −log10 false discovery rate (FDR), with a threshold of an FDR <0.05 (dotted black line). In the shNCLX #3 samples, significantly upregulated and downregulated genes are light red and light blue, respectively. B, pathway analysis of A using the Reactome pathways gene set ranking significantly upregulated (red) and downregulated (blue) pathways based on normalized enrichment score (NES). CH, GSEA enrichment plots using the Reactome pathways gene set comparing shNCLX #3 and shScramble HASMCs showing a negative correlation in the enrichment of (C) translation, (D) cell cycle checkpoints, (E) metabolism of amino acids and derivatives, (F) metabolism of nucleotides, and (G) glycolysis. For each GSEA enrichment plot, NES and FDR values are displayed. H, heatmap comparing expression of select genes from RNA sequencing of shScramble and shNCLX#2 HASMCs. Quantification of (I) HK2 (one-way ANOVA, F[2,12] = 12.51, p = 0.0012, with Dunnett’s post hoc test, p = 0.0067 for shNCLX #2 and p = 0.0008 for shNCLX #3), (J) EIF1AX (one-way ANOVA, F[2,12] = 12.00, p = 0.0014, with Dunnett’s post hoc test, p = 0.0023 for shNCLX #2 and p = 0.0020 for shNCLX #3), (K) and EIF5A (one-way ANOVA, F[2,12] = 3.952, p = 0.0480, with Dunnett’s post hoc test, p = 0.1895 for shNCLX #2 and p = 0.0300 for shNCLX #3), mRNA expression in shScramble (n = 5), shNCLX #2 (n = 5), and shNCLX #3 (n = 5) HASMCs using RT–quantitative PCR. ∗p < 0.05, ∗∗p < 0.01, ∗∗∗p < 0.001, and ns. GSEA, gene set enrichment analysis; HASMC, human airway smooth muscle cell; HK2, hexokinase 2; NCLX, Na+/Ca2+ exchanger; ns, not significant.
Figure 5
Figure 5
Abrogation of NCLX enhances mitophagy in HASMCs.A, heatmap comparing abundance of statistically significant metabolites in shScramble and shNCLX #3 HASMCs. B, quantification of TMRE (membrane potential dye) median fluorescence intensity (MFI) of shScramble (n = 10), shNCLX #2 (n = 10), shNCLX #3 (n = 10), shScramble + 100 μM FCCP (n = 6) in HASMCs using flow cytometry (one-way ANOVA, F[3,32] = 13.70, p < 0.0001, with Dunnett’s post hoc test, p = 0.0374 for shNCLX #2, p = 0.0051 for shNCLX #3, and p < 0.0001 for FCCP). C, representative Western blot showing HIF1α protein expression in shScramble, shNCLX #2, and shNCLX #3 HASMCs. (Note that the α-tubulin blot for Figure 1H was reused for the α-tubulin blot in Figure 5C. The molecular weights for MCU and HIF1α were far enough to allow cutting and separate immunoblotting from the same blot). D, quantification of HIF1α (one-way ANOVA, F[2,9] = 1.67, p = 0.2406, with Dunnett’s post hoc test, p > 0.9999 for shNCLX #2 and p = 0.2471 for shNCLX #3) protein expression from C in shScramble (n = 4), shNCLX #2 (n = 4), and shNCLX #3 (n = 4) HASMCs using densitometry normalized to α-tubulin. E, representative Western blot showing p62 and LC3 protein expression in shScramble, shNCLX #2, and shNCLX #3 HASMCs. Quantification of (F) LC3II (one-way ANOVA, F[2,9] = 5.023, p = 0.0343, with Dunnett’s post hoc test, p = 0.0436 for shNCLX #2 and p = 0.0378 for shNCLX #3) and (G) p62 (one-way ANOVA, F[2,6] = 35.72, p = 0.0005, with Dunnett’s post hoc test, p = 0.0011 for shNCLX #2 and p = 0.0004 for shNCLX #3) protein expression from A in shScramble (n = 3), shNCLX #2 (n = 3), and shNCLX #3 (n = 3) HASMCs using densitometry normalized to GAPDH and α-tubulin. ∗p < 0.05, ∗∗p < 0.01, ∗∗∗p < 0.001, ∗∗∗∗p < 0.0001, and ns. FCCP, carbonyl cyanide-4-(trifluoromethoxy)phenylhydrazone; HASMC, human airway smooth muscle cell; HIF1α, hypoxia-inducible factor 1α; LC3II, light chain 3II; MCU, mitochondrial Ca2+ uniporter; NCLX, Na+/Ca2+ exchanger; ns, not significant; TMRE, tetramethylrhodamine, ethyl ester.
Figure 6
Figure 6
Loss of NCLX leads to reduced size and number of mitochondria in HASMCs.A, representative transmission electron microcopy (TEM) images of shScramble, shNCLX #2, and shNCLX #3 HASMCs. Last images on right are zoomed insets. (The scale bar represents 1 and 5 μm for larger images and zoomed insets, respectively). Red arrows point to mitochondria with altered structure. Using TEM, quantification of the (B) mitochondrial area (one-way ANOVA, F[2199] = 7.330, p = 0.0008, with Dunnett’s post hoc test, p = 0.0020 for shNCLX #2 and p = 0.0087 for shNCLX #3), and (C) mitochondrial perimeter (one-way ANOVA, F[2199] = 9.871, p < 0.0001, with Dunnett’s post hoc test, p = 0.0013 for shNCLX #2 and p = 0.0004 for shNCLX #3), from shScramble (n = 99), shNCLX #2 (n = 65), and shNCLX #3 (n = 38) HASMCs. D, quantification of the mitochondrial density or number of mitochondria per μm2 of cytoplasmic area of micrographs from shScramble (n = 13), shNCLX #2 (n = 13), and shNCLX #3 (n = 11) HASMCs (one-way ANOVA, F[2,34] = 5.175, p = 0.0109, with Dunnett’s post hoc test, p = 0.0399 for shNCLX #2 and p = 0.0090 for shNCLX #3). E, quantification of median fluorescence intensity (MFI) of MitoTracker Green FM in shScramble (n = 4), shNCLX #2 (n = 4), and shNCLX #3 (n = 4) HASMCs with using flow cytometry (one-way ANOVA, F[2,9] = 238.6, p < 0.0001, with Dunnett’s post hoc test, p < 0.0001 for shNCLX #2 and p < 0.0001 for shNCLX #3). F, quantification of mitochondrial (mtDNA) in shScramble (n = 4), shNCLX #2 (n = 4), and shNCLX #3 (n = 4) HASMCs using RT–qPCR. mtDNA CT values are normalized to CT values of genomic DNA products (one-way ANOVA, F[2,9] = 9.648, p = 0.0058, with Dunnett’s post hoc test, p = 0.0154 for shNCLX #2 and p = 0.0047 for shNCLX #3). G, representative Western blots showing phosphorylated CaMKII variants (pCAMKII) and total CAMKII variant protein expression in HASMCs transfected with shScramble and two NCLX shRNA (shNCLX #2 and shNCLX #3). H, quantification of pCAMKII protein in shScramble (n = 4), shNCLX #2 (n = 4), and shNCLX #3 (n = 4) HASMCs from G using densitometry normalized to total CAMKII and GAPDH (one-way ANOVA, F[2,9] = 9.829, p = 0.0055, with Dunnett’s post hoc test, p = 0.0109 for shNCLX #2 and p = 0.0053 for shNCLX #3). ∗p < 0.05, ∗∗p < 0.01, ∗∗∗p < 0.001, ∗∗∗∗p < 0.0001, ns, not significant.
Figure 7
Figure 7
ASM NCLX is necessary for airway remodeling (AR) in a mouse model of house dust mite (HDM)–induced asthma.A, table of PCR products for NCLX and Myh11 Cre from Myh11 Cre and NCLX smKO mice. Table lists predicted band sizes of each PCR in each mouse cohort. See supporting appendix for sequence of primers. B, gel showing PCR products from genotyping reactions in A from the tails of Myh11 Cre and NCLX smKO mice. C, quantification of NCLX mRNA expression in isolated mouse ASM cells (MASMCs) from Myh11 Cre (n = 3) and NCLX smKO (n = 3) mice using RT–qPCR (Student’s t test, p = 0.0001). D, mitochondrial Ca2+ measurements stimulated with 100 μM ATP in the presence of 2 mM Ca2+ showing mitochondrial Ca2+ influx and extrusion in Myh11 Cre (light blue trace) (n = 21) and NCLX smKO (pink trace) (n = 30) cultured MASMCs. Mitochondrial Ca2+ is measured by dividing the fluorescence of Rhod-2 by that of MitoTracker Green. Quantification of (E) mitochondrial Ca2+ efflux rate (Mann–Whitney test, p = 0.3565) and (F) mitochondrial Ca2+ uptake (Mann–Whitney test, p = 0.3302) from D. G, scheme illustrating the timeline of tamoxifen injections and intranasal HDM challenges. H, representative immunohistochemistry images of lung slices from Myh11 Cre and NCLX smKO mice challenged with either saline or HDM. Smooth muscle is labeled brown with α-SMA antibody and 3,3′-diaminobenzidine (DAB). Slides are also counterstained with hematoxylin. The scale bar represents 100 μm. I, quantification of α-SMA-labeled area from H in saline-challenged Myh11 Cre (n = 6), HDM-challenged Myh11 Cre (n = 9), saline-challenged NCLX smKO (n = 8), and HDM-challenged NCLX smKO (n = 8) mice (two-way ANOVA: interaction F[1,27] = 79.71, p < 0.0001; genotype factor F[1,27] = 15.38, p = 0.0005; challenge factor F[1,27] = 26.75, p < 0.0001; for Turkey’s post hoc test compared with saline-challenged Myh11 Cre: p < 0.0001 for HDM-challenged Myh11 Cre, p = 0.0166 for saline-challenged NCLX smKO, p = 0.8347 for HDM-challenged NCLX smKO; compared with HDM-challenged Myh11 Cre: p < 0.0001 for HDM-challenged NCLX smKO). J, lung slices labeled with an isotype control and stained with DAB for immunohistochemistry. Lung slices were counterstained with hematoxylin. The scale bar represents 100 μm. K, representative images of lung slices stained with Masson’s trichrome stain. Collagen is stained blue. The scale bar represents 100 μm. L, quantification of blue-stained area from C in saline-challenged Myh11 Cre (n = 7), HDM-challenged Myh11 Cre (n = 9), saline-challenged NCLX smKO (n = 8), and HDM-challenged NCLX smKO (n = 9) mice (two-way ANOVA: interaction F[1,29] = 9.107, p = 0.0053; genotype factor F[1,29] = 7.43, p = 0.0108; challenge factor F[1,29] = 83.64, p < 0.0001; for Turkey’s post hoc test compared with saline-challenged Myh11 Cre: p < 0.0001 for HDM-challenged Myh11 Cre, p = 0.9972 for saline-challenged NCLX smKO, p = 0.0006 for HDM-challenged NCLX smKO; compared with HDM-challenged Myh11 Cre: p < 0.0007 for HDM-challenged NCLX smKO). ∗p < 0.05, ∗∗p < 0.01, ∗∗∗∗p < 0.0001, ns, not significant when compared with saline-challenged Myh11 Cre. ###p < 0.001, ####p < 0.0001 when compared with HDM-challenged Myh11 Cre. ASM, airway smooth muscle; NCLX, Na+/Ca2+ exchanger; qPCR, quantitative PCR; α-SMA, α-smooth muscle actin.
Figure 8
Figure 8
ASM NCLX is necessary for airway hyperresponsiveness (AHR) in a mouse model of house dust mite (HDM)–induced asthma.A, quantification of the total number of bronchoalveolar lavage (BAL) leukocytes (two-way ANOVA: interaction F[1,21] = 1.278, p = 0.270; genotype factor F[1,21] = 0.09157, p = 0.7652; challenge factor F[1,21] = 30.77, p < 0.0001; for Turkey’s post hoc test compared with saline-challenged Myh11 Cre: p = 0.0008 for HDM-challenged Myh11 Cre, p = 0.9360 for saline-challenged NCLX smKO, p = 0.0037 for HDM-challenged NCLX smKO; compared with HDM-challenged Myh11 Cre: p = 0.7575 for HDM-challenged NCLX smKO) and (B) different leukocyte subsets including monocytes (two-way ANOVA: interaction F[1,21] = 1.090, p = 0.3083; genotype factor F[1,21] = 0.007221, p = 0.9331; challenge factor F[1,21] = 14.38, p = 0.0011; for Turkey’s post hoc test compared with saline-challenged Myh11 Cre: p = 0.153 for HDM-challenged Myh11 Cre, p = 0.8974 for saline-challenged NCLX smKO, p = 0.0486 for HDM-challenged NCLX smKO; compared with HDM-challenged Myh11 Cre: p = 0.8632 for HDM-challenged NCLX smKO), lymphocytes (two-way ANOVA: interaction F[1,21] = 0.9436 p = 0.3424; genotype factor F[1,21] = 0.2990, p = 0.5903; challenge factor F[1,21] = 72.19, p < 0.0001; for Turkey’s post hoc test compared with saline-challenged Myh11 Cre: p < 0.0001 for HDM-challenged Myh11 Cre, p = 0.9895 for saline-challenged NCLX smKO, p = 0.0002 for HDM-challenged NCLX smKO; compared with HDM-challenged Myh11 Cre: p = 0.7243 for HDM-challenged NCLX smKO), neutrophils (two-way ANOVA: interaction F[1,21] = 0.9021, p = 0.3530; genotype factor F[1,21] = 0.1266, p = 0.7256; challenge factor F[1,21] = 14.72, p = 0.0010; for Turkey’s post hoc test compared with saline-challenged Myh11 Cre: p = 0.0165 for HDM-challenged Myh11 Cre, p = 0.9724 for saline-challenged NCLX smKO, p = 0.0688 for HDM-challenged NCLX smKO; compared with HDM-challenged Myh11 Cre: p = 0.8047 for HDM-challenged NCLX smKO), and eosinophils (two-way ANOVA: interaction F[1,21] = 0.3289, p = 0.5724; genotype factor F[1,21] = 0.01048, p = 0.9194; challenge factor F[1,21] = 16.47, p = 0.0006; for Turkey’s post hoc test compared with saline-challenged Myh11 Cre: p = 0.0210 for HDM-challenged Myh11 Cre, p = 0.9859 for saline-challenged NCLX smKO, p = 0.0327 for HDM-challenged NCLX smKO; compared with HDM-challenged Myh11 Cre: p = 0.9656 for HDM-challenged NCLX smKO) from saline-challenged Myh11 Cre (n = 7), HDM-challenged Myh11 Cre (n = 5), saline-challenged NCLX smKO (n = 6), and HDM-challenged NCLX smKO mice (n = 7). C, quantification of IgE in the BAL of saline-challenged Myh11 Cre (n = 6), HDM-challenged Myh11 Cre (n = 8), saline-challenged NCLX smKO (n = 6), and HDM-challenged NCLX smKO (n = 6) mice (two-way ANOVA: interaction F[1,21] = 0.6326, p = 0.4353; genotype factor F[1,21] = 0.5819, p = 0.4541; challenge factor F[1,21] = 20.65, p = 0.0002; for Turkey’s post hoc test compared with saline-challenged Myh11 Cre: p = 0.0033 for HDM-challenged Myh11 Cre, p > 0.9999 for saline-challenged NCLX smKO, p = 0.0035 for HDM-challenged NCLX smKO; compared with HDM-challenged Myh11 Cre: p = 0.6882 for HDM-challenged NCLX smKO). For each sample in C, IgE secretion is normalized to total protein content in sample. D, trace measuring airway resistance (Rrs) on anesthetized mice challenged with increasing concentrations of methacholine. Mice cohorts are saline-challenged Myh11 Cre (light blue trace) (n = 12), HDM-challenged Myh11 Cre (dark blue trace) (n = 12), HDM-challenged NCLXfl/fl mice (green trace) (n = 5), saline-challenged NCLX smKO (pink trace) (n = 10), and HDM-challenged NCLX smKO (red trace) (n = 12) mice (two-way ANOVA: interaction F[24,303] = 3.997, p < 0.0001; row factor F[6303] = 38.84, p < 0.0001; column factor F[6303] = 26.57, p = 0.0014; for Dunnett’s post hoc test compared with saline-challenged Myh11 Cre 0 mg/ml of methacholine: p = 0.9603 for HDM-challenged Myh11 Cre, p = 0.9997 for saline-challenged NCLX smKO, p = 0.9998 for HDM-challenged NCLX smKO, p = 0.9896 for HDM-challenged NCLXfl/fl; compared with HDM-challenged Myh11 Cre 0 mg/ml of methacholine: p = 0.9580 for HDM-challenged NCLX smKO; compared with saline-challenged Myh11 Cre 6.25 mg/ml of methacholine: p = 0.9971 for HDM-challenged Myh11 Cre, p = 0.9053 for saline-challenged NCLX smKO, p ≥ 0.9999 for HDM-challenged NCLX smKO, p = 0.9998 for HDM-challenged NCLXfl/fl; compared with HDM-challenged Myh11 Cre 6.25 mg/ml of methacholine: p = 0.9850 for HDM-challenged NCLX smKO; compared with saline-challenged Myh11 Cre 12.5 mg/ml of methacholine: p = 0.2095 for HDM-challenged Myh11 Cre, p = 0.9129 for saline-challenged NCLX smKO, p = 0.9953 for HDM-challenged NCLX smKO, p = 0.7154 for HDM-challenged NCLXfl/fl; compared with HDM-challenged Myh11 Cre 12.5 mg/ml of methacholine: p = 0.3140 for HDM-challenged NCLX smKO; compared with saline-challenged Myh11 Cre 25 mg/ml of methacholine: p = 0.0003 for HDM-challenged Myh11 Cre, p = 0.8349 for saline-challenged NCLX smKO, p = 0.8645 for HDM-challenged NCLX smKO, p = 0.7270 for HDM-challenged NCLXfl/fl; compared with HDM-challenged Myh11 Cre 25 mg/ml of methacholine: p = 0.0071 for HDM-challenged NCLX smKO; compared with saline-challenged Myh11 Cre 50 mg/ml of methacholine: p < 0.0001 for HDM-challenged Myh11 Cre, p = 0.5309 for saline-challenged NCLX smKO, p = 0.247 for HDM-challenged NCLX smKO, p = 0.0419 for HDM-challenged NCLXfl/fl; compared with HDM-challenged Myh11 Cre 50 mg/ml of methacholine: p = 0.0018 for HDM-challenged NCLX smKO; compared with saline-challenged Myh11 Cre 100 mg/ml of methacholine: p < 0.0001 for HDM-challenged Myh11 Cre, p = 0.8066 for saline-challenged NCLX smKO, p = 0.0134 for HDM-challenged NCLX smKO, p < 0.0001 for HDM-challenged NCLXfl/fl; compared with HDM-challenged Myh11 Cre 100 mg/ml of methacholine: p < 0.0001 for HDM-challenged NCLX smKO. ∗p < 0.05, ∗∗p < 0.01, ∗∗∗p < 0.001, ∗∗∗∗p < 0.0001, ns, not significant when compared with saline-challenged Myh11 Cre. #p < 0.05, ##p < 0.01, ###p < 0.001, ####p < 0.0001 when compared with HDM-challenged Myh11 Cre. ASM, airway smooth muscle; NCLX, Na+/Ca2+ exchanger; IgE, immunoglobulin E.

References

    1. Nurmagambetov T., Kuwahara R., Garbe P. The economic burden of asthma in the United States, 2008-2013. Ann. Am. Thorac. Soc. 2018;15:348–356. - PubMed
    1. Chung K.F., Wenzel S.E., Brozek J.L., Bush A., Castro M., Sterk P.J., et al. International ERS/ATS guidelines on definition, evaluation and treatment of severe asthma. Eur. Respir. J. 2014;43:343–373. - PubMed
    1. Wilson S.J., Rigden H.M., Ward J.A., Laviolette M., Jarjour N.N., Djukanovic R. The relationship between eosinophilia and airway remodelling in mild asthma. Clin. Exp. Allergy. 2013;43:1342–1350. - PMC - PubMed
    1. Bourdin A., Neveu D., Vachier I., Paganin F., Godard P., Chanez P. Specificity of basement membrane thickening in severe asthma. J. Allergy Clin. Immunol. 2007;119:1367–1374. - PubMed
    1. Wadsworth S., Sin D., Dorscheid D. Clinical update on the use of biomarkers of airway inflammation in the management of asthma. J. Asthma Allergy. 2011;4:77–86. - PMC - PubMed

Publication types