. 2022 Jul 16;13(1):4136.
doi: 10.1038/s41467-022-31812-4.

Loss of immunity-related GTPase GM4951 leads to nonalcoholic fatty liver disease without obesity

Affiliations

Loss of immunity-related GTPase GM4951 leads to nonalcoholic fatty liver disease without obesity

Zhao Zhang et al. Nat Commun. .

Abstract

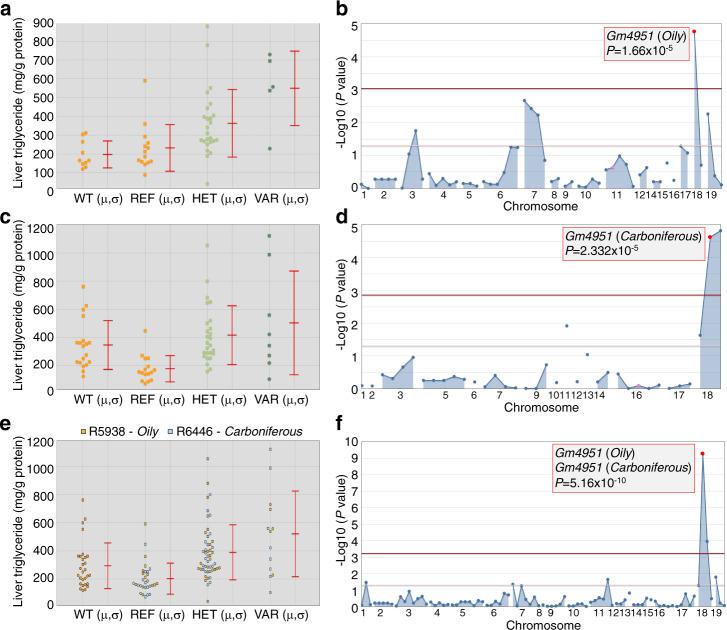
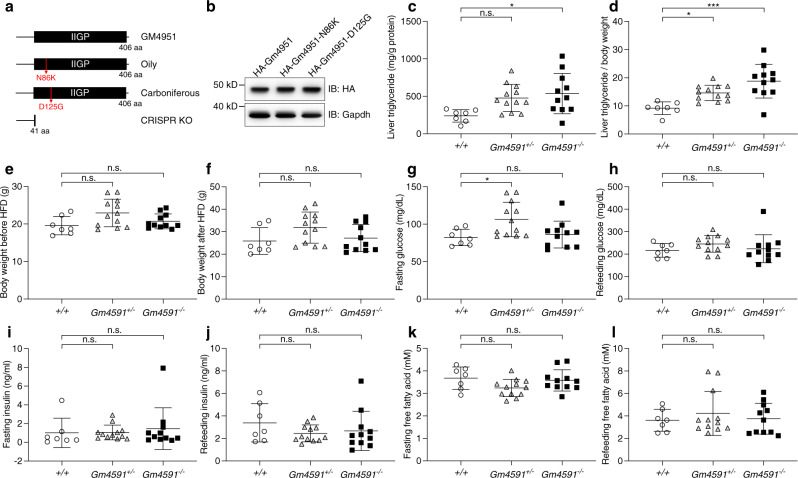
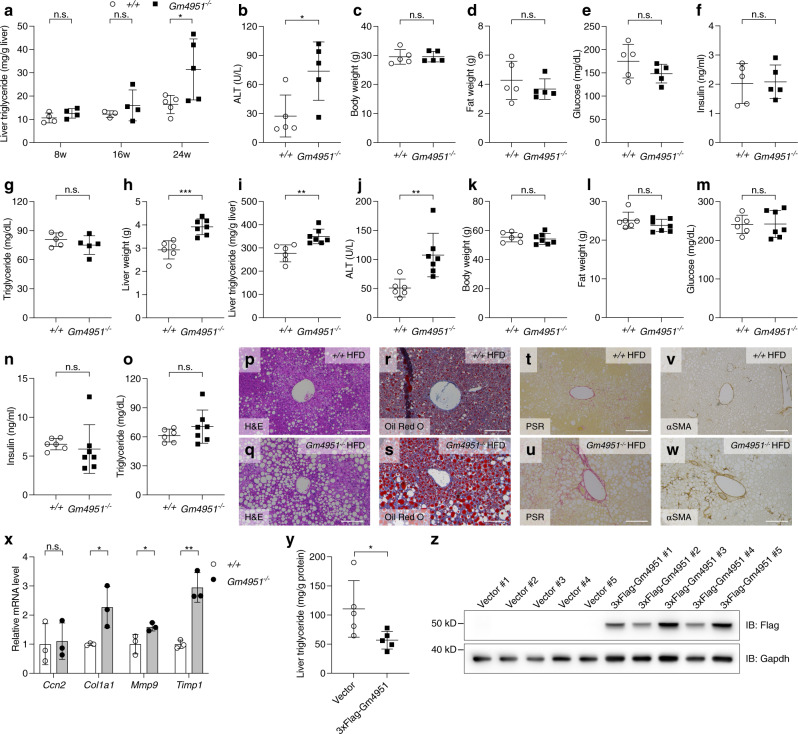
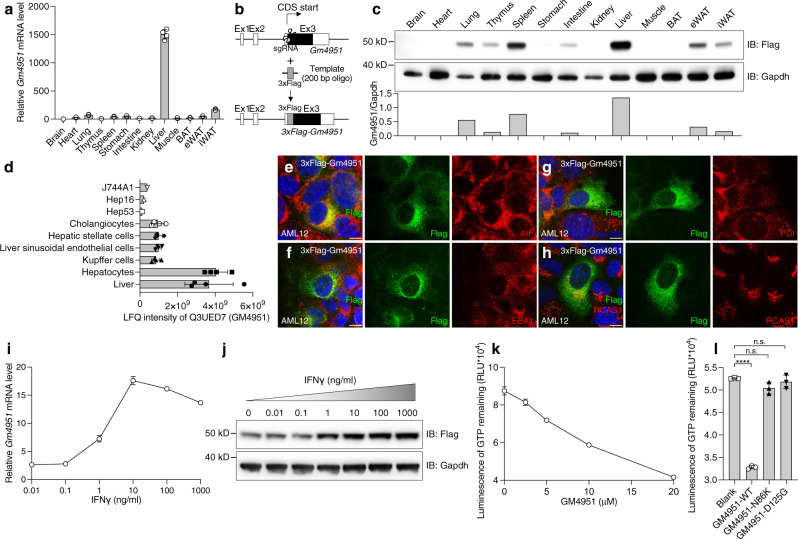
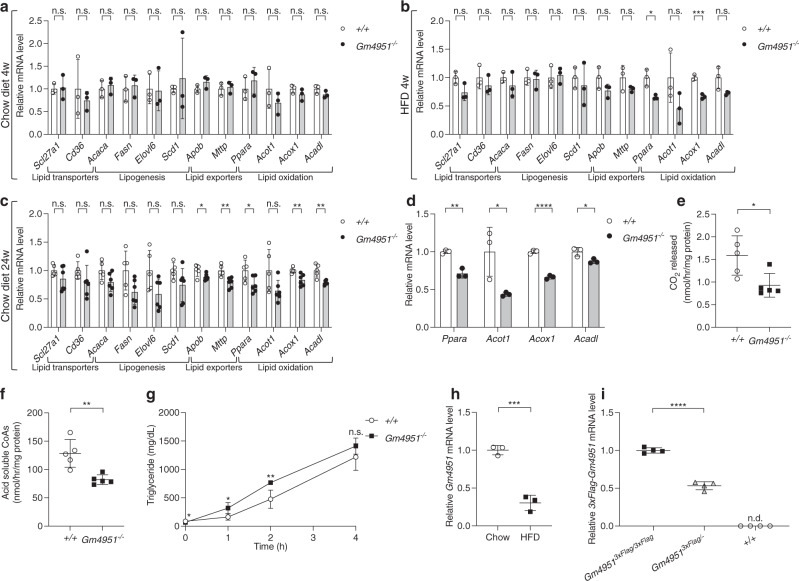
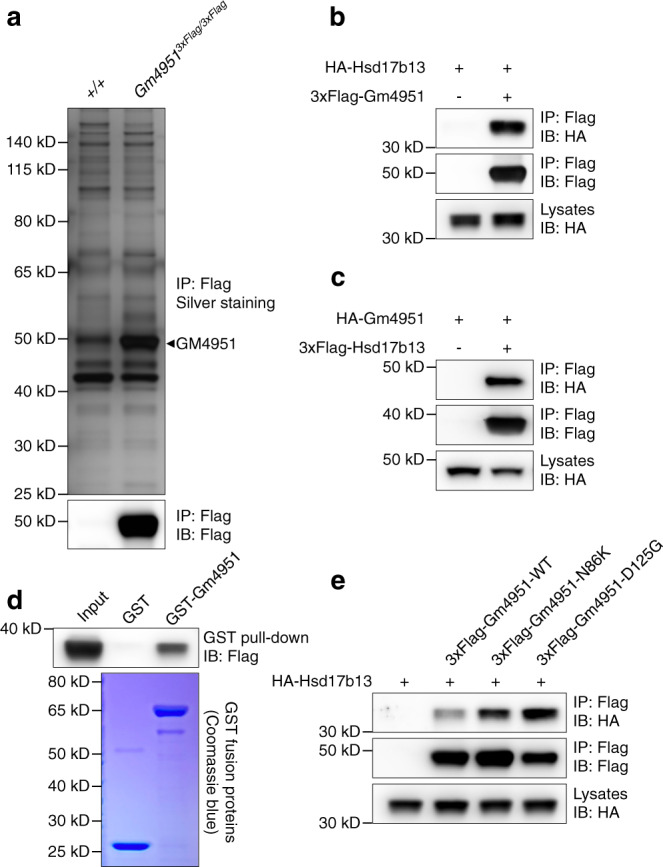
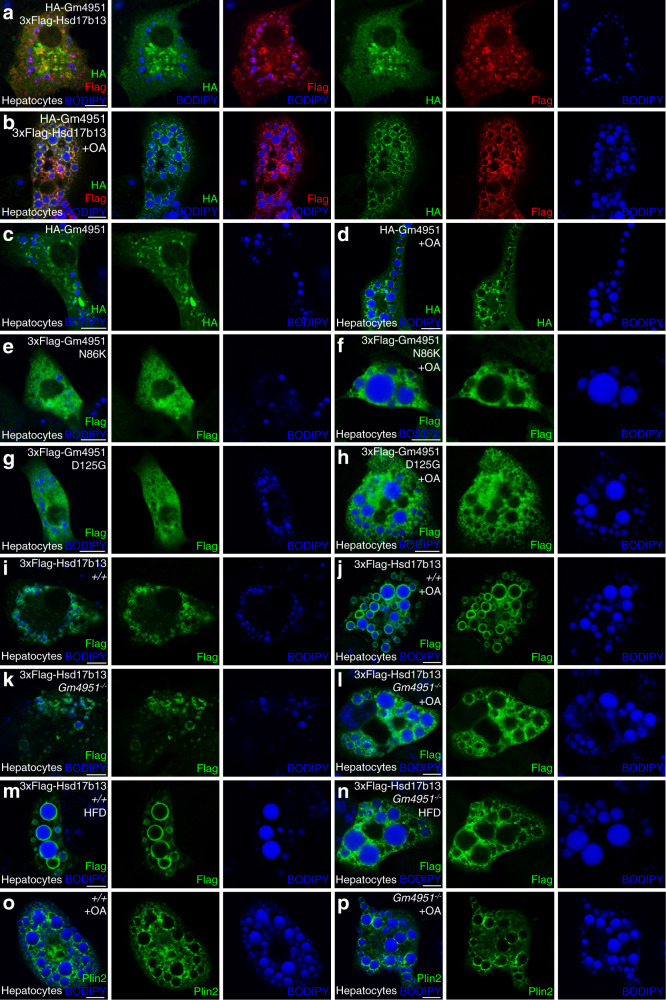
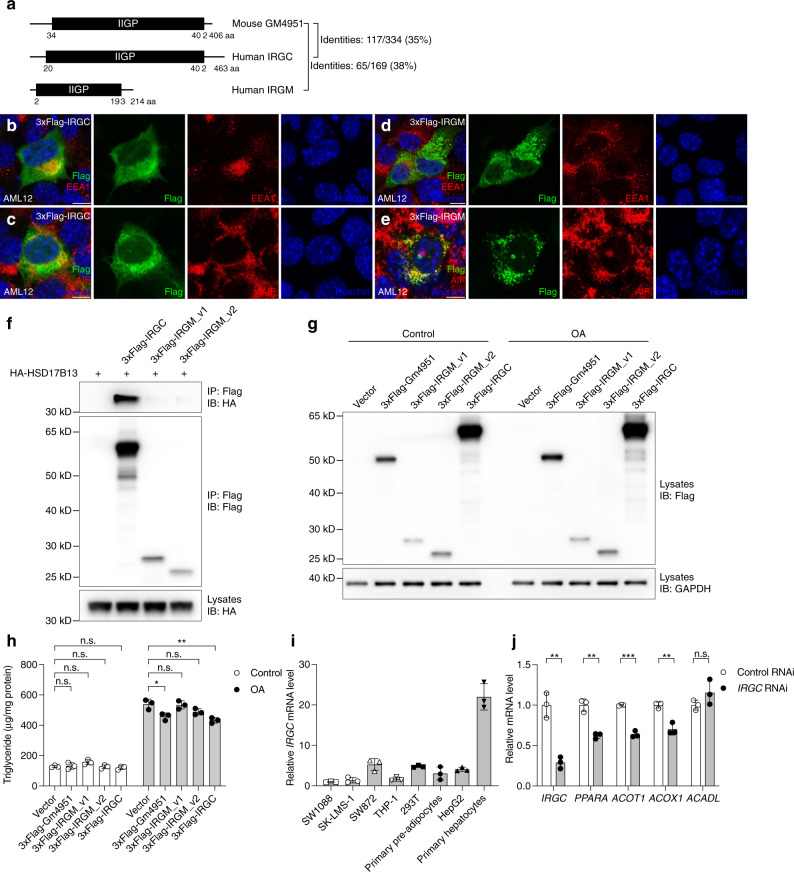
Obesity and diabetes are well known risk factors for nonalcoholic fatty liver disease (NAFLD), but the genetic factors contributing to the development of NAFLD remain poorly understood. Here we describe two semi-dominant allelic missense mutations (Oily and Carboniferous) of Predicted gene 4951 (Gm4951) identified from a forward genetic screen in mice. GM4951 deficient mice developed NAFLD on high fat diet (HFD) with no changes in body weight or glucose metabolism. Moreover, HFD caused a reduction in the level of Gm4951, which in turn promoted the development of NAFLD. Predominantly expressed in hepatocytes, GM4951 was verified as an interferon inducible GTPase. The NAFLD in Gm4951 knockout mice was associated with decreased lipid oxidation in the liver and no defect in hepatic lipid secretion. After lipid loading, hepatocyte GM4951 translocated to lipid droplets (LDs), bringing with it hydroxysteroid 17β-dehydrogenase 13 (HSD17B13), which in the absence of GM4951 did not undergo this translocation. We identified a rare non-obese mouse model of NAFLD caused by GM4951 deficiency and define a critical role for GTPase-mediated translocation in hepatic lipid metabolism.


Conflict of interest statement

The authors declare no competing interests.

Figures

Fig. 1
Fig. 1. Identification and mapping of Oily and Carboniferous.
a Liver triglyceride data from G3 mice plotted vs. genotype at the Oily mutation site of Gm4951 after four weeks on a HFD (n = 10 mice in WT; n = 14 mice in REF; n = 25 mice in HET; n = 5 mice in VAR). b Manhattan plot showing P values calculated using a likehood-ratio test from an additive model of inheritance. c Liver triglyceride data from G3 mice plotted vs. genotype at the Carboniferous mutation site of Gm4951 after four weeks on a HFD (n = 19 mice in WT; n = 16 mice in REF; n = 26 mice in HET; n = 8 mice in VAR). d Manhattan plot showing P values calculated using a likehood-ratio test from an additive model of inheritance. e, f Liver triglyceride data from pedigrees R5938 (Oily) and R6446 (Carboniferous) were pooled together in superpedigree analysis and plotted as in a and c (n = 29 mice in WT; n = 30 mice in REF; n = 51 mice in HET; n = 13 mice in VAR); Manhattan plot as in (b) and (d). P values were calculated using a likehood-ratio test from an additive model of inheritance. WT, C57BL/6 J mice age-matched with G3 mice; REF, G3 mice homozygous for the reference allele of the indicated gene; HET, G3 mice heterozygous for the reference allele and for the mutant allele; VAR, G3 mice homozygous for the mutant allele. Each data point represents one mouse; mean (μ) and SD (σ) are indicated (a, c, e). Data are from one experiment.
Fig. 2
Fig. 2. Mutations in Gm4951 cause the Oily and Carboniferous phenotypes.
a Protein domain diagrams of mouse GM4951 WT form, with the Oily mutation, Carboniferous mutation, and truncated form generated by CRISPR KO. b Immunoblots of lysates of 293T cells expressing HA-tagged WT GM4951, GM4951-N86K, and GM4951-D125G. cl Liver triglycerides (c), liver triglycerides normalized by body weight (d), body weight before HFD (e), body weight after four weeks of HFD (f), overnight fasting glucose (g), glucose 2 h after refeeding (h), overnight fasting insulin (i), insulin 2 h after refeeding (j), overnight fasting free fatty acid (k), and free fatty acid 2 h after refeeding (l) plotted for WT (+/+, n = 7), heterozygous (Gm4951+/−, n = 12), and homozygous Gm4951 CRISPR KO (Gm4951−/−, n = 11) mice. Data in (c, d, and f) were measured after 4 weeks on a HFD; data in (gl) were measured after two weeks on a HFD. Each data point represents one mouse (cl). Data are presented as means ± SD. P values were determined by one-way ANOVA with Tukey’s multiple comparison test. P values are denoted by *P < 0.05; ***P < 0.001; ns, not significant with P > 0.05. The exact P values of statistically significant groups are: 0.0149 (c, +/+ vs Gm4951−/−); 0.0283 (d, +/+ vs Gm4951+/−); 0.0002 (d, +/+ vs Gm4951−/−); 0.0323 (g, +/+ vs Gm4951+/−). Data are representative of two independent experiments (bl).
Fig. 3
Fig. 3. The development of NAFLD in Gm4951−/− mice on chow diet and HFD.
a Liver triglycerides in WT and Gm4951−/− mice on chow diet for eight weeks (n = 4 in WT; n = 4 in Gm4951−/−), 16 weeks (n = 3 in WT; n = 4 in Gm4951−/−), and 24 weeks (n = 5 in WT; n = 5 in Gm4951−/−). bg Serum ALT (b), body weight (c), fat weight (d), fasting glucose (e), fasting insulin (f), and fasting serum triglycerides (g) of WT (n = 5) and Gm4951−/− (n = 5) mice on chow diet for 24 weeks. ho Liver weight (h), liver triglycerides (i), serum ALT (j), body weight (k), fat weight (l), fasting glucose (m), fasting insulin (n), and fasting serum triglycerides (o) of WT (n = 6) and Gm4951−/− (n = 7) mice on HFD for 24 weeks. pw H&E staining (p and q), Oil Red O staining (r and s), PSR staining (t and u), and αSMA staining (v and w) of liver sections from WT and Gm4951−/− mice on HFD for 24 weeks. (Scale bars: 100 μm). x Relative mRNA level of different fibrosis-related genes in the liver from WT and Gm4951−/− mice on HFD for 24 weeks (n = 3 mice per genotype). Levels were normalized to Polr2a mRNA and then to levels in WT mice. y Overexpression of 3xFlag-Gm4951 by hydrodynamic tail vein injection. Liver triglycerides in mice injected with control vector or 3xFlag-Gm4951 vector and fed HFD for two weeks (n = 5 mice in each group). z Immunoblot analysis of 3xFlag-Gm4951 protein expression in mouse livers two weeks after hydrodynamic tail vein injection. Each data point represents one mouse. Data are presented as means ± SD. P values were determined by two-tailed Student’s t test. P values are denoted by *P < 0.05; **P < 0.01; ***P < 0.001; ns, not significant with P > 0.05. The exact P values of statistically significant groups are: 0.0177 (a, 24w); 0.0234 (b); 0.0005 (h); 0.0026 (i); 0.0055 (j); 0.0355 (x, Col1a1); 0.0466 (x, Mmp9); 0.0031 (x, Timp1); 0.0463 (y). Data are representative of two independent experiments (ao, xz) or from one experiment (pw).
Fig. 4
Fig. 4. GM4951 is an interferon inducible GTPase that is highly expressed in hepatocytes.
a Relative Gm4951 mRNA level in different mouse tissues normalized by Polr2a (n = 3 mice). b Generation of 3xFlag tagged Gm4951 knockin mice by CRISPR. c Immunoblot analysis of 3xFlag-Gm4951 protein expression in different mouse tissues (eight weeks old male). Gapdh was used as a loading control. Quantification of bands in the lower panel are shown as ratio of intensity of Gm4951 to Gapdh. d Label-free quantification (LFQ) intensity data for GM4951 protein in different primary cells isolated from the mouse liver or cell lines (n = 1 assay for J744A1, Hep16, and Hep53; n = 4 assays for other cells). eh AML12 cells expressing 3xFlag-tagged Gm4951 were immunostained with Flag antibody (green), Hoechst 33342 (blue) to visualize nuclei, and organelle markers (red): AIF (mitochondria), EEA1 (endosome), PDI (ER), and RCAS1 (Golgi apparatus). (Scale bar: 10 μm.) i Relative mRNA level of Gm4951 in primary hepatocytes treated with different doses of IFNγ for 24 h (n = 3 independent cultures). j Immunoblots of lysates of primary hepatocytes isolated from 3xFlag-Gm4951 knockin mice. Different doses of IFNγ were added into the medium for 24 h. Gapdh was used as a loading control. k Luminescence to quantitate the amount of GTP remaining 1 h after the GTPase assay with different concentrations of purified GM4951 protein (n = 3 assays per condition). l Luminescence to quantitate the amount of GTP remaining 1 h after the GTPase assay with purified GM4951 WT and mutated proteins (n = 3 assays per condition). Each data point represents one mouse (a) or one reaction (d, l). Data are presented as means ± SD. P values were determined by one-way ANOVA with Tukey’s multiple comparison test. P values are denoted by ****P < 0.0001; ns, not significant with P > 0.05. The exact P value of statistically significant group is 3.473 × 10−8 (Blank vs GM4951-WT). Data are representative of two independent experiments (a, c, el).
Fig. 5
Fig. 5. GM4951 is involved in lipid oxidation and is downregulated by HFD feeding.
a-c Relative mRNA level of different genes in the liver from WT and Gm4951−/− mice on chow diet (a) and HFD (b) for four weeks (n = 3 mice per genotype), and chow diet for 24 weeks (c) (n = 5 mice per genotype). Levels were normalized to Polr2a mRNA and then to levels in WT mice. d Relative mRNA level of different genes in hepatocytes from WT and Gm4951−/− mice after 0.5 mM OA for 24 h (n = 3 mice per genotype). e, f CO2 released (e) and acid soluble CoAs (f) from fatty acid oxidation experiment were measured with scintillation counting and normalized with total protein of liver lysates (n = 5 mice per genotype). g The serum level of triglycerides at different time points after Triton WR-1399 injection in WT and Gm4951−/− mice on HFD for 4 weeks (n = 3 mice per genotype). h Relative mRNA level of Gm4951 in the liver from C57BL6/J mice on chow diet or HFD for 24 weeks (n = 3 mice per genotype). Levels were normalized to Polr2a mRNA and then to levels in WT mice fed chow diet. i Relative mRNA level of 3xFlag-Gm4951 in the liver from mice of the indicated genotypes on chow diet at eight weeks of age (n = 4 mice per genotype). n.d. not detected. Levels were normalized to Polr2a mRNA and then to levels in WT mice. Each data point represents one mouse (af, hi). Data are presented as means ± SD. P values were determined by two-tailed Student’s t test. P values are denoted by *P < 0.05; **P < 0.01; ***P < 0.001; ****P < 0.001; ns, not significant with P > 0.05. The exact P values of statistically significant groups are: 0.0176 (b, Ppara); 0.0009 (b, Acox1); 0.0418 (c, Apob); 0.0041 (c, Mttp); 0.0281 (c, Ppara); 0.0017 (d, Ppara); 0.0401 (d, Acot1); 8.466 × 10−5 (d, Acox1); 0.0288 (d, Acadl); 0.0201 (e); 0.0039 (f); 0.0116 (g, 0 h); 0.0132 (g, 1 h); 0.0040 (g, 2 h); 0.0005 (h); 6.292 × 10−6 (i). Data are representative of two independent experiments (ad, gi) or from one experiment (ef).
Fig. 6
Fig. 6. GM4951 interacts with HSD17B13.
a Silver staining (top) or immunoblot (bottom) of anti-Flag immunoprecipitates from +/+ or Gm49513xFlag/3xFlag liver lysates. The same samples were analyzed by mass spectrometry to identify GM4951 interacting proteins. b Immunoblots of immunoprecipitates (top and middle) or lysates (bottom) of 293T cells expressing HA-tagged Hsd17b13 and 3xFlag-tagged Gm4951. c Immunoblots of immunoprecipitates (top and middle) or lysates (bottom) of 293T cells expressing HA-tagged Gm4951 and 3xFlag-tagged Hsd17b13. d Purified 3xFlag-tagged Hsd17b13 was incubated with GST or GST-tagged Gm4951. After GST pull-down, bound protein was analyzed by Flag immunoblot (top). The amounts of GST and GST-Gm4951 were visualized by Coomassie blue staining (bottom). e Immunoblots of immunoprecipitates (top and middle) or lysates (bottom) of 293T cells expressing HA-tagged Hsd17b13 and 3xFlag-tagged WT or mutant Gm4951. Data are representative of two independent experiments (be) or from one experiment (a).
Fig. 7
Fig. 7. GM4951 targets HSD17B13 to LDs through GTPase activity.
a, b Mouse primary hepatocytes expressing HA-tagged Gm4951 and 3xFlag-tagged Hsd17b13 were immunostained with HA antibody (green), Flag antibody (red), and BODIPY (blue) to visualize LDs. 0.5 mM oleic acid for 24 h was used in +OA groups. c, d Mouse primary hepatocytes expressing HA-tagged Gm4951 without or with OA treatment were immunostained with HA antibody (green) and BODIPY (blue) to visualize LDs. eh Mouse primary hepatocytes expressing 3xFlag-tagged Gm4951 mutants without or with OA treatment were immunostained with Flag antibody (green) and BODIPY (blue) to visualize LDs. il Hepatocytes isolated from WT or Gm4951−/− mice expressing 3xFlag-tagged Hsd17b13 without or with OA treatment were immunostained with Flag antibody (green) and BODIPY (blue) to visualize LDs. Hepatocytes were from mice maintained on chow diet (al). m, n Hepatocytes isolated from 4 week HFD-fed WT or Gm4951−/− mice expressing 3xFlag-tagged Hsd17b13 were immunostained with Flag antibody (green) and BODIPY (blue) to visualize LDs. o, p Primary hepatocytes isolated from +/+ or Gm4951−/− mice maintained on chow diet were treated with OA and immunostained with Plin2 antibody (green) and BODIPY (blue) to visualize LDs. (All scale bars: 10 μm.) Data are representative of two independent experiments.
Fig. 8
Fig. 8. Identification of potential human homologs of mouse GM4951.
a Protein domain diagrams of mouse GM4951 and human IRGC and IRGM. Locations of IIGP domains and amino acid identities across the full length of the proteins are indicated. be AML12 cells expressing 3xFlag-tagged IRGC or IRGM were immunostained with Flag antibody (green), Hoechst 33342 (blue) to visualize nuclei, and organelle markers (red): AIF (mitochondria) and EEA1 (endosome). (Scale bar: 10 μm.) f Immunoblots of immunoprecipitates (top and middle) or lysates (bottom) of 293T cells expressing HA-tagged human HSD17B13 and 3xFlag-tagged human IRGC, IRGM_v1, and IRGM_v2. g, h Immunoblots of lysates (g) or triglyceride level in lysates (n = 3 cultures per group) (h) of primary human hepatocytes expressing different IRG genes with or without 0.5 mM OA treatment for 24 h. i Relative mRNA level of IRGC from different human cell lines or human primary cells. Levels were normalized to ACTB mRNA and then to levels in SW1088 cells (n = 3 cultures per group). j Relative mRNA level of IRGC and several lipid oxidation genes (PPARA, ACOT1, ACOX1, and ACADL) from primary human hepatocytes transfected with control siRNA or IRGC siRNA with 0.5 mM OA treatment for 24 h (n = 3 cultures per group). Levels were normalized to ACTB mRNA and then to levels in control RNAi. Data points represent independent cultures. Data are presented as means ± SD. P values were determined by one-way ANOVA with Tukey’s multiple comparison test (h) or two-tailed Student’s t test (j). P values are denoted by *P < 0.05; **P < 0.01; ***P < 0.001; ns, not significant with P > 0.05. The exact P values of statistically significant groups are: 0.0158 (h, Vector vs 3xFlag-Gm4951 OA); 0.0026 (h, Vector vs 3xFlag-IRGC); 0.0019 (j, IRGC); 0.0015 (j, PPARA); 0.0001 (j, ACOT1); 0.0031 (j, ACOX1). Data are representative of two independent experiments (bj).

Similar articles

Cited by

References

    1. Younossi ZM, et al. Global epidemiology of nonalcoholic fatty liver disease-Meta-analytic assessment of prevalence, incidence, and outcomes. Hepatology. 2016;64:73–84. doi: 10.1002/hep.28431. - DOI - PubMed
    1. Cohen JC, Horton JD, Hobbs HH. Human fatty liver disease: old questions and new insights. Science. 2011;332:1519–1523. doi: 10.1126/science.1204265. - DOI - PMC - PubMed
    1. Wree A, Broderick L, Canbay A, Hoffman HM, Feldstein AE. From NAFLD to NASH to cirrhosis-new insights into disease mechanisms. Nat. Rev. Gastroenterol. Hepatol. 2013;10:627–636. doi: 10.1038/nrgastro.2013.149. - DOI - PubMed
    1. Michelotti GA, Machado MV, Diehl AM. NAFLD, NASH and liver cancer. Nat. Rev. Gastroenterol. Hepatol. 2013;10:656–665. doi: 10.1038/nrgastro.2013.183. - DOI - PubMed
    1. Byrne CD, Targher G. NAFLD: a multisystem disease. J. Hepatol. 2015;62:S47–S64. doi: 10.1016/j.jhep.2014.12.012. - DOI - PubMed

Publication types