. 2022 Jul 16;13(1):4143.
doi: 10.1038/s41467-022-31865-5.

The CIP2A-TOPBP1 complex safeguards chromosomal stability during mitosis

Affiliations

The CIP2A-TOPBP1 complex safeguards chromosomal stability during mitosis

Mara De Marco Zompit et al. Nat Commun. .

Abstract

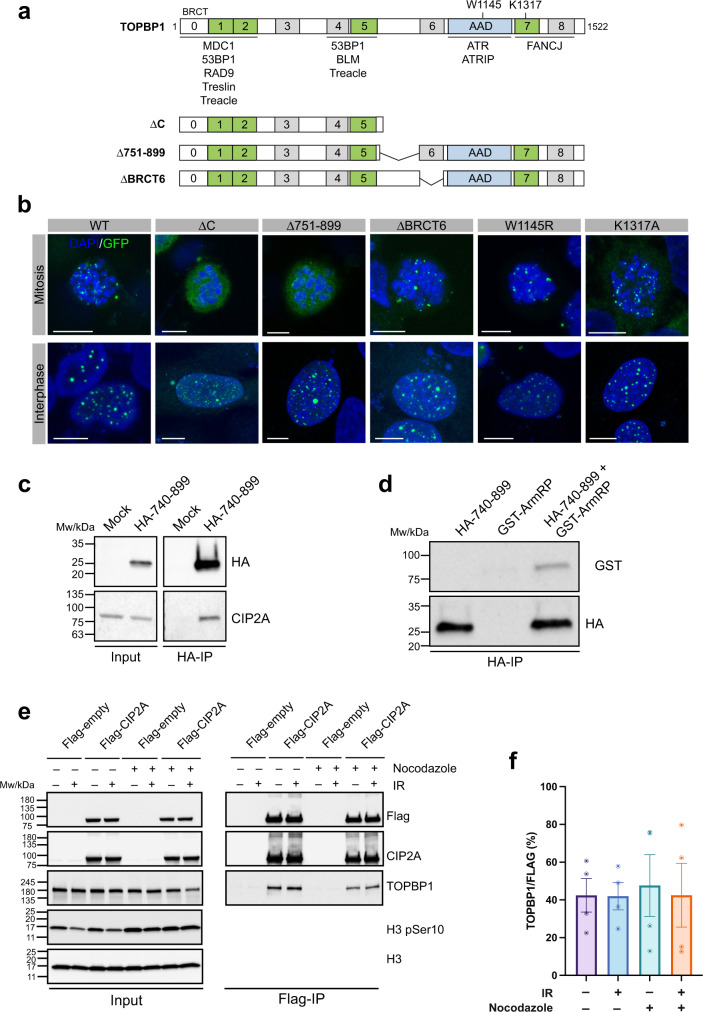
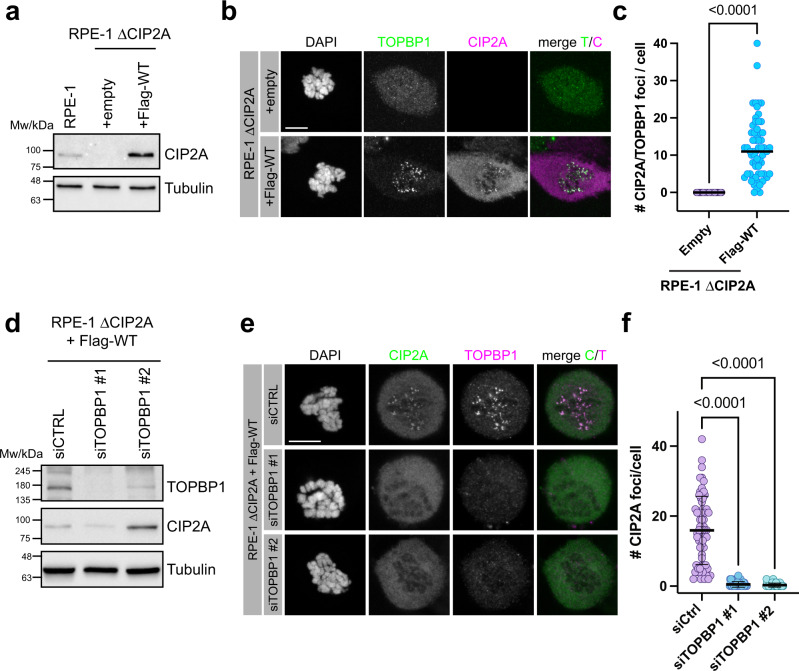
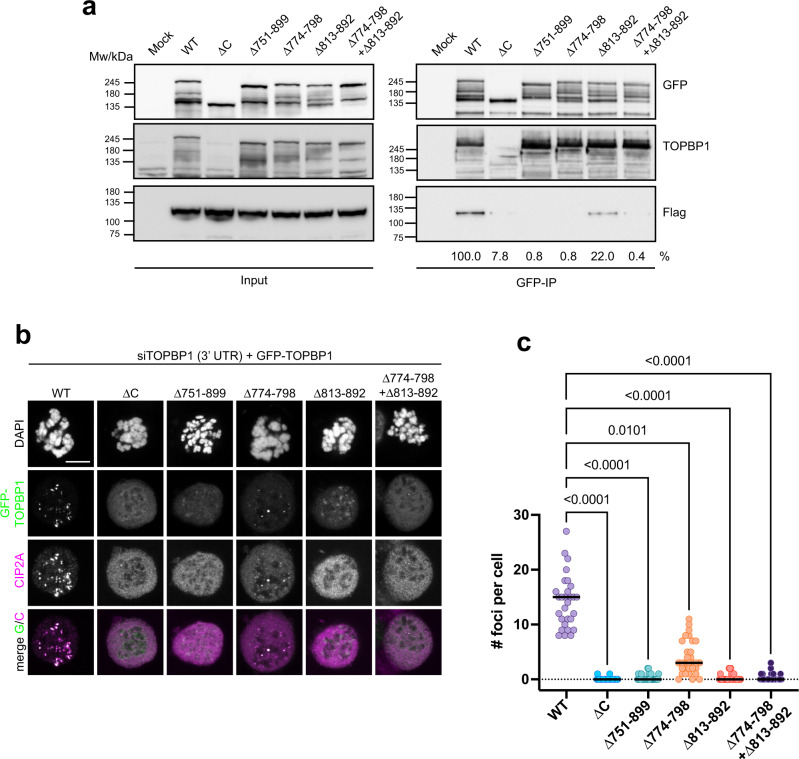
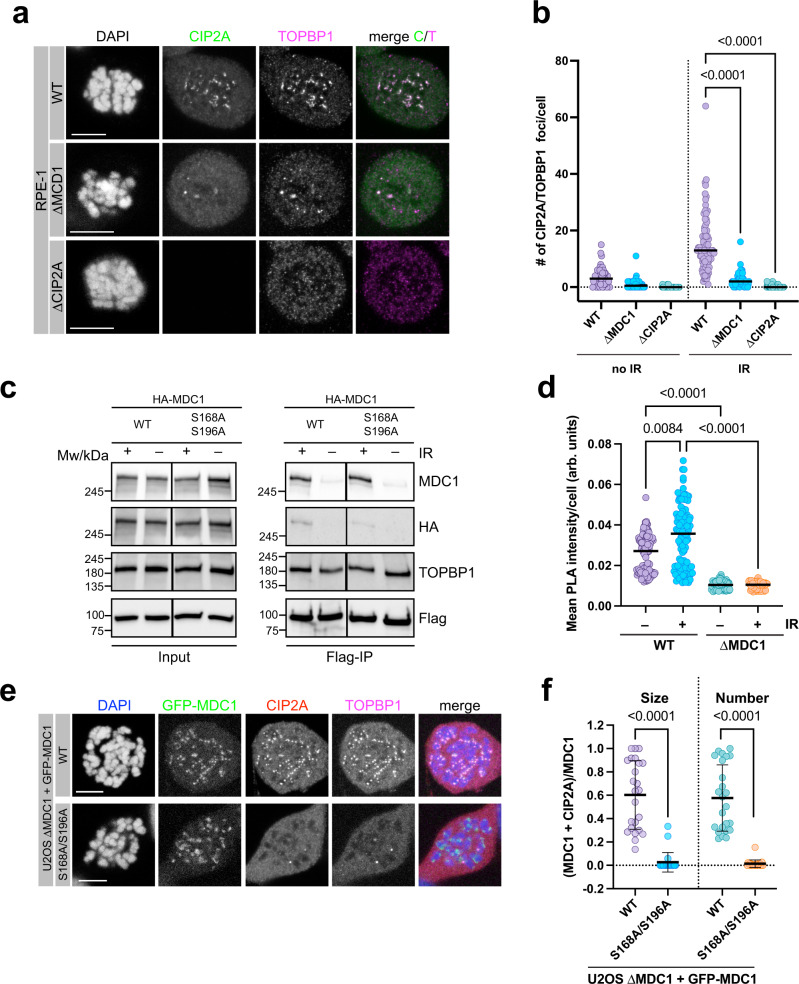
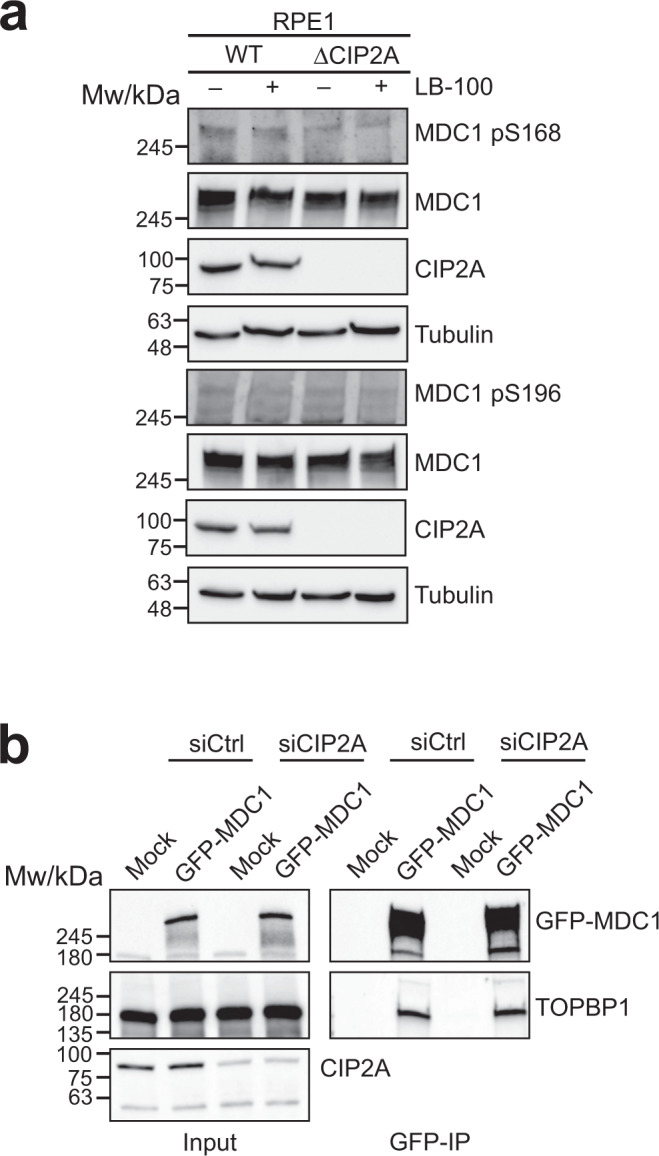
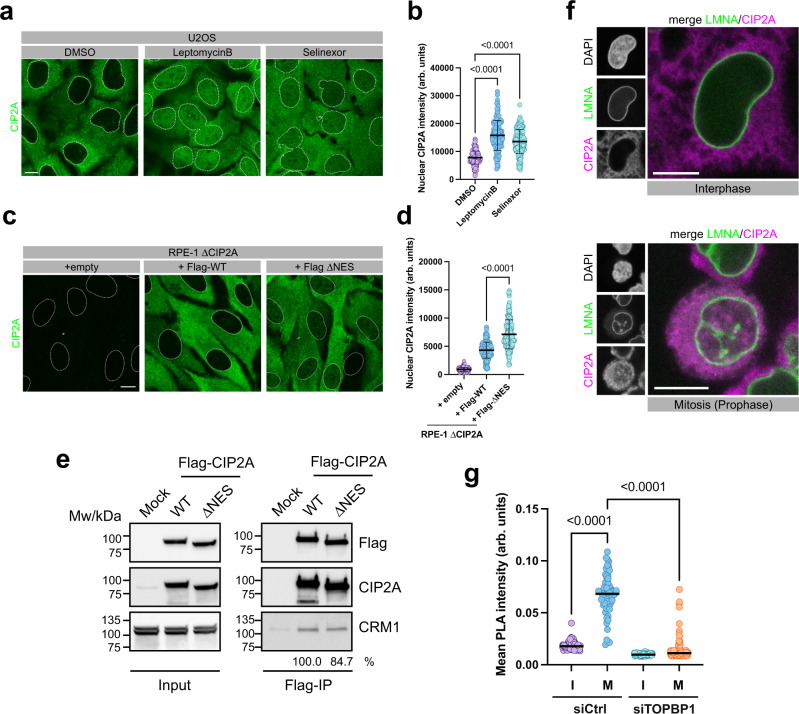
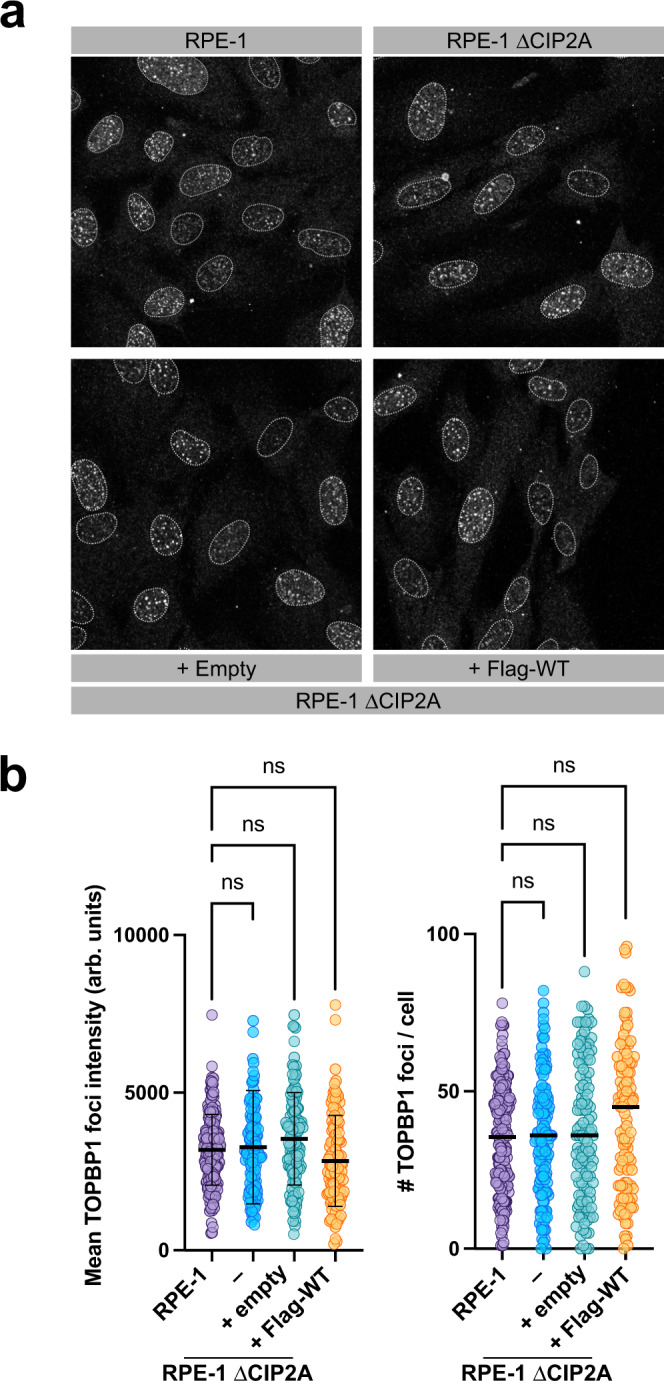
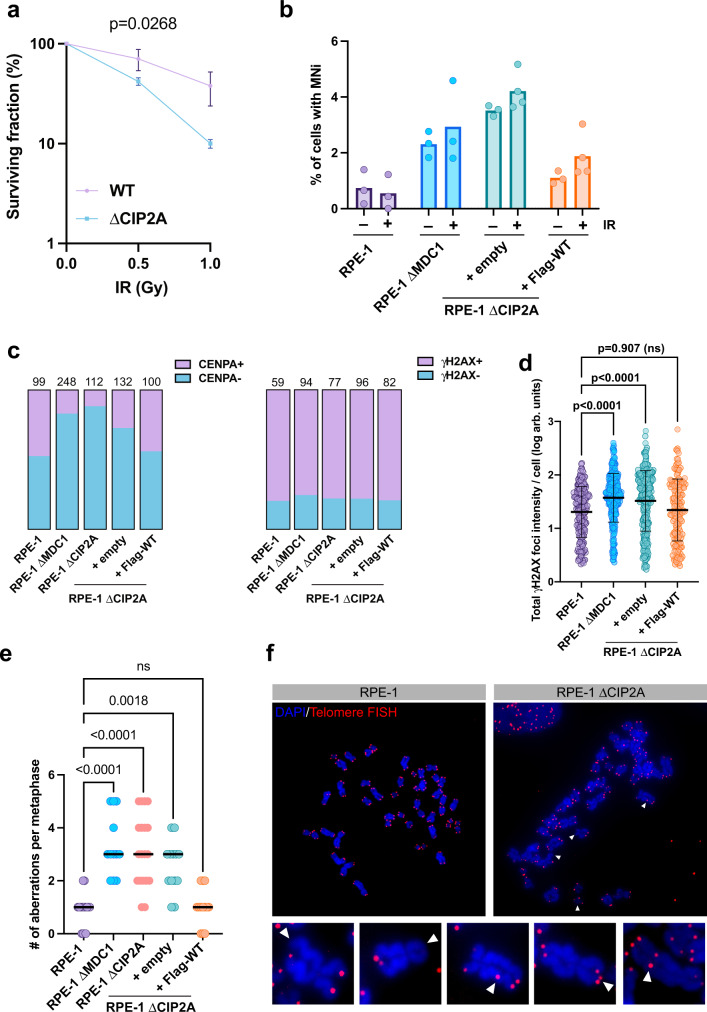
The accurate repair of DNA double-strand breaks (DSBs), highly toxic DNA lesions, is crucial for genome integrity and is tightly regulated during the cell cycle. In mitosis, cells inactivate DSB repair in favor of a tethering mechanism that stabilizes broken chromosomes until they are repaired in the subsequent cell cycle phases. How this is achieved mechanistically is not yet understood, but the adaptor protein TOPBP1 is critically implicated in this process. Here, we identify CIP2A as a TOPBP1-interacting protein that regulates TOPBP1 localization specifically in mitosis. Cells lacking CIP2A display increased radio-sensitivity, micronuclei formation and chromosomal instability. CIP2A is actively exported from the cell nucleus in interphase but, upon nuclear envelope breakdown at the onset of mitosis, gains access to chromatin where it forms a complex with MDC1 and TOPBP1 to promote TOPBP1 recruitment to sites of mitotic DSBs. Collectively, our data uncover CIP2A-TOPBP1 as a mitosis-specific genome maintenance complex.


Conflict of interest statement

D.D. is a shareholder and advisor of Repare Therapeutics. The remaining authors declare no competing interests.

Figures

Fig. 1
Fig. 1. CIP2A is a TOPBP1 interaction partner.
a Schematic showing the layout of conserved domains and regions in TOPBP1. Key amino acids in the AAD (W1145) and BRCT7 (K1317) are indicated. Deletion constructs of TOPBP1 used in b, lacking either the C-terminal portion of the protein (ΔC), the region between BRCT5 and 6 (Δ751-899) and BRCT domain 6 (ΔBRCT6). b Localization of GFP-TOPBP1 wild type and mutants in mitotic cells after 1 Gy of IR and interphase cells after 3 Gy of IR. Displayed are maximum intensity projections of confocal z-stacks. All scalebars = 10 µm. c HA-immunoprecipitation from 293FT cells transfected with a HA-tagged TOPBP1 fragment spanning the entire region between BRCT5 and 6 (amino acids 740-899). d HA-immuno-precipitation of the TOPBP1 fragment in c with the purified GST-ArmRP of CIP2A. e Flag-immunoprecipitation from 293FT transfected with Flag-tagged full-length CIP2A and treated with 3 Gy of IR and Nocodazole as indicated. f Quantification of the experiment in e. Columns represent the mean ratio between TOPBP1 and Flag band intensities in the Flag-IP blots, error bars represent the SEM of four independent experiments. Source data are provided as a Source Data file.
Fig. 2
Fig. 2. CIP2A interacts with TOPBP1 at sites of DSBs in mitosis.
a Confocal micrograph (maximum intensity projection) of untreated U2OS cells, stained for TOPBP1 and CIP2A. Centrosomes are highlighted with white arrowheads. b Confocal micrograph (maximum intensity projection) of Nocodazole-arrested U2OS cells 1 h after irradiation with 1 Gy, stained for TOPBP1 and CIP2A. c Upper panels: confocal micrographs of interphase U2OS cells treated with 3 Gy and U2OS cells arrested in mitosis by Nocodazole and treated with 1 Gy. Lower panels: micrographs deconvoluted and segmented by SQUASSH d Quantitative analysis of CIP2A and TOPBP1 colocalization by SQUASSH. Left: object size colocalization (area of object overlap divided by total object area). Right: object number colocalization (fraction of objects in each channel that overlap ≥ 50%). Each data point represents one cell (n = 37; pooled from three independent experiments). Bars and error bars represent mean and SD. Statistical significance was assessed by two-sided unpaired t-tests (α = 0.05) e Airyscan high-resolution confocal image (maximum intensity projection) of CIP2A and TOPBP1 foci in mitosis 1 h after 1 Gy of IR. Scale bar in the merge panel: 5 µm; scale bar in the zoomed panels: 1 µm. f Quantification of CIP2A-TOPBP1 proximity by in situ PLA in U2OS cells transfected with either control siRNA (siCtrl) or TOPBP1 siRNA (siTOPBP1), arrested in mitosis by Nocodazole and mock treated or treated with 1 Gy of IR. Each data point represents one cell (n = 61; pooled from two independent experiments), and bars represent median. Statistical significance was assessed by Kruskal-Wallis test and Dunn’s multiple comparison test (α = 0.05; ns = not significant). All scale bars = 10 µm unless indicated otherwise. Source data are provided as a Source Data file.
Fig. 3
Fig. 3. TOPBP1 accumulation at sites of mitotic DSBs is dependent on CIP2A and vice versa.
a Western blots of total cell extract of parental RPE-1 cells, RPE-1 ΔCIP2A cells and stably transduced RPE-1 ΔCIP2A cells with empty vector (+empty) and vector containing Flag-tagged wild type CIP2A cDNA (+Flag-WT). b Confocal micrographs (maximum intensity projections) of Nocodazole-arrested empty vector (+Empty) and Flag-tagged CIP2A wild type (+Flag-WT) complemented RPE-1 ΔCIP2A cells, treated with 1 Gy of IR and stained for TOPBP1 and CIP2A. c Quantification of the experiment in b. Number of CIP2A/TOPBP1 foci per cell was assessed (+Empty: n = 57, +Flag-WT: n = 62, pooled from three independent experiments). Statistical significance was assessed with the two-sided Mann-Whitney test (α = 0.05) d Western blots of total cell extracts of CIP2A knock-out RPE-1 cells stably transduced with Flag-tagged wild type CIP2A cDNA (RPE-1 ΔCIP2A + Flag-WT) and transiently transfected with control siRNA (siCtrl) and two different siRNAs against TOPBP1 (siTOPBP1 #1 and siTOPBP1 #2). e Confocal micrographs (maximum intensity projection) of CIP2A knock-out RPE-1 cells stably transduced with Flag-tagged wild type CIP2A cDNA (RPE-1 ΔCIP2A + Flag-WT) and transiently transfected with control siRNA (siCtrl) and two different siRNAs against TOPBP1 (siTOPBP1 #1 and siTOPBP1 #2). Cells were arrested in pro-metaphase with Nocodazole, fixed 1 h after 1 Gy of IR and stained for CIP2A and TOPBP1. f Quantification of the experiment in e. Number of CIP2A foci per cell was assessed (siCtrl: n = 62, siTOPBP1 #1: n = 46, siTOPBP1 #2: n = 44, pooled from three independent experiments). Bars and error bars represent mean and SD. Statistical significance was assessed with the Kruskal-Wallis test and Dunn’s multiple comparison test (α = 0.05). All scale bars = 10 µm. Source data are provided as a Source Data file.
Fig. 4
Fig. 4. Two conserved sequence segments in TOPBP1 mediate its interaction with CIP2A.
a GFP-immunoprecipitation from 293FT cells either Mock transfected (Mock) or co-transfected with a GFP-tagged full-length TOPBP1 wild type (WT), and various deletion mutants as indicated, and Flag-tagged CIP2A. Relative intensities of co-immunoprecipitated Flag-CIP2A bands are indicated. b Confocal micrographs (maximum intensity projections) of Nocodazole-arrested GFP-TOPBP1 (WT and deletion mutants) expressing U2OS cells, treated with 1 Gy of IR. Endogenous TOPBP1 was depleted by 3′-UTR targeting TOPBP1 siRNA. c Quantification of GFP-TOPBP1/CIP2A foci per cell. Each data point represents one mitotic cell (WT: n = 29, ΔC: n = 30, Δ751–899: n = 31, Δ774–798: n = 31, Δ813–892: n = 30, Δ774–789 + Δ813-892: n = 32, pooled from three independent experiments). Statistical significance was assessed with the Kruskal-Wallis test and Dunn’s multiple comparison test (α = 0.05). All scale bars = 10 µm. Source data are provided as a Source Data file.
Fig. 5
Fig. 5. CIP2A-TOPBP1 recruitment to sites of mitotic DSBs is mediated by MDC1.
a Confocal micrographs (maximum intensity projections) of Nocodazole-arrested RPE-1 wild type, MDC1 knock-out (ΔMDC1) and CIP2A knock-out (ΔCIP2A) cells, irradiated with 1 Gy and stained for TOPBP1 and CIP2A. b Quantification of the experiment in a. CIP2A/TOPBP1 foci were manually counted. Each data point represents one mitotic cell (no IR WT: n = 52, ΔMDC1: n = 56, ΔCIP2A: n = 51, IR WT: n = 80, ΔMDC1: n = 61, ΔCIP2A: n = 53, pooled from three independent experiments) and bars represent the median. Statistical significance was assessed with the Kruskal-Wallis test and Dunn’s multiple comparison test (α = 0.05). c Flag-immunoprecipitation from 293FT cells transfected with Flag-tagged full-length CIP2A and HA-tagged MDC1 wild type (WT) and Ser168/Ser196 double mutant (S168A/S196A). d Quantification of CIP2A-MDC1 proximity by in situ PLA in U2OS wild type (WT) and U2OS MDC1 knock-out cells (ΔMDC1), arrested in mitosis by Nocodazole and mock treated or treated with 1 Gy of IR. Each data point represents one cell (WT -IR: n = 131, WT + IR: n = 114, ΔMDC1 -IR: n = 85, ΔMDC1 + IR n = 54, pooled from two independent experiments), and bars represent median. Statistical significance was assessed by Kruskal-Wallis test and Dunn’s multiple comparison test (α = 0.05). e Confocal micrographs (maximum intensity projections) of Nocodazole-arrested U2OS ΔMDC1 cells stably transfected with GFP-tagged wild type and S168A/S196A mutated MDC1, stained for CIP2A and TOPBP1 1 h treatment with 1 Gy of IR. f Quantitative analysis of GFP-MDC1 and CIP2A co-localization by SQUASSH: Left graph: object size colocalization (area of object overlap divided by total object area). Right graph: object number colocalization (fraction of objects in each channel that overlap ≥ 50%). Data points represent individual mitotic cells (n = 24, except S168A/196 A object number: n = 21, pooled from three independent experiments). Bars and error bars represent mean and SD. Statistical significance was assessed by unpaired t-tests with Welch’s correction (α = 0.05). Source data are provided as a Source Data file.
Fig. 6
Fig. 6. CIP2A controls TOPBP1 recruitment to sites of mitotic DSBs independently of PP2A.
a Western blots of total cell extract of RPE-1 wild type cells (WT) and RPE-1 CIP2A knock-out cells cells (ΔCIP2A) either Mock treated (-) or treated with the PP2A inhibitor LB-100. b GFP pull-down from 293FT cells transfected with GFP-tagged full-length MDC1 and either control siRNA (siCtrl) or siRNA against CIP2A (siCIP2A). All scale bars = 10 µm. Source data are provided as a Source Data file.
Fig. 7
Fig. 7. CRM1-dependent nuclear export sequesters CIP2A from TOPBP1 in interphase cells.
a Confocal micrographs (maximum intensity projections) of Leptomycin B, Selinexor and control DMSO treated U2OS cells, stained for CIP2A. b Quantification of nuclear CIP2A staining of the experiment in a. Each data point corresponds to one cell (DMSO: n = 173, LeptomycinB: n = 150, Selinexor: n = 178, pooled from two independent experiments). Bars and error bars represent mean and SD. Statistical significance was calculated using one-way ANOVA and Dunnett’s multiple comparison test (α = 0.05). c Confocal micrographs (maximum intensity projections) of RPE-1 ΔCIP2A cells and RPE-1 ΔCIP2A cells stably transduced with Flag-tagged full-length CIP2A (WT) and CIP2A deletion mutant (human CIP2A amino acids 561–625; ΔNES), stained for CIP2A. d Quantification of nuclear CIP2A staining of the experiment in c. Each data point corresponds to one cell (+Epmpty: n = 199, +Flag-WT: n = 155, +Flag-ΔNES: n = 165, pooled from two independent experiments). Bars and error bars represent mean and SD. Statistical significance between +Flag-WT and +Flag-ΔNES was calculated using two-sided Welch’s t-test (α = 0.05). e Flag-immunoprecipitation from 293FT cells either Mock transfected (Mock) or transfected with a Flag-tagged full-length CIP2A wild type (WT), and Flag-tagged CIP2A lacking amino acids 561-625 (ΔNES). Relative intensities of co-immunoprecipitated CRM1 bands are indicated. f Confocal micrograph (maximum intensity projection) of Hela cells expressing endogenous Clover-tagged LMNA and stained for CIP2A. g Quantification of CIP2A-TOPBP1 proximity by in situ PLA in U2OS cells transfected with control siRNA (siCtrl) and siRNA against TOPBP1 (siTOPBP1), arrested in mitosis by Nocodazole and treated with 1 Gy of IR. Interphase cells (I) were separated from mitotic cells (M) with an automatic image analysis pipeline, based on DAPI mean intensities. Each data point represents one cell (siCtrl I: n = 92, siCtrl M: n = 63, siTOPBP1 I: n = 138, siTOPBP1 M: n = 121; pooled from two independent experiments), and bars represent median. Statistical significance was assessed by Kruskal-Wallis test and Dunn’s multiple comparison test (α = 0.05). Source data are provided as a Source Data file.
Fig. 8
Fig. 8. CRM1 is dispensible for TOPBP1 recruitment in interphase.
a Confocal micrographs of unsynchronized of parental RPE-1 cells (RPE-1), RPE-1 CIP2A knock-out cells (RPE-1 ΔCIP2A) and RPE-1 ΔCIP2A cells stably transduced with empty vector (+ Empty), Flag-tagged wild type CIP2A ( + Flag-WT), treated with 3 Gy of IR and stained for TOPBP1. b Quantification of TOPBP1 foci mean intensity and number of TOPBP1 foci per nucleus in interphase parental RPE-1 cells, RPE-1 CIP2A knock-out cells (ΔCIP2A) and ΔCIP2A cells stably transduced with empty vector (+Empty) or Flag-tagged full-length CIP2A ( + Flag-WT). Each data point represents one cell (RPE-1: n = 200; ΔCIP2A: n = 144; +Empty: n = 128; +Flag-WT: n = 125; pooled from two independent experiments) bars and error bars left graph represent mean and SD, bars right graph represent median. Statistical significance in the left graph (mean intensities) was assessed by one-way ANOVA and Dunnett’s multiple comparison test. Statistical significance in the right graph (foci number) was assessed by Kruskal-Wallis test and Dunn’s multiple comparison test (α = 0.05) All scale bars = 10 µm. Source data are provided as a Source Data file.
Fig. 9
Fig. 9. Loss of CIP2A impairs maintenance of chromosomal stability during mitosis.
a Clonogenic survival analysis of IR treated RPE-1 wild type (WT) cells and RPE-1 CIP2A knock-out cells (ΔCIP2A). Data points represent the mean of 3 independent experiments, error bars represent the SD. Statistical significance was assessed by linear regression (α = 0.05). b Quantification of MNi formation, c quantification of CENPA positive (CENPA + ) and CENPA negative (CENPA-) as well as γH2AX positive (γH2AX + ) and γH2AX negative (γH2AX-) MNi, d quantification of residual γH2AX foci 24 h after irradiation of mitotic cells and e quantification of chromosomal aberrations in metaphase spreads in RPE-1 parental cells (RPE-1), RPE-1 MDC1 knock-out cells (RPE-1 ΔMDC1), RPE-1 CIP2A knock-out cells (RPE-1 ΔCIP2A) and RPE-1 CIP2A knock-out cells stably transduced with empty vector (+ empty) and Flag-tagged wild type CIP2A ( + Flag-WT). Columns in b represent mean of 3–4 independent experiments (RPE-1 ± IR, RPE-1 ΔMDC1 ± IR, + empty -IR, + Flag-WT -IR: n = 3, +empty +IR, + Flag-WT + IR: n = 4), data points represent percentage of cells with MNi in the experiments. Parts of whole are displayed for each cell line in c. The numbers of MNi assessed for each cell line (n) in c are indicated above each column. Each data point in d represents log of total γH2AX foci intensity per cell (RPE-1: n = 368; RPE-1 ΔMDC1: n = 330; +Empty: n = 219; +Flag-WT: n = 224), bars and error bars represent mean and SD. Statistical significance was assessed by one-way ANOVA and Sidak’s multiple comparison test (α = 0.05) ns: not significant. Aberrations in e were counted manually. Each data point represents one metaphase (RPE-1: n = 16, RPE-1 ΔMDC1: n = 12, RPE-1 ΔCIP2A: n = 19, +Empty: n = 13, +Flag-WT: n = 13), bars represent the median. Statistical significance was assessed by the Kruskal-Wallis test and Dunn’s multiple comparison test (α = 0.05). ns: not significant. f Examples of chromosomal aberrations in metaphase spreads derived from RPE-1 parental (RPE-1) and RPE-1 CIP2A knock-out cells (ΔCIP2A). Aberrations including single chromatid telomere loss, sister chromatid telomere loss, interstitial telomeres, telomere duplications and dicentric chromosomes are indicated with white arrowheads. For d, e: One representative of two independent experiments is shown. Source data are provided as a Source Data file.

References

    1. Jackson SP, Bartek J. The DNA-damage response in human biology and disease. Nature. 2009;461:1071–1078. doi: 10.1038/nature08467. - DOI - PMC - PubMed
    1. Hustedt N, Durocher D. The control of DNA repair by the cell cycle. Nat. Cell Biol. 2017;19:1–9. doi: 10.1038/ncb3452. - DOI - PubMed
    1. Fragkos M, Naim V. Rescue from replication stress during mitosis. Cell Cycle. 2017;16:613–633. doi: 10.1080/15384101.2017.1288322. - DOI - PMC - PubMed
    1. Liu Y, Nielsen CF, Yao Q, Hickson ID. The origins and processing of ultra fine anaphase DNA bridges. Curr. Opin. Genet Dev. 2014;26:1–5. doi: 10.1016/j.gde.2014.03.003. - DOI - PubMed
    1. Mankouri HW, Huttner D, Hickson ID. How unfinished business from S-phase affects mitosis and beyond. EMBO J. 2013;32:2661–2671. doi: 10.1038/emboj.2013.211. - DOI - PMC - PubMed

Publication types

MeSH terms