

Multisite implementation of a workflow-integrated machine learning system to optimize COVID-19 hospital admission decisions
- PMID: 35842519
- PMCID: PMC9287691
- DOI: 10.1038/s41746-022-00646-1
Multisite implementation of a workflow-integrated machine learning system to optimize COVID-19 hospital admission decisions
Abstract
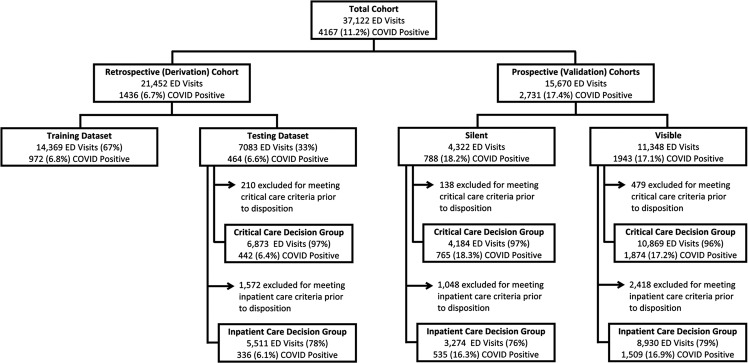
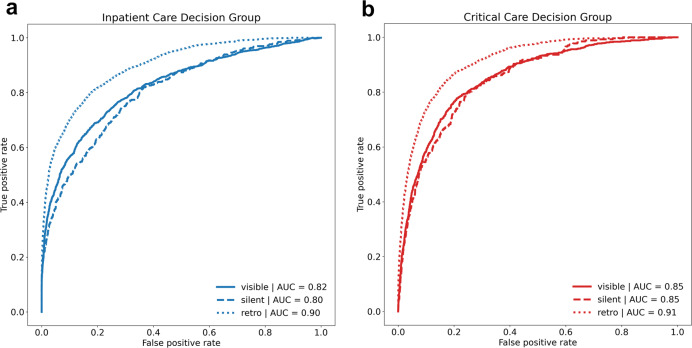
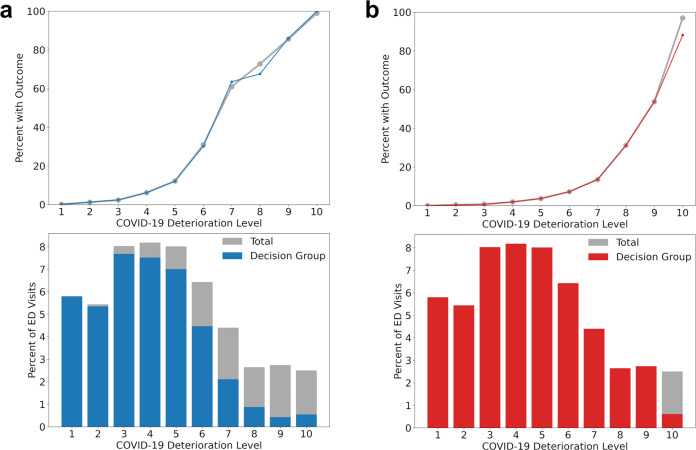
Demand has outstripped healthcare supply during the coronavirus disease 2019 (COVID-19) pandemic. Emergency departments (EDs) are tasked with distinguishing patients who require hospital resources from those who may be safely discharged to the community. The novelty and high variability of COVID-19 have made these determinations challenging. In this study, we developed, implemented and evaluated an electronic health record (EHR) embedded clinical decision support (CDS) system that leverages machine learning (ML) to estimate short-term risk for clinical deterioration in patients with or under investigation for COVID-19. The system translates model-generated risk for critical care needs within 24 h and inpatient care needs within 72 h into rapidly interpretable COVID-19 Deterioration Risk Levels made viewable within ED clinician workflow. ML models were derived in a retrospective cohort of 21,452 ED patients who visited one of five ED study sites and were prospectively validated in 15,670 ED visits that occurred before (n = 4322) or after (n = 11,348) CDS implementation; model performance and numerous patient-oriented outcomes including in-hospital mortality were measured across study periods. Incidence of critical care needs within 24 h and inpatient care needs within 72 h were 10.7% and 22.5%, respectively and were similar across study periods. ML model performance was excellent under all conditions, with AUC ranging from 0.85 to 0.91 for prediction of critical care needs and 0.80-0.90 for inpatient care needs. Total mortality was unchanged across study periods but was reduced among high-risk patients after CDS implementation.
© 2022. The Author(s).
Conflict of interest statement
J.H., S.L., and M.T. have equity interests in a company (StoCastic, LLC) that develops clinical decision support tools. Johns Hopkins University also owns equity in the company. StoCastic played no role in this study and no technology owned or licensed by StoCastic was used. The remaining authors declare no Competing Financial or Non-Financial interests.
Figures

References
-
- Johns Hopkins Coronavirus Resource Center. COVID-19 Dashboard by the Center for Systems Science and Engineering (CSSE) at Johns Hopkins University (JHU). https://coronavirus.jhu.edu/us-map (accessed 28 April 28 2020).
-
- Ranney, M. L., Griffeth, V., Jha, A. K. Critical supply shortages—the need for ventilators and personal protective equipment during the Covid-19 pandemic. N. Engl. J. Med. 10.1056/NEJMp2006141 (2020). - PubMed
-
- Emanuel, E. J. et al. Fair allocation of scarce medical resources in the time of Covid-19. N. Engl. J. Med.10.1056/NEJMsb2005114 (2020). - PubMed
-
- Centers for Disease Control and Prevention. SARS-CoV-2 B.1.1.529 (Omicron) Variant—United States, December 1–8, 2021 (2021). 10.15585/mmwr.mm7050e1 (Accessed 15 Dec 2021).
-
- Marcozzi, D., Carr, B., Liferidge, A., Baehr, N. & Browne, B. Trends in the contribution of emergency departments to the provision of hospital-associated health care in the USA. Int. J. Health Serv.10.1177/0020731417734498 (2017). - PubMed
Grants and funding
LinkOut - more resources
Full Text Sources
