. 2022 Jul 16;28(1):81.
doi: 10.1186/s10020-022-00507-3.

H19 inhibition increases HDAC6 and regulates IRS1 levels and insulin signaling in the skeletal muscle during diabetes

Affiliations

H19 inhibition increases HDAC6 and regulates IRS1 levels and insulin signaling in the skeletal muscle during diabetes

Amit Kumar et al. Mol Med. .

Abstract

Background: Histone deacetylases (HDACs) that catalyze removal of acetyl groups from histone proteins, are strongly associated with several diseases including diabetes, yet the precise regulatory events that control the levels and activity of the HDACs are not yet well elucidated.

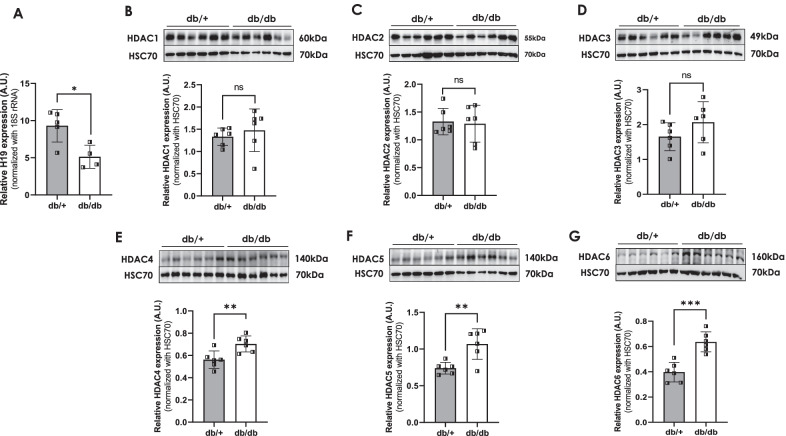
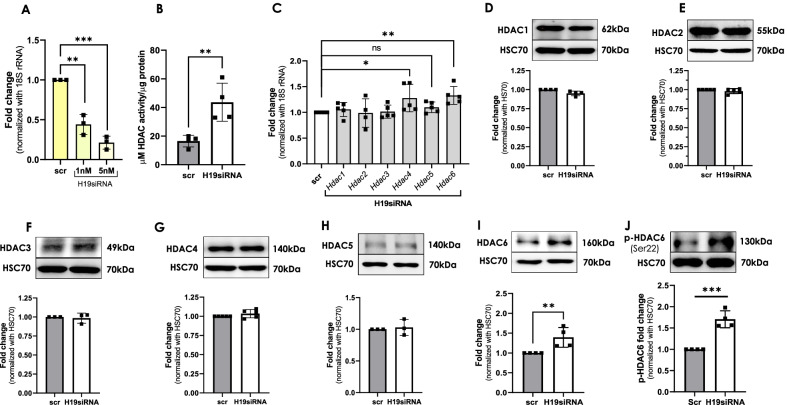
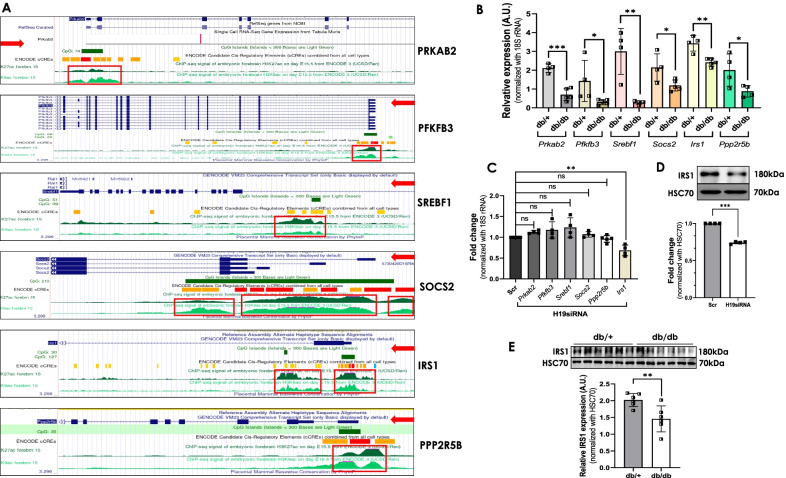
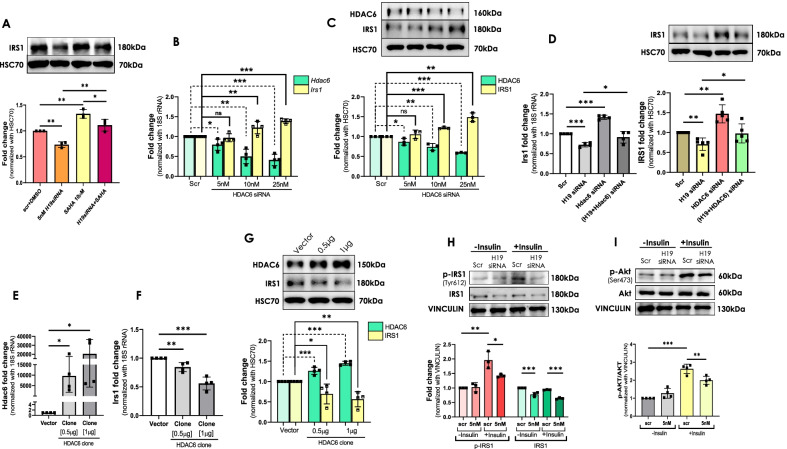
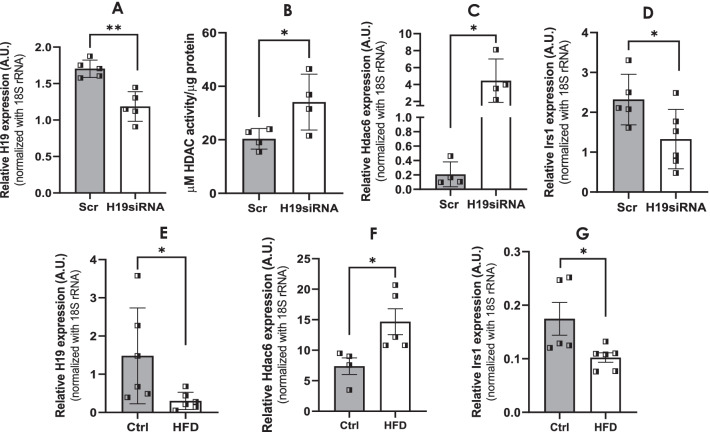
Methods: Levels of H19 and HDACs were evaluated in skeletal muscles of normal and diabetic db/db mice by Western Blot analysis. C2C12 cells were differentiated and transfected with either the scramble or H19 siRNA and the levels of HDACs and Prkab2, Pfkfb3, Srebf1, Socs2, Irs1 and Ppp2r5b were assessed by Western Blot analysis and qRT-PCR, respectively. Levels of H9, HDAC6 and IRS1 were evaluated in skeletal muscles of scramble/ H19 siRNA injected mice and chow/HFD-fed mice.

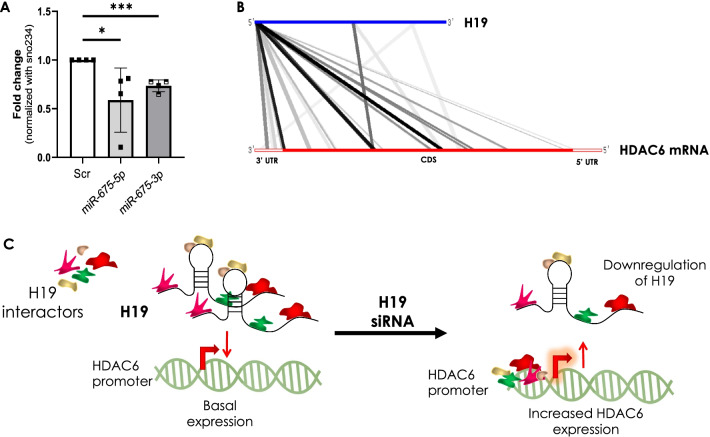
Results: Our data show that the lncRNA H19 and HDAC6 exhibit inverse patterns of expression in the skeletal muscle of diabetic db/db mice and in C2C12 cells, H19 inhibition led to significant increase in HDAC activity and in the levels of HDAC6, both at the transcript and protein levels. This was associated with downregulation of IRS1 levels that were prevented in the presence of the HDAC inhibitor, SAHA, and HDAC6 siRNA suggesting the lncRNA H19-HDAC6 axis possibly regulates cellular IRS1 levels. Such patterns of H19, HDAC6 and IRS1 expression were also validated and confirmed in high fat diet-fed mice where as compared to normal chow-fed mice, H19 levels were significantly inhibited in the skeletal muscle of these mice and this was accompanied with elevated HDAC6 levels and decreased IRS1 levels. In-vivo inhibition of H19 led to significant increase in HDAC6 levels and this was associated with a decrease in IRS1 levels in the skeletal muscle.

Conclusions: Our results suggest a critical role for the lncRNA H19-HDAC6 axis in regulating IRS1 levels in the skeletal muscle during diabetes and therefore restoring normal H19 levels might hold a therapeutic potential for the management of aberrant skeletal muscle physiology during insulin resistance and type 2 diabetes.

Keywords: Diabetes; Epigenetics; HDAC6; IRS1; Insulin resistance; Skeletal muscle; lncRNA H19.


Conflict of interest statement

None to declare.

Figures

Fig. 1
Fig. 1
Expression of lncRNA H19 and HDACs in db/db mice skeletal muscle. A Total RNA was isolated from the skeletal muscle of normal (db/ +) and diabetic (db/db) mice and 1 µg RNA was reverse transcribed and subjected to qRT-PCR to assess the transcript levels of the lncRNA H19. 18S rRNA was used as the loading control. Skeletal muscle of normal (db/ +) and diabetic (db/db) mice were lysed as described in the “Material and methods” section and 20–30 µg lysates were run on SDS-PAGE and the levels of HDAC 1–6 were evaluated by Western Blot analysis. HSC70 was used as the loading control. Densitometric analyses of the expression are shown in the panel below (BG). All experiments were performed in at least four animals in each group, values are means ± SD. *p ≤ 0.05; **p ≤ 0.01; ***p ≤ 0.001
Fig. 2
Fig. 2
H19 inhibition regulates HDAC6 levels in C2C12 cells. A Differentiated C2C12 cells were transfected with either the scramble or H19 siRNA (1–5 nM) and after 48 h, total RNA was isolated and the transcript levels of H19 were assessed by qRT-PCR. 18S rRNA was used as the loading control. B Differentiated C2C12 cells were transfected with either the scramble or H19 siRNA as in “A” and after 48 h, cells were lysed and 90 µg cell lysates were used to assay HDAC activity as described in the “Material and methods” section. HDAC activity is expressed as µM of substrate deacetylated per µg of protein. C Total RNA was isolated from the C2C12 cells transfected as in “A” and the transcript levels of HDAC 1–6 were evaluated by qRT-PCR. 18S rRNA was used as the loading control. C2C12 cells transfected as in “A” were lysed and lysates (20–30 µg) were subjected to Western Blot analyses to evaluate the levels of HDAC 1–6. HSC70 was used as the loading control (DI). J 20 µg of lysate from scramble and H19 siRNA transfected C2C12 cells was subjected to western blot analysis to probe the expression of pHDAC6-Ser22. HSC70 was used as the loading control. Figures presented are representative images and values are means ± SD of at least three independent experiments. *p ≤ 0.05; **p ≤ 0.01; ***p ≤ 0.001; ns: non-significant
Fig. 3
Fig. 3
Schematic representation of potential regulatory mechanisms of HDAC6 by lncRNA H19. A Differentiated C2C12 cells were transfected with either the scramble or H19 siRNA (5 nM) and after 48 h, total RNA was isolated and the levels of miR-675-5p and miR-675-3p were assessed by qRT-PCR. Sno-234 was used as the loading control. Data are means of at least three independent experiments and values are means ± SD. *p ≤ 0.05, ***p ≤ 0.001. B Potential binding between the lncRNA H19 and HDAC6 mRNA as derived from the online LncRRIsearch prediction tool. UTR: Untranslated Region; CDS: Coding DNA sequence. C Binding of H19 to its interactors might prevent their occupancy on the HDAC6 promoter, thereby preventing its transcription. In the absence or decreased levels of H19, the interactors get free to bind to their potential binding elements on the HDAC6 promoter to increase HDAC6 gene transcription
Fig. 4
Fig. 4
LncRNA H19 inhibition decreases IRS1 levels in C2C12 cells. A Putative acetylation marks as identified on the regulatory promoter regions of PRKAB2, PFKFB3, SREBF1, SOCS2, IRS1 and PPP2R5B using the UCSC genome database. Regions enclosed within the red box upstream to each gene represent the site with potential histone acetylation (K9 and K27) marks, red arrows represent the orientation of the gene. B Total RNA was isolated from skeletal muscle tissues of normal db/ + and diabetic db/db mice (n = 4) and 1 µg RNA was reverse transcribed and transcript levels of Prkab2, Pfkfb3, Srebf1, Socs2, Irs1 and Ppp2r5b were evaluated by qRT-PCR. 18S rRNA was taken as the normalization control. C C2C12 cells were differentiated and transfected with either the scramble or H19 siRNA (5 nM) and after 48 h, total RNA was isolated, reverse transcribed and the transcript levels of Prkab2, Pfkfb3, Srebf1, Socs2, Irs1 and Ppp2r5b were assessed using gene specific primers. 18S rRNA was taken as the endogenous control. Experiments were done in at least four independent sets. D Cells transfected as in “C” were lysed and 20–30 µg protein was run on SDS-PAGE and subjected to Western Blot analysis using anti-IRS1 antibody. HSC70 was taken as the loading control. Experiments were done in four independent sets. E Skeletal muscle tissue lysates (30 µg) of normal db/ + and diabetic db/db mice (n = 6) were subjected to Western Blot analysis using anti-IRS1 antibody. HSC70 was taken as the loading control. Given below is the densitometric analysis of the normalized values of six mice in each group. Values presented are means ± SD of four independent experiments. *p ≤ 0.05; **p ≤ 0.01; ***p ≤ 0.001¸ns: non-significant
Fig. 5
Fig. 5
H19 inhibition regulates IRS1 levels in HDAC6 dependent manner and impairs insulin signaling in C2C12 cells. A Differentiated C2C12 cells were transfected with the scramble or H19 siRNA (5 nM) and treated with wither DMSO or the HDAC inhibitor, SAHA (10 µM). On termination of incubation (24 h), cells were lysed and 30 µg protein was resolved on SDS-PAGE and subjected to Western Blot analysis using anti-IRS1 antibody. HSC70 was used as the loading control. The blot presented is a representative blot and given below is the densitometric analysis of three independent experiments. B Differentiated C2C12 cells were transfected with either scramble or HDAC6 siRNA (5–25 nM) and after 48 h of transfection, cells were lysed and 1 μg of total RNA was reverse transcribed and the transcript levels of Hdac6 and Irs1 were detected by qRT-PCR. 18S rRNA was taken as the endogenous control. C Differentiated C2C12 cells were transfected as in “B” and after 48 h of transfection, 20 µg of protein was resolved on SDS-PAGE and probed using anti-HDAC6 and anti-IRS1 antibodies. HSC70 was used as the loading control. The blot presented is a representative figure and given below is the densitometric analysis of three independent experiments. D Differentiated C2C12 cells were transfected with the scramble or H19 siRNA (5 nM) alone or together with HDAC6 siRNA (25 nM). After 48 h of transfection, cells were lysed and 1 μg of total RNA was reverse transcribed and the transcript levels of Irs1 were determined by qRT-PCR. 18S rRNA was taken as the endogenous control. Also, after a similar transfection, 20 µg of protein from scramble or H19 siRNA alone or together with HDAC6 siRNA transfected cells was resolved on SDS-PAGE and probed using anti-IRS1 antibody. HSC70 was used as the loading control. The blot presented is a representative figure and given below is the densitometric analysis of at least five independent experiments. C2C12 cells were transfected with either control vector or HDAC6 cloned vector (0.5 µg and 1 μg) and 48 h post-transfection, cells were lysed and the transcript levels of Hdac6 (E) or Irs1 (F) were determined by qRT-PCR. 18S rRNA was used as the endogenous control. G Differentiated C2C12 cells were transfected with either control vector or HDAC6 overexpression vector (0.5 µg and 1 μg) and 48 h post-transfection, cells were lysed and 20 µg lysate was resolved on SDS-PAGE and probed using anti-HDAC6 and anti-IRS1 antibody. HSC70 was used as the loading control. The blot presented is a representative figure and given below is the densitometric analysis of four independent biological replicates. Differentiated C2C12 cells were transfected with either the scramble or H19 siRNAs and after 48 h of transfection, cells were treated with insulin (100 nM, 20 min). On termination of incubation, cells were lysed and probed for IRS1, pIRS1 (H) and Akt, pAkt (I) protein levels by Western Blot analysis using specific antibodies. Vinculin was taken as the loading control. All experiments were done at least thrice and densitometric analyses of the same are provided. Values are means ± SD. *p ≤ 0.05; **p ≤ 0.01; ***p ≤ 0.001
Fig. 6
Fig. 6
In-vivo H19 inhibition alters HDAC6 and IRS1 levels in the skeletal muscle of mice. A Mice were injected (i.v) with either the scramble or H19 siRNA (3 mg/kg body weight) as described in a previous study. Skeletal muscle tissues were isolated and the levels of H19 were analyzed by qRT-PCR. 18S rRNA was taken as the normalization control. B Skeletal muscle tissues from scramble and H19 siRNA injected mice were lysed and 90 µg of tissue was assayed for HDAC activity as described in the “Materials and methods” section. Values obtained were normalized to the total protein content. Total RNA (1 µg) isolated from skeletal muscle tissues of both groups of mice was reverse transcribed and the transcript levels of Hdac6 (C) and Irs1 (D) were assessed by qRT-PCR. 18S rRNA was taken as the loading control. Mice were fed either chow diet or high fat diet and after 6 months, skeletal muscle tissues were isolated total RNA extracted (1 µg), was reverse transcribed and the transcript levels of H19 (E), Hdac6 (F) and Irs1 (G) were evaluated by qRT-PCR. 18S rRNA was used as the loading control. Values presented are means ± SD of at least four animals in each group. *p ≤ 0.05; **p ≤ 0.01

References

    1. Ayub ALP, D’Angelo Papaiz D, Roseli da Silva S, Miriam GJ. The function of lncRNAs as epigenetic regulators. In Non-Coding RNAs. 2019.
    1. Bhan A, Mandal SS. LncRNA HOTAIR: a master regulator of chromatin dynamics and cancer. Biochim Biophys Acta. 2015;1856:151–164. - PMC - PubMed
    1. Cai Q, et al. Long non-coding RNA UCA1 promotes gallbladder cancer progression by epigenetically repressing p21 and E-cadherin expression. Oncotarget. 2017;8:47957–47968. doi: 10.18632/oncotarget.18204. - DOI - PMC - PubMed
    1. Cai L, et al. Genome-wide association analysis of type 2 diabetes in the EPIC-InterAct study. Sci Data. 2020;7:393. doi: 10.1038/s41597-020-00716-7. - DOI - PMC - PubMed
    1. Christensen DP, et al. Histone deacetylase (HDAC) inhibition as a novel treatment for diabetes mellitus. Mol Med. 2011;17:378–390. doi: 10.2119/molmed.2011.00021. - DOI - PMC - PubMed

Publication types

MeSH terms