Observational Study
. 2022 Jul 17;22(1):187.
doi: 10.1186/s12911-022-01931-5.

Predicting the outcome for COVID-19 patients by applying time series classification to electronic health records

Collaborators, Affiliations
Observational Study

Predicting the outcome for COVID-19 patients by applying time series classification to electronic health records

Davi Silva Rodrigues et al. BMC Med Inform Decis Mak. .

Abstract

Background: COVID-19 caused more than 622 thousand deaths in Brazil. The infection can be asymptomatic and cause mild symptoms, but it also can evolve into a severe disease and lead to death. It is difficult to predict which patients will develop severe disease. There are, in the literature, machine learning models capable of assisting diagnose and predicting outcomes for several diseases, but usually these models require laboratory tests and/or imaging.

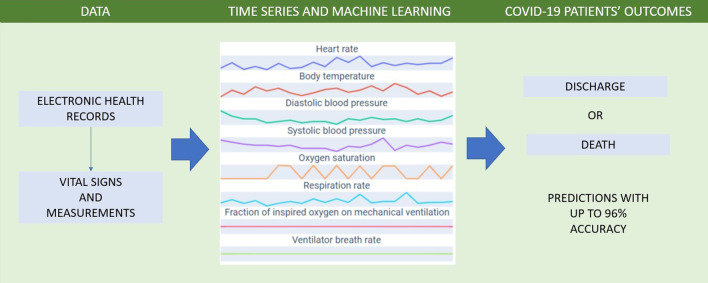
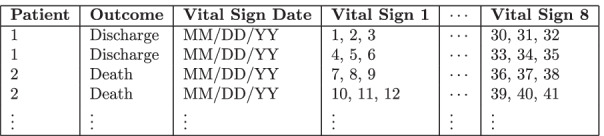
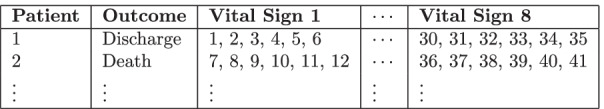
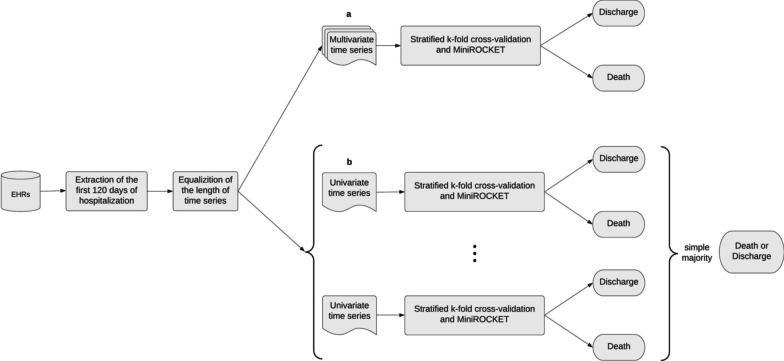
Methods: We conducted a observational cohort study that evaluated vital signs and measurements from patients who were admitted to Hospital das Clínicas (São Paulo, Brazil) between March 2020 and October 2021 due to COVID-19. The data was then represented as univariate and multivariate time series, that were used to train and test machine learning models capable of predicting a patient's outcome.

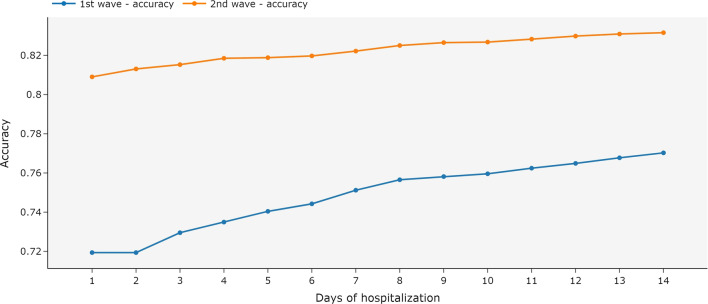
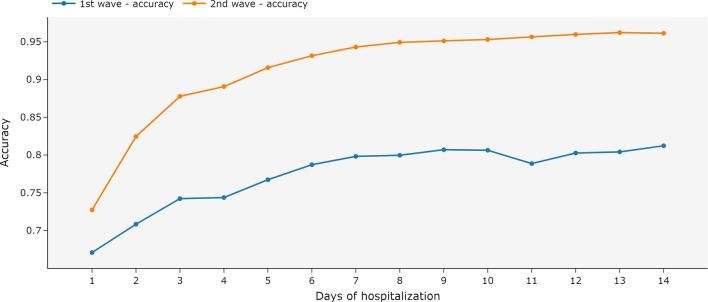
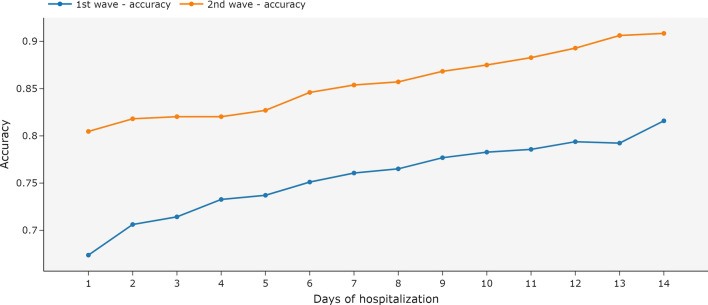
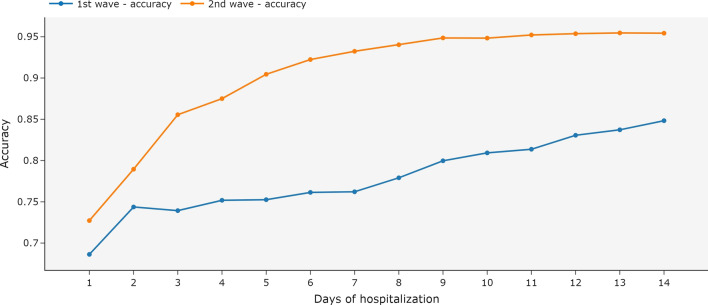
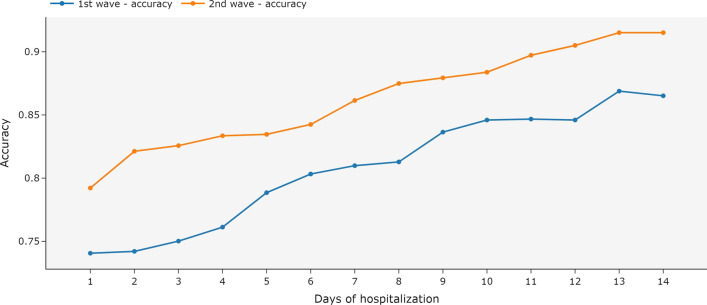
Results: Time series-based machine learning models are capable of predicting a COVID-19 patient's outcome with up to 96% general accuracy and 81% accuracy considering only the first hospitalization day. The models can reach up to 99% sensitivity (discharge prediction) and up to 91% specificity (death prediction).

Conclusions: Results indicate that time series-based machine learning models combined with easily obtainable data can predict COVID-19 outcomes and support clinical decisions. With further research, these models can potentially help doctors diagnose other diseases.

Keywords: COVID-19; Outcome prediction; Time series classification; Vital signs.


Conflict of interest statement

The authors declare that they have no competing interests.

Figures

Fig. 1
Fig. 1
Methods for predicting severe COVID-19 patients’ outcome
Fig. 2
Fig. 2
Example of independent days of hospitalization data modelling
Fig. 3
Fig. 3
Example of complete hospitalization history data modelling
Fig. 4
Fig. 4
Overview of the 144 time series models that were trained and tested in this work
Fig. 5
Fig. 5
Flowchart of the univariate and multivariate time series classification method
Fig. 6
Fig. 6
Metrics for an ensemble of MiniRocket models using independent days of hospitalization and univariate time series. The ensemble was trained with all available data and tested with the data available until each day of hospitalization. The first COVID-19 wave is the period between March 2020 and December 2020. The second wave is the period between January 2021 and October 2021
Fig. 7
Fig. 7
Accuracy for an ensemble of MiniRocket models using complete hospitalization history and univariate time series by day of hospitalization. The ensemble was trained with the complete hospitalization history and tested with the data available until each day of hospitalization. The first COVID-19 wave is the period between March 2020 and December 2020. The second wave is the period between January 2021 and October 2021
Fig. 8
Fig. 8
Accuracy for an ensemble of MiniRocket models using complete hospitalization history and univariate time series by day of hospitalization. The ensemble was trained and tested with the data available until each day of hospitalization. The first COVID-19 wave is the period between March 2020 and December 2020. The second wave is the period between January 2021 and October 2021
Fig. 9
Fig. 9
Metrics for MiniRocket models using independent days of hospitalization and multivariate time series. The model was trained with all available data and tested with the data available until each day of hospitalization. The first COVID-19 wave is the period between March 2020 and December 2020. The second wave is the period between January 2021 and October 2021
Fig. 10
Fig. 10
Accuracy for MiniRocket models using complete hospitalization history and multivariate time series by day of hospitalization. The models were trained with the complete hospitalization history and tested with the data available until each day of hospitalization. The first COVID-19 wave is the period between March 2020 and December 2020. The second wave is the period between January 2021 and October 2021
Fig. 11
Fig. 11
Accuracy for MiniRocket models using complete hospitalization history and multivariate time series by day of hospitalization. The models were trained and tested with the data available until each day of hospitalization. The first COVID-19 wave is the period between March 2020 and December 2020. The second wave is the period between January 2021 and October 2021
Fig. 12
Fig. 12
Intersection between predictions made by an ensemble of univariate time series models and by multivariate time series models with independent days of hospitalization. Intersection of correct outcome predictions (left) and incorrect predictions (right) with data regarding the first COVID-19 wave from March 2020 to December 2020 (a) and the second wave from January 2021 to October 2021 (b)
Fig. 13
Fig. 13
Intersection between predictions made by an ensemble of univariate time series models and by multivariate time series models with complete hospitalization history. Intersection of correct outcome predictions (left) and incorrect predictions (right) with data regarding the first COVID-19 wave from March 2020 to December 2020 (a) and the second wave from January 2021 to October 2021 (b)

References

    1. WHO. World Health Organisation Coronavirus (COVID-19) Dashboard. https://covid19.who.int/. Accessed 25 Jan 2022.
    1. Hatmi ZN. A systematic review of systematic reviews on the COVID-19 pandemic. SN Compr Clin Med. 2021;3(2):419–436. doi: 10.1007/s42399-021-00749-y. - DOI - PMC - PubMed
    1. Wolf JM, Kipper D, Borges GR, Streck AF, Lunge VR. Temporal spread and evolution of SARS-CoV-2 in the second pandemic wave in Brazil. J Med Virol. 2021 doi: 10.1002/jmv.27371. - DOI - PMC - PubMed
    1. Perondi B, Miethke-Morais A, Montal AC, Harima L, Segurado AC. Setting up hospital care provision to patients with COVID-19: lessons learnt at a 2400-bed academic tertiary center in São Paulo, Brazil. Braz J Infect Dis. 2020;24(6):570–574. doi: 10.1016/j.bjid.2020.09.005. - DOI - PMC - PubMed
    1. McKinney SM, Sieniek M, Godbole V, Godwin J, Antropova N, Ashrafian H, Back T, Chesus M, Corrado GS, Darzi A, Etemadi M, Garcia-Vicente F, Gilbert FJ, Halling-Brown M, Hassabis D, Jansen S, Karthikesalingam A, Kelly CJ, King D, Ledsam JR, Melnick D, Mostofi H, Peng L, Reicher JJ, Romera-Paredes B, Sidebottom R, Suleyman M, Tse D, Young KC, De Fauw J, Shetty S. International evaluation of an AI system for breast cancer screening. Nature. 2020;577(7788):89–94. doi: 10.1038/s41586-019-1799-6. - DOI - PubMed

Publication types