. 2022 Jul 18;21(1):145.
doi: 10.1186/s12934-022-01870-w.

Optimization of the production process for the anticancer lead compound illudin M: process development in stirred tank bioreactors

Affiliations

Optimization of the production process for the anticancer lead compound illudin M: process development in stirred tank bioreactors

Lillibeth Chaverra-Muñoz et al. Microb Cell Fact. .

Abstract

Background: The fungal natural products illudin S and M have been investigated as precursors for the development of semisynthetic anticancer agents such as Irofulven (illudin S derivative) which is currently in phase II clinical trials. Recently, illudin M derivatives have shown improved in vitro selectivity towards cancer cells encouraging further investigation. This requires a stable supply of the precursor which is produced by Basidiomycota of the genus Omphalotus. We have recently reported a robust shake flask process for the production of gram quantities of illudin M from Omphalotus nidiformis aiming to transfer that process into stirred tank bioreactors, which can be used in a commercial production set-up. However, process transfer across different systems is not straightforward and particularly challenging when the producer is morphologically complex. There are only a few reports that address the development of bioprocesses for the production of compounds from Basidiomycota as these organisms have not been extensively studied because of their complex life cycles and often are difficult to cultivate under laboratory conditions.

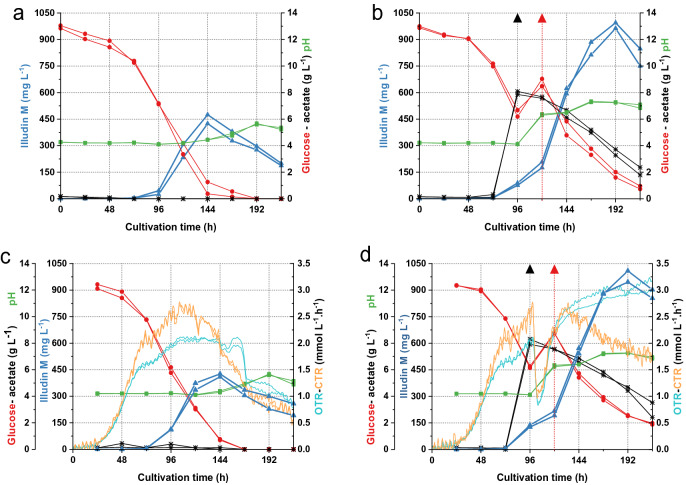
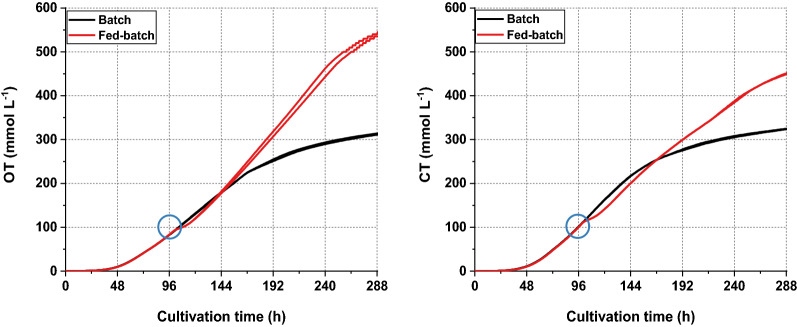
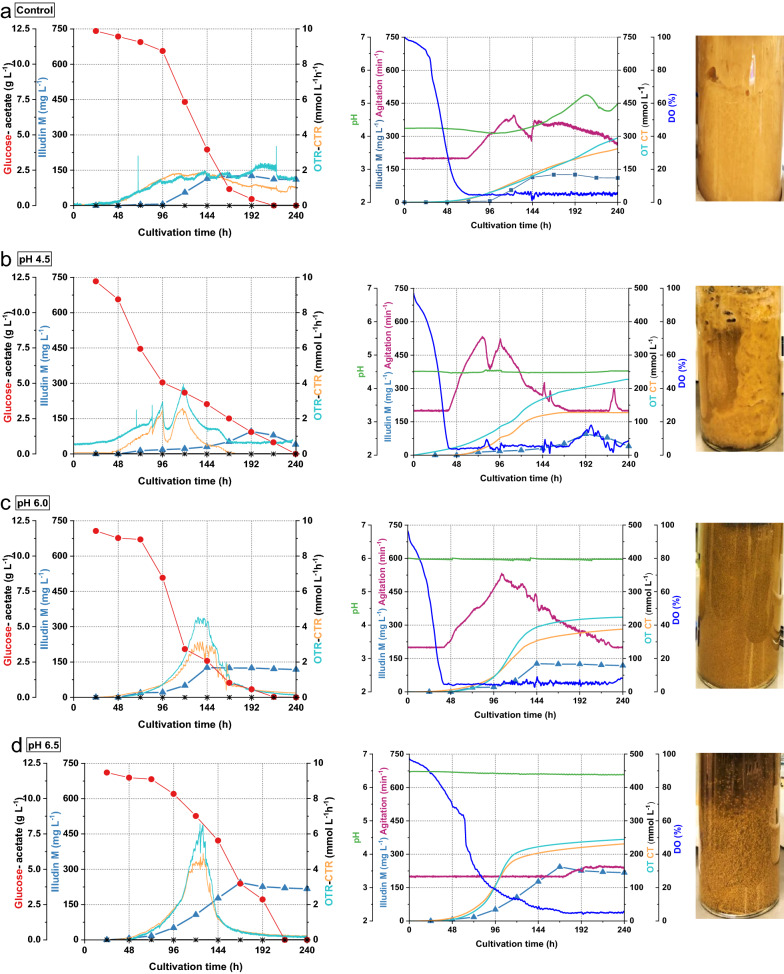
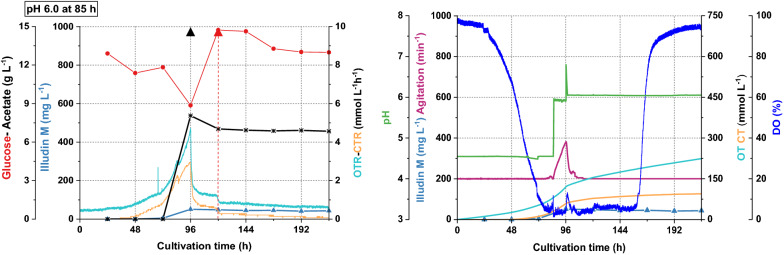
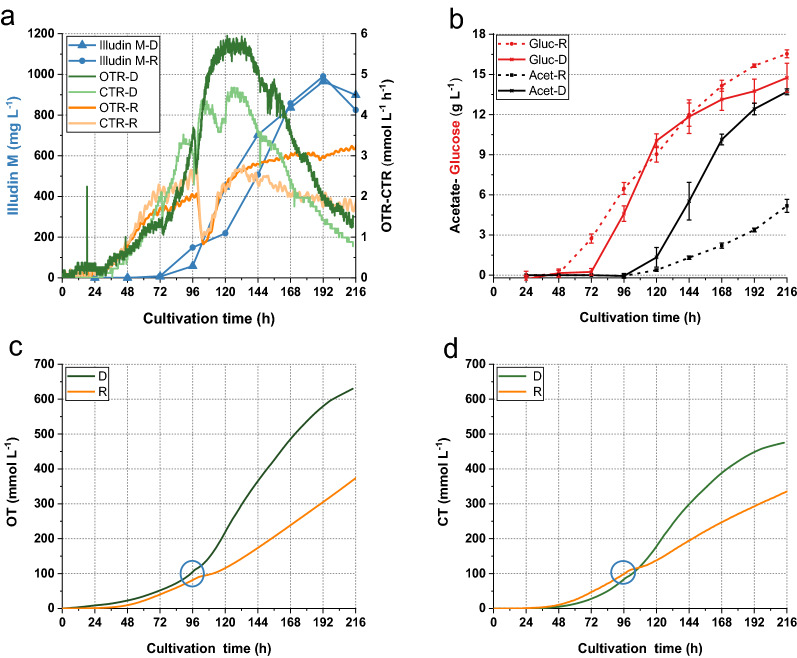
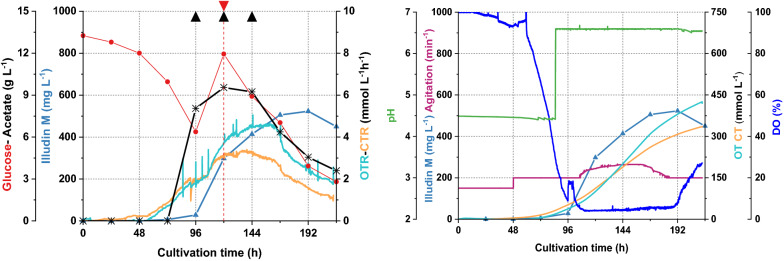
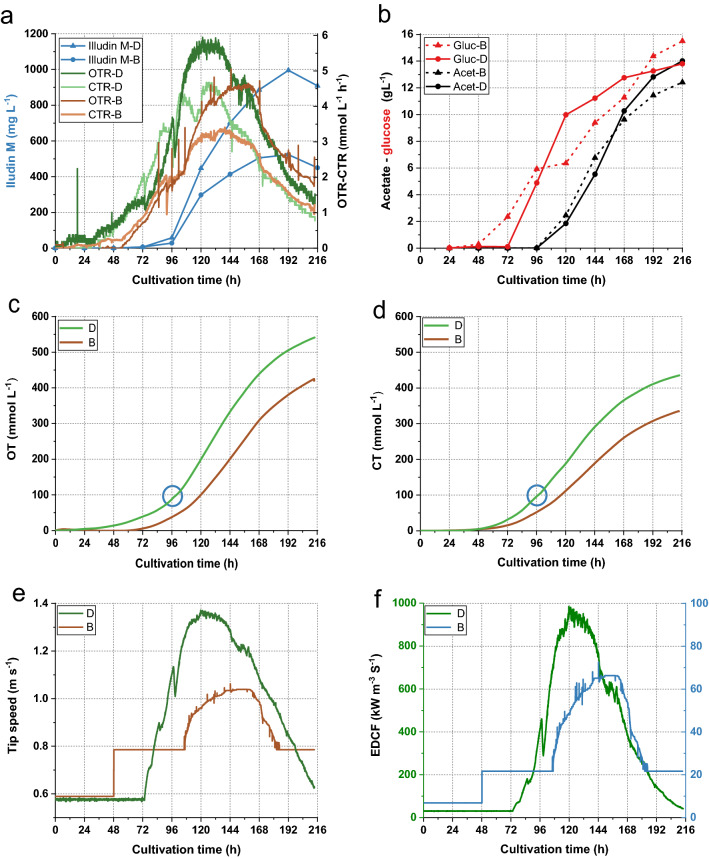
Results: The recently developed shake flask process delivering stable titers of ~ 940 mg L-1 of illudin M was investigated using off-gas analysis to identify critical parameters which facilitated the transfer from shaken into stirred tank bioreactors. Comparable titers to the shake flask process were achieved in 2 L stirred tank bioreactors (1.5 L working volume) by controlling growth of biomass with a carefully timed pH-shift combined with an improved precursor-feeding strategy. A scale-up experiment in a 15 L bioreactor (10 L working volume), resembling the process at 1.5 L resulted in 523 mg L-1 and is the starting point for optimization of the identified parameters at that scale.

Conclusion: By identifying and controlling key process parameters, the production process for illudin M was transferred from shake flasks into 2 L stirred tank bioreactors reaching a comparable titer (> 900 mg L-1), which is significantly higher than any previously reported. The insights obtained from 10 L scale pave the way towards further scale-up studies that will enable a sustainable supply of illudin M to support preclinical and clinical development programs.

Keywords: Acetate feed; Anticancer molecules; Basidiomycota; Bioprocess optimization; DASGIP; Fungal biotechnology; Natural products; RAMOS.


Conflict of interest statement

The authors declare no competing interests.

Figures

Fig. 1
Fig. 1
Process kinetics from cultivations in standard shake flasks and RAMOS flasks for production of illudin M with O. nidiformis. Experiments in conventional Erlenmeyer flasks: a batch process used as control, b optimized fed-batch process. Experiments in RAMOS flasks: c batch process used as control, d optimized fed-batch process. The fed-batch cultivations were fed with acetate (8 g L−1) at 96 h indicated with a black triangle and glucose (6 g L−1) at 120 h indicated with a red triangle. All curves illustrating the course of different process parameters are colored according to the color of the axis labels. The highest measured concentration of illudin M in the batch cultivations was ~ 420 mg L−1 at 144 h and in the fed-batch ~ 1000 mg L−1 at 192 h. Illudin M titers were derived from cell free culture supernatant
Fig. 2
Fig. 2
Comparison of CO2 production on O2 consumption in batch and fed-batch cultivations. The curves indicate the OT andCT obtained from duplicate experiments. The red curves illustrate the fed-batch data and the black curves illustrate the data from the batch cultivation indicating a lower O2 consumption and CO2 production in the batch process. The blue circle highlights the time of feeding
Fig. 3
Fig. 3
Process kinetics from uncontrolled and pH controlled cultivations in stirred tanks (1.5 L) and culture appearance at harvest time. All cultures were prepared with O. nidiformis cultivated in G13.5/C7 medium at 23 °C, aeration 0.3 vvm (27 sL h−1) and dissolved oxygen (DO) was maintained at 5% by increasing the stirring speed. a No pH control b pH 4.5 c pH 6.0 and d pH6.5. All curves illustrating the course of different process parameters are colored according to the color of the axis labels. Illudin M titers were derived from cell free culture supernatant. The concentration of wet biomass at harvest was as follows for a 45.83 g L−1; b 40.81 g L−1; c 23.59 g L−1 and c 18.07 g L−1
Fig. 4
Fig. 4
Process kinetics of a 1.5 L cultivation in a stirred tank where pH was shifted from pH 4.5 to pH 6.0 prior acetate feeding. The culture was prepared with O. nidiformis cultivated in G13.5/C7 medium at 23 °C, aeration 0.3 vvm (27 sL h−1) and dissolved oxygen (DO) was maintained at 5% by increasing the stirring speed. The pH was shifted to pH 6.0 at 85; acetate (8 g L−1) was fed at 96 h indicated with a black triangle and glucose (6 g L−1) was fed at 120 h indicated with a red triangle. All curves illustrating the course of the different process parameters are colored according to the colors of the axis labels. The sharp decrease of OTR and CTR after 96 h and the low productivity indicated inhibitory effects of the concentration of undissociated acetate at pH 6.0 under the applied conditions. Illudin M titers were derived from cell free culture supernatant
Fig. 5
Fig. 5
Comparison of highest product titers measured from stirred tank cultivations (1.5 L) where pH was shifted from pH 4.5 to pH 6.5 at different cultivation times. The scatter plot illustrates the concentrations of illudin M plotted against shift time, at the time of maximum productivity that in all cases occurred at 192 h regardless acetate availability or depletion. Illudin M titers were derived from cell free culture supernatant
Fig. 6
Fig. 6
Comparison of highest product titers measured in stirred tank cultivations (1.5 L) where pH was shifted from pH 4.5 to pH 6.5 or to pH 6.8 at different cultivation times. The scatter plot illustrates the concentrations of illudin M at the time of maximum productivity (192 h) plotted against the shift time. The green and blue dots indicate the shift to pH 6.5 and pH 6.8 respectively as labelled in the plot. Illudin M titers were derived from cell free culture supernatant
Fig. 7
Fig. 7
Contour plot derived from experimental data illustrating the influence of different pH values and corresponding shift time on illudin M titers. Background colors from blue to yellow indicate increasing illudin M titers, underlined by grey contour lines derived from the second order model built in R with the lm library. Model summary: Multiple R2: 0.8653, Adjusted R2: 0.753 and F-statistic: 7.707 on 5 and 6 DF, p-value: 0.01368. A maximum was calculated at shift time: 87.64 h and pH 6.64. Blue dots indicate the pH and shift time evaluated to generate the lm model in R. The red dot highlights the parameter range of the expected maximum for illudin M production
Fig. 8
Fig. 8
Comparison of final product titers measured from stirred tank cultivations during screening of optimal pH shift time and final value. The scatter plot illustrates the concentrations of illudin M at the time of maximum productivity. Dots are colored according to the pH evaluated, the labels indicate the pH value after the shift. Experiments where pH was shifted at 74 h reached the maximum titers at 168 h and all other experiments at 192 h. Illudin M titers were derived from cell free culture supernatant
Fig. 9
Fig. 9
Comparison of process kinetics from optimized cultivations performed in shake flaks RAMOS (200 mL) and stirred tank DASGIP (1.5 L). Legends marked with D illustrate process values from the DASGIP cultivation and R from RAMOS cultivation. a Overlay of OTR-CTR and product formation over the cultivation time of the DASGIP cultivation with highest product titers and a RAMOS cultivation. b Total amount of glucose and acetate consumed over the cultivation time calculated from the difference between initial concentrations and the measured concentration in the daily samples. Dashed curves illustrate the data from RAMOS cultivations and solid curves illustrate the DASGIP cultivations. Error bars indicate one standard deviation (1SD) of the mean with n = 4 for RAMOS and n = 3 for DASGIP cultivations. c, d Illustrate a comparison of averages of the integrated OTR and CTR values (OT-CT) (RAMOS n = 4 and DASGIP n = 3). The blue circle highlights the time of the first acetate feed (96 h)
Fig. 10
Fig. 10
Process kinetics of a 10 L stirred tank cultivation where pH was shifted from pH 4.5 to pH 6.5 at 85 h. The culture was prepared with O. nidiformis cultivated in G13.5/C7 medium at 23 °C, 0.3 vvm (180 sL h−1) aeration and dissolved oxygen (DO) was maintained at 5% by increasing the agitation speed. Acetate was fed at 96 h (8 g L−1), 120 h (4 g L−1) and 144 h (4 g L−1) indicated with black triangles. A feed of glucose was performed at 120 h (6 g L−1) indicated with a red triangle. The plots illustrate two sets of data with the full kinetics of the experiment. All curves illustrating the course of the different process parameters are colored according to the colors of the axis labels. Illudin M titers were derived from cell free culture supernatant
Fig. 11
Fig. 11
Comparison of process kinetics from cultivations of 1.5 L (DASGIP) and 10 L (BBI) in stirred tank bioreactors. Legends marked with D illustrate process values from DASGIP cultivation and B from BBI cultivation. a Kinetics of OTR-CTR and product formation over the cultivation time. b Consumption of glucose and acetate over the cultivation time. Dashed curves illustrate the data from BBI cultivation and solid curves the DASGIP cultivation c, d Illustrate a comparison of the integrated OTR and CTR values (OT and CT) and the blue circle highlights the time for acetate feeding (96 h). e Comparison of tip speed. f Comparison of the approximated EDCF values calculated with energy dissipation circulation function. Stirring speed was increased from 150 min−1 to 200 min−1 at 48 h in the 10 L cultivation (e, f), which explains the step-wise increase of the values at that time point

Similar articles

Cited by

References

    1. Miethke M, Pieroni M, Weber T, Brönstrup M, Hammann P, Halby L, et al. Towards the sustainable discovery and development of new antibiotics. Nat Rev Chem. 2021;5:726–749. doi: 10.1038/s41570-021-00313-1. - DOI - PMC - PubMed
    1. Schobert R, Knauer S, Seibt S, Biersack B. Anticancer Active Illudins: recent developments of a potent alkylating compound class. Curr Med Chem. 2011;18:790–807. doi: 10.2174/092986711794927766. - DOI - PubMed
    1. Kelner MJ, McMorris TC, Taetle R. Preclinical evaluation of illudins as anticancer agents: basis for selective cytotoxicity. J Natl Cancer Inst. 1990;82:1562–1565. doi: 10.1093/jnci/82.19.1562. - DOI - PubMed
    1. Allarity Therapeutics. Pipeline: Clinical Trials. 2020. https://allarity.com/pipeline/clinical-trials/. Accessed Aug 9 2021.
    1. Schobert R, Biersack B, Knauer S, Ocker M. Conjugates of the fungal cytotoxin illudin M with improved tumour specificity. Bioorganic Med Chem. 2008;16:8592–8597. doi: 10.1016/j.bmc.2008.08.015. - DOI - PubMed

MeSH terms

LinkOut - more resources