

DNA methylation subtypes guiding prognostic assessment and linking to responses the DNA methyltransferase inhibitor SGI-110 in urothelial carcinoma
- PMID: 35843958
- PMCID: PMC9290251
- DOI: 10.1186/s12916-022-02426-w
DNA methylation subtypes guiding prognostic assessment and linking to responses the DNA methyltransferase inhibitor SGI-110 in urothelial carcinoma
Abstract
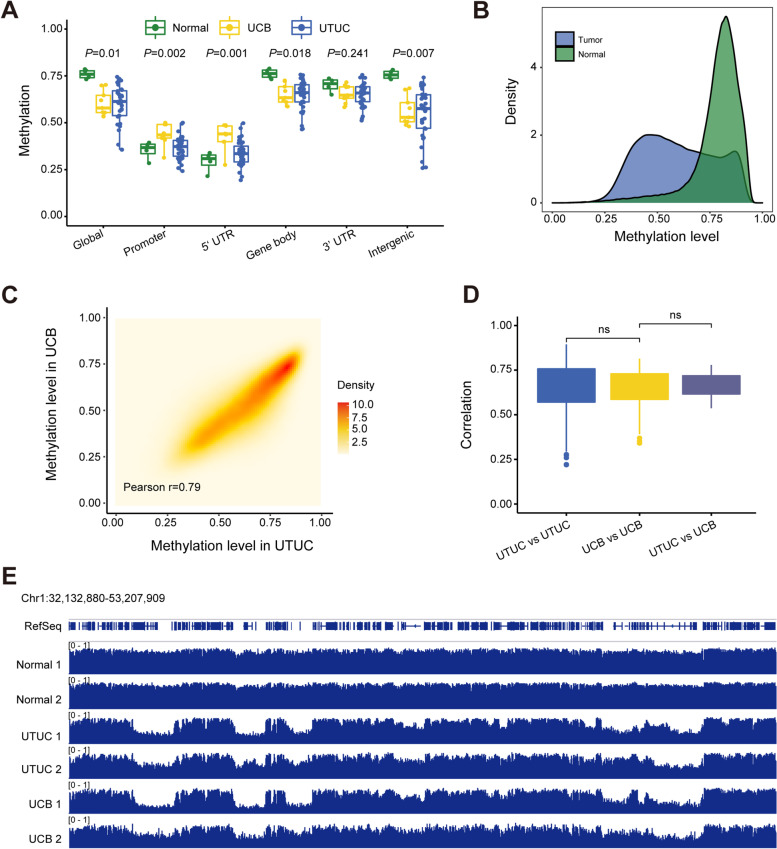
Background: At present, the extent and clinical relevance of epigenetic differences between upper tract urothelial carcinoma (UTUC) and urothelial carcinoma of the bladder (UCB) remain largely unknown. Here, we conducted a study to describe the global DNA methylation landscape of UTUC and UCB and to address the prognostic value of DNA methylation subtype and responses to the DNA methyltransferase inhibitor SGI-110 in urothelial carcinoma (UC).
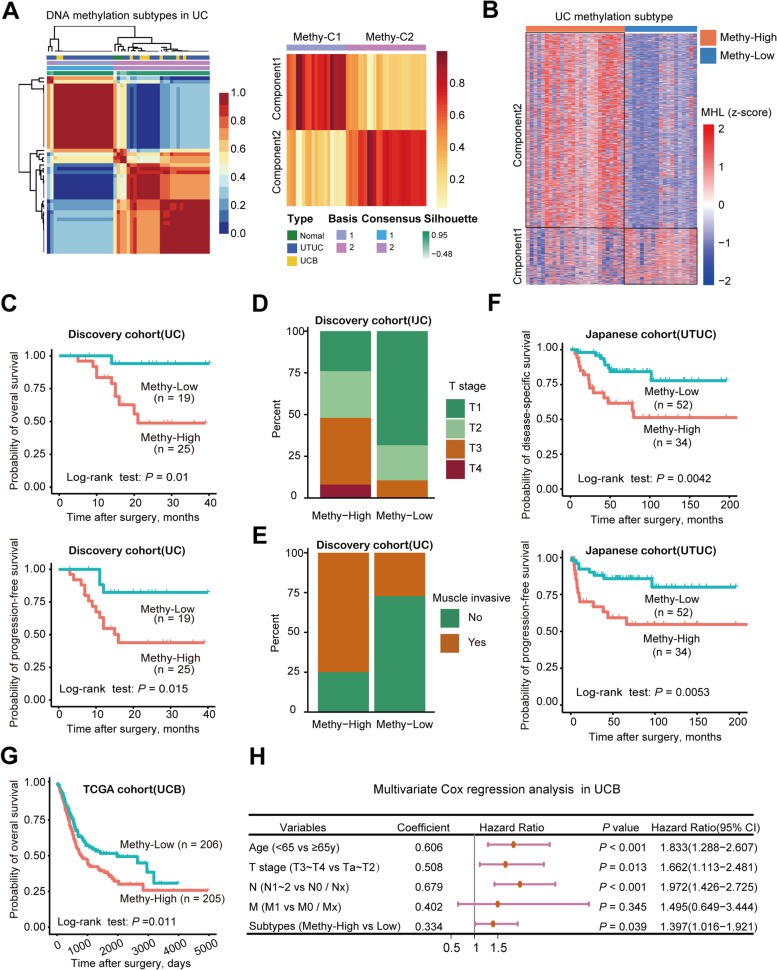
Methods: Using whole-genome bisulfite sequencing (n = 49 samples), we analyzed epigenomic features and profiles of UTUC (n = 36) and UCB (n = 9). Next, we characterized potential links between DNA methylation, gene expression (n = 9 samples), and clinical outcomes. Then, we integrated an independent UTUC cohort (Fujii et al., n = 86) and UCB cohort (TCGA, n = 411) to validate the prognostic significance. Furthermore, we performed an integrative analysis of genome-wide DNA methylation and gene expression in two UC cell lines following transient DNA methyltransferase inhibitor SGI-110 treatment to identify potential epigenetic driver events that contribute to drug efficacy.
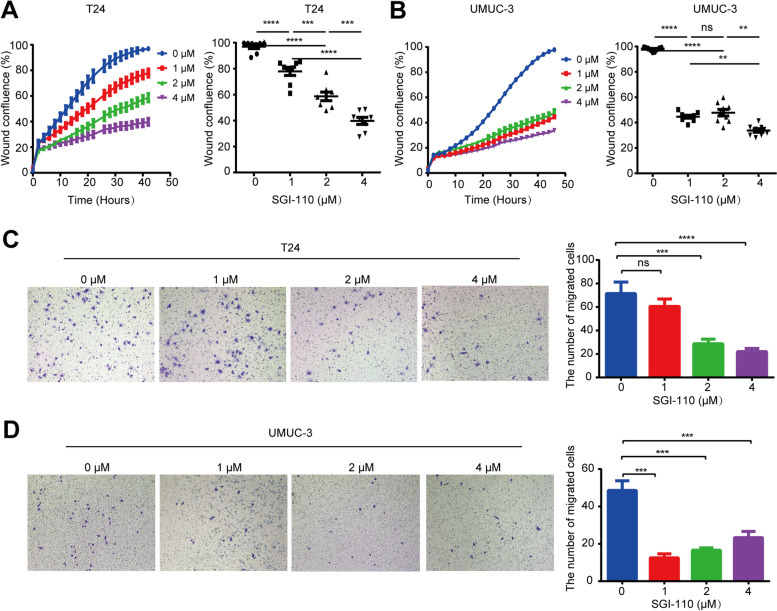
Results: We showed that UTUC and UCB have very similar DNA methylation profiles. Unsupervised DNA methylation classification identified two epi-clusters, Methy-High and Methy-Low, associated with distinct muscle-invasive statuses and patient outcomes. Methy-High samples were hypermethylated, immune-infiltrated, and enriched for exhausted T cells, with poor clinical outcome. SGI-110 inhibited the migration and invasion of Methy-High UC cell lines (UMUC-3 and T24) by upregulating multiple antitumor immune pathways.
Conclusions: DNA methylation subtypes pave the way for predicting patient prognosis in UC. Our results provide mechanistic rationale for evaluating SGI-110 in treating UC patients in the clinic.
Keywords: DNA methylation subtype; DNA methyltransferase inhibitor; Prognosis; Upper tract urothelial carcinoma; Urothelial carcinoma of the bladder; Whole-genome bisulfite sequencing.
© 2022. The Author(s).
Conflict of interest statement
The authors declare that they have no competing interests.
Figures


Similar articles
-
Comparison of Genomic Characterization in Upper Tract Urothelial Carcinoma and Urothelial Carcinoma of the Bladder.Oncologist. 2021 Aug;26(8):e1395-e1405. doi: 10.1002/onco.13839. Epub 2021 Jun 8. Oncologist. 2021. PMID: 34050578 Free PMC article.
-
Genetic Alterations in Chromatin Regulatory Genes in Upper Tract Urothelial Carcinoma and Urothelial Bladder Cancer.Cancer Med. 2024 Nov;13(21):e70398. doi: 10.1002/cam4.70398. Cancer Med. 2024. PMID: 39513266 Free PMC article.
-
Comprehensive genomic profiling of upper tract urothelial carcinoma and urothelial carcinoma of the bladder identifies distinct molecular characterizations with potential implications for targeted therapy & immunotherapy.Front Immunol. 2023 Feb 3;13:1097730. doi: 10.3389/fimmu.2022.1097730. eCollection 2022. Front Immunol. 2023. PMID: 36818471 Free PMC article.
-
Synchronous and metachronous urothelial carcinoma of the upper urinary tract and the bladder: Are they clonally related? A systematic review.Urol Oncol. 2020 Jun;38(6):590-598. doi: 10.1016/j.urolonc.2020.01.008. Epub 2020 Feb 11. Urol Oncol. 2020. PMID: 32057596
-
Genomics in upper tract urothelial carcinoma.Curr Opin Urol. 2017 Jan;27(1):35-40. doi: 10.1097/MOU.0000000000000341. Curr Opin Urol. 2017. PMID: 27584028 Review.
Cited by
-
Nanopore Single-molecule Analysis of Biomarkers: Providing Possible Clues to Disease Diagnosis.Trends Analyt Chem. 2023 May;162:117060. doi: 10.1016/j.trac.2023.117060. Epub 2023 Apr 11. Trends Analyt Chem. 2023. PMID: 38106545 Free PMC article.
-
Integrated multi-omics profiling reveals the role of the DNA methylation landscape in shaping biological heterogeneity and clinical behaviour of metastatic melanoma.J Exp Clin Cancer Res. 2025 Jul 18;44(1):212. doi: 10.1186/s13046-025-03474-9. J Exp Clin Cancer Res. 2025. PMID: 40682094 Free PMC article.
-
Blood leukocytes as a non-invasive diagnostic tool for thyroid nodules: a prospective cohort study.BMC Med. 2024 Apr 2;22(1):147. doi: 10.1186/s12916-024-03368-1. BMC Med. 2024. PMID: 38561764 Free PMC article.
-
An integrative analysis of DNA methylation and gene expression to predict lung adenocarcinoma prognosis.Front Genet. 2022 Aug 29;13:970507. doi: 10.3389/fgene.2022.970507. eCollection 2022. Front Genet. 2022. PMID: 36105089 Free PMC article.
-
Cholangiocarcinoma: Recent Advances in Molecular Pathobiology and Therapeutic Approaches.Cancers (Basel). 2024 Feb 16;16(4):801. doi: 10.3390/cancers16040801. Cancers (Basel). 2024. PMID: 38398194 Free PMC article. Review.
References
-
- Roupret M, Babjuk M, Burger M, Capoun O, Cohen D, Comperat EM, Cowan NC, Dominguez-Escrig JL, Gontero P, Hugh Mostafid A, et al. European Association of urology guidelines on upper urinary tract urothelial carcinoma: 2020 update. Eur Urol. 2021;79(1):62–79. doi: 10.1016/j.eururo.2020.05.042. - DOI - PubMed
-
- Wolff EM, Chihara Y, Pan F, Weisenberger DJ, Siegmund KD, Sugano K, Kawashima K, Laird PW, Jones PA, Liang G. Unique DNA methylation patterns distinguish noninvasive and invasive urothelial cancers and establish an epigenetic field defect in premalignant tissue. Cancer Res. 2010;70(20):8169–8178. doi: 10.1158/0008-5472.CAN-10-1335. - DOI - PMC - PubMed
MeSH terms
Substances
LinkOut - more resources
Full Text Sources
Other Literature Sources
Medical
