

Defining the proximal interaction networks of Arf GTPases reveals a mechanism for the regulation of PLD1 and PI4KB
- PMID: 35844135
- PMCID: PMC9433938
- DOI: 10.15252/embj.2022110698
Defining the proximal interaction networks of Arf GTPases reveals a mechanism for the regulation of PLD1 and PI4KB
Abstract
The Arf GTPase family is involved in a wide range of cellular regulation including membrane trafficking and organelle-structure assembly. Here, we have generated a proximity interaction network for the Arf family using the miniTurboID approach combined with TMT-based quantitative mass spectrometry. Our interactome confirmed known interactions and identified many novel interactors that provide leads for defining Arf pathway cell biological functions. We explored the unexpected finding that phospholipase D1 (PLD1) preferentially interacts with two closely related but poorly studied Arf family GTPases, ARL11 and ARL14, showing that PLD1 is activated by ARL11/14 and may recruit these GTPases to membrane vesicles, and that PLD1 and ARL11 collaborate to promote macrophage phagocytosis. Moreover, ARL5A and ARL5B were found to interact with and recruit phosphatidylinositol 4-kinase beta (PI4KB) at trans-Golgi, thus promoting PI4KB's function in PI4P synthesis and protein secretion.
Keywords: ARL11; ARL5; PI4KB; PLD1; Phagocytosis.
©2022 The Authors.
Figures
- A
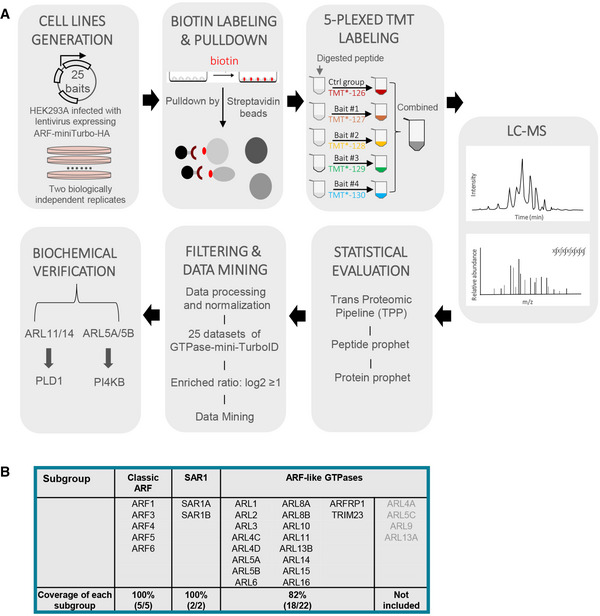
Workflow used to generate ARF family proximal interaction network. This includes the construction of ARF‐miniTurbo‐HA vectors, generation of cell lines stably expressing the bait, biotin labeling, streptavidin purification, peptide digestion, TMT‐coupled quantitative mass spectrometry, peptide identification with TPP, statistical evaluation, data mining, and biochemical verification.
- B
A list of ARF family GTPases included or not included in this study.
- A
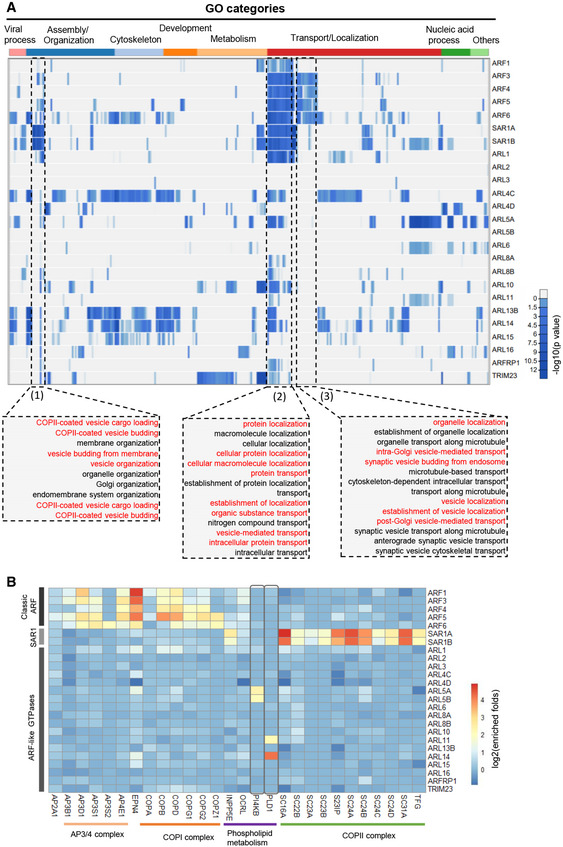
Heatmap of the most significant terms associated with the ARF family proximal interaction proteins identified in this study. Representative pathways were listed in the lower dotted box and highlighted in red.
- B
Heatmap of proteins involved in vesicle coating and phospholipid metabolism identified in this study. Prey proteins belonging to the specific pathways are shown on the bottom.
- A
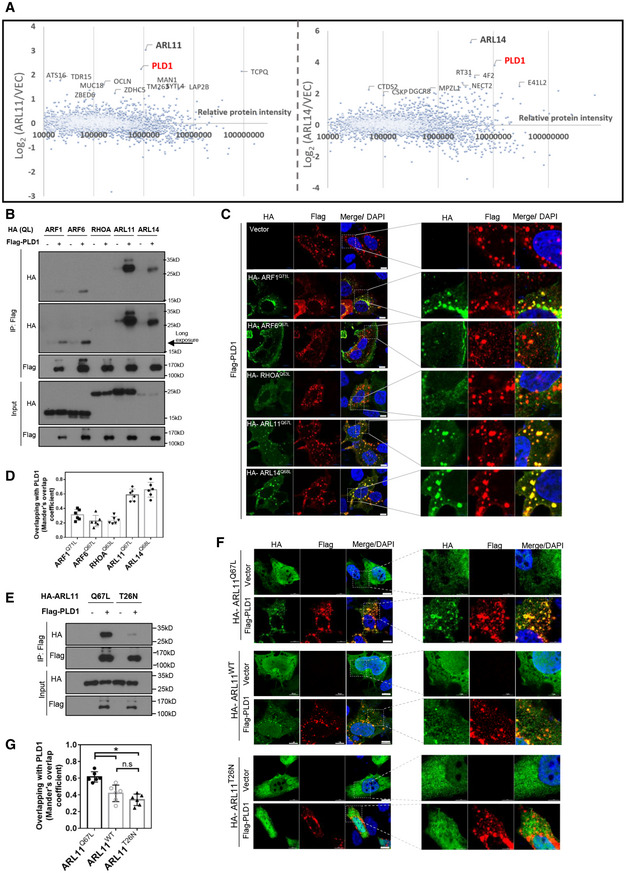
PLD1 is enriched by ARL11 and ARL14 miniTurboID. A graph showing proteins that are enriched with ARL11 or ARL14 compared with the vector. The result is presented as the mean of two biologically independent samples.
- B
Interaction between PLD1 and ARL11/14 is stronger than between ARF1/6 and RhoA. Flag‐tagged PLD1 was co‐expressed with HA‐tagged GTP‐bound mutants of small GTPases in HEK293A cells as indicated. PLD1 was immunoprecipitated with Flag beads, and the coprecipitated small GTPases were detected with an HA antibody. The result is representative of three biologically independent experiments.
- C
ARL11/14 colocalize with PLD1. Flag‐tagged PLD1 was co‐expressed with HA‐tagged GTP‐bound mutants of small GTPases in HEK293A cells as indicated. After 24 h, cells were fixed with 4% paraformaldehyde, followed by incubation with anti‐Flag and anti‐HA primary antibodies. The Flag and HA antibodies were detected by anti‐mouse and anti‐rabbit secondary antibodies, respectively. DAPI (blue) was used for DNA staining. Scale bars: 10 μm. The result is representative of two biologically independent experiments.
- D
Mander's overlap coefficient of (C). Mander's overlap coefficient was calculated using JACoP plug‐in in ImageJ. Mean ± standard deviation (SD), n = 6 technically independent samples.
- E
PLD1 preferentially binds to the GTP form, not the GDP form, of ARL11. Flag‐tagged PLD1 was co‐expressed with HA‐tagged ARL11Q67L (GTP‐form) or ARL11T26N (GDP‐form) mutant in HEK293A cells. The result is representative of two biologically independent experiments.
- F
The subcellular colocalization of ARL11 with PLD1 is GTP‐dependent. HA‐tagged GTP‐bound ARL11Q67L, wild‐type ARL11, or GDP‐bound ARL11T26N was co‐expressed with Flag‐tagged PLD1. After 24 h, cells were fixed, followed by incubation with anti‐Flag and anti‐HA primary antibodies. DAPI (blue) was used for DNA staining. Scale bars: 10 μm. The result is representative of three biologically independent experiments.
- G
Mander's overlap coefficient of (F). Mander's overlap coefficient was calculated using JACoP plug‐in in ImageJ. Mean ± SD; one‐way ANOVA, n = 6 technically independent samples, *P < 0.05.
- A
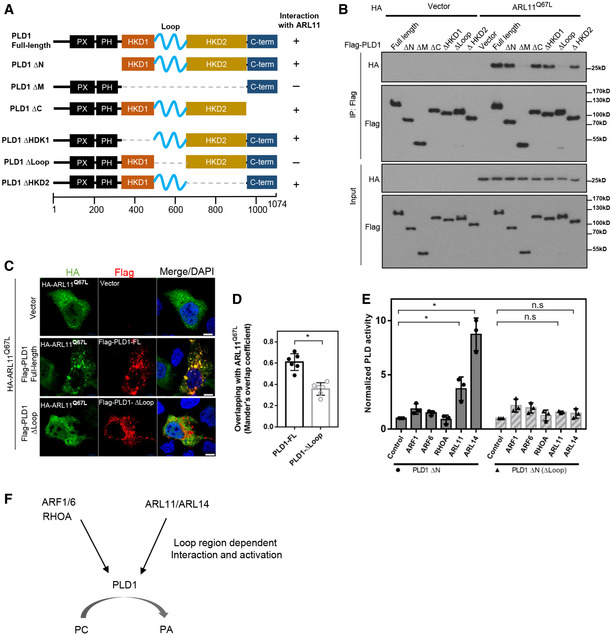
Schematic representation of the full‐length PLD1 and various truncations. ∆N, deletion of the N‐terminal PX and PH lipid‐binding domain (1‐329aa); ∆M, deletion of the central catalytic domain (330‐967aa); ∆C, deletion of the C‐terminal domain (968‐1074aa); ∆HDK1, deletion of the HDK1 domain (330‐500aa); ∆Loop, deletion of the loop region (501‐642aa); and ∆HKD2, deletion of the HDK2 domain (643‐967aa). “+” denotes positive interaction with ARL11, and “‐” denotes no interaction.
- B
The loop region of PLD1 is required for the interaction between ARL11 and PLD1. Flag‐tagged full‐length or truncations of PLD1 were co‐expressed with HA‐tagged ARL11Q67L, PLD1 was immunoprecipitated with Flag beads, and ARL11 that associated with it was detected with an HA antibody. The result is representative of two biologically independent experiments.
- C
Deletion of the loop region disrupts the PLD1 and ARL11 colocalization. Flag‐tagged full‐length or ∆Loop truncation of PLD1 was co‐expressed with HA‐tagged ARL11Q67L. After 24 h, cells were fixed with 4% paraformaldehyde, followed by incubation with anti‐Flag and anti‐HA primary antibodies. DAPI (blue) was used for DNA staining. Scale bars: 10 μm. The result is representative of three biologically independent experiments.
- D
Mander's overlap coefficient of (J). Mander's overlap coefficient was calculated using JACoP plug‐in in ImageJ. Mean ± SD; two‐tailed Student's t‐test, n = 6 technically independent samples, *P < 0.05.
- E
ARL11 and ARL14 stimulation of PLD1 activity is dependent on the loop region. The in vitro activity assay was performed using PLD1 protein of catalytic domain (PLD1 ∆N) with or without the loop region. Details were described in the Methods part. Data are presented as mean ± SD of three biologically independent samples. One‐way ANOVA; n.s denotes not significant, *P < 0.05.
- F
A model of PLD1 activation by GTPases. In contrast to ARF1/6 and RHOA, ARL11/14 stimulate PLD1 activity in a manner dependent on the loop region.
- A
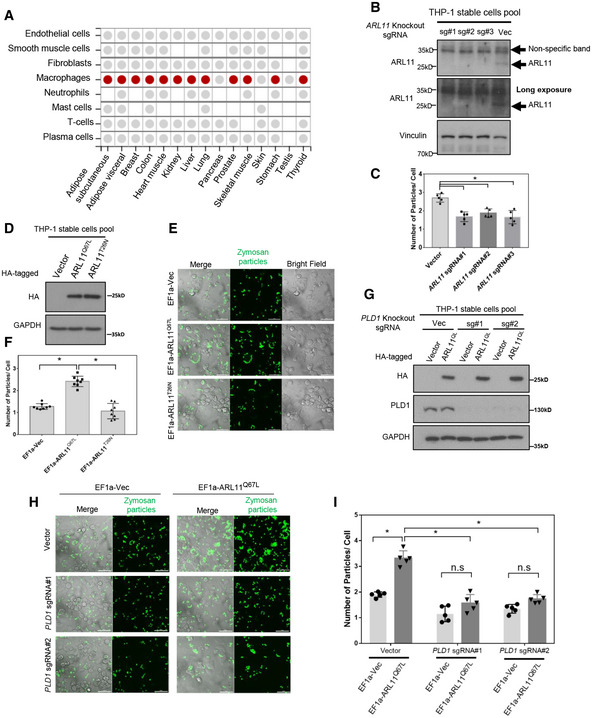
ARL11 expression is enriched in macrophages. Analysis of single‐cell RNA‐sequencing dataset shows that ARL11 expression is highest in macrophages (
https://www.proteinatlas.org/ENSG00000152213‐ARL11/tissue+cell+type ). - B
ARL11 knockout of THP‐1 stable cell pools. ARL11 knockout THP‐1 cell pools were generated by the CRISPR/Cas9 technology with three different‐guide RNAs. Cell lysates were immunoblotted with the indicated antibodies.
- C
ARL11 knockout inhibits phagocytosis. Macrophages were differentiated from THP1 cell pools, followed by incubation with green zymosan particles for 1.5 h. Free green zymosan particles were washed away before photography. Details were described in Methods. Typically, all cells and cellular particles in randomly selected fields were counted. Data are presented as mean ± SD, n = 5 technically independent samples. One‐way ANOVA, *P < 0.05.
- D
THP‐1 cell pool stably expressing HA‐tagged ARL11Q67L or ARL11T26N. Lysates were immunoblotted with indicated antibodies.
- E
ARL11Q67L, but not ARL11T26N, promotes phagocytosis of macrophages. Macrophages were differentiated from indicated THP1 cell pool, followed by incubated with green zymosan particles for 1 h. Scale bars: 50 μm. The result is representative of two biologically independent experiments.
- F
Quantification result of (E). Data are presented as mean ± SD, n = 8 technically independent samples. One‐way ANOVA, *P < 0.05.
- G
PLD1 knockout efficiency and HA‐tagged ARL11Q67L expression of THP‐1 stable cell pools. Lysates were immunoblotted with indicated antibodies.
- H
PLD1 knockout blocks the ARL11Q67L‐stimulated phagocytosis. Macrophages were differentiated from indicated THP1 cell groups and then incubated with green zymosan particles for 1.5 h. Scale bars: 50 μm. The result is representative of two biologically independent experiments.
- I
PLD1 is required for ARL11 to stimulate phagocytosis. Data are quantification of panel (H). Data are presented as mean ± SD, n = 5 technically independent samples. Two‐way ANOVA, *P < 0.05.
- A
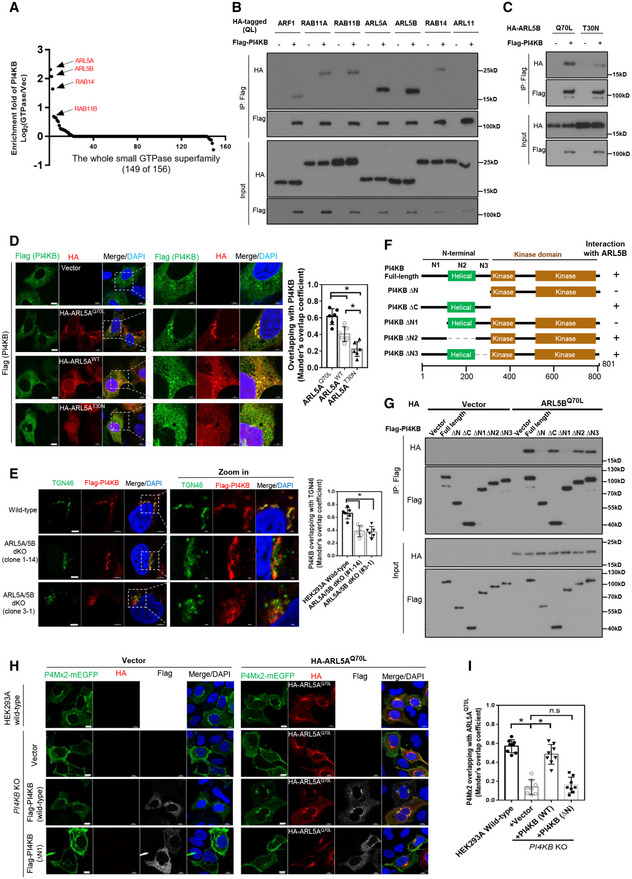
PI4KB is enriched by ARL5A and ARL5B. ARL5A, ARL5B, and RAB14 rank the top 3 GTPases based on PI4KB enrichment by miniTurbo screening of the GTP‐bound forms of the Ras superfamily. For ARF family, data were from two biologically independent analyses, while for other GTPases, data were from one biological sample.
- B
Interaction of PI4KB with ARL5A/5B is stronger than with ARF1, RAB11A/11B, and RAB14. Flag‐tagged PI4KB was co‐expressed with HA‐tagged GTP‐bound mutant of GTPases in HEK293A cells as indicated. PI4KB was immunoprecipitated with Flag beads, and the coprecipitated GTPases were detected by HA Western blot. The result is representative of three biologically independent experiments.
- C
PI4KB preferentially binds to the GTP form of ARL5B. Flag‐tagged PI4KB was co‐expressed with HA‐tagged ARL5BQ70L (GTP‐form) or ARL5BT30N (GDP‐form) mutant in HEK293A cells. Interaction was measured similar to panel B. The result is representative of two biologically independent experiments.
- D
The ARL5A colocalization with PI4KB is GTP‐dependent. HA‐tagged GTP‐bound ARL5AQ70L, wild‐type ARL5A, or GDP‐bound ARL5AT30N was co‐expressed with Flag‐tagged PI4KB. After 24 h, cells were fixed, followed by incubation with anti‐Flag and anti‐HA primary antibodies. DAPI (blue) was used for DNA staining. Scale bars: 10 μm. Shown is representative of two biologically independent experiments. The left panel is the quantification of the overlap coefficient. Mean ± SD, n = 6 technically independent samples. One‐way ANOVA, *P < 0.05.
- E
ARL5A/5B double knockout diminishes the colocalization of PI4KB and TGN46. Flag‐tagged PI4KB was expressed in HEK293A wild‐type or two ARL5A/5B double knockout clones as indicated. After 24 h, cells were fixed, followed by incubation with anti‐Flag and anti‐TGN46 primary antibodies. DAPI (blue) was used for DNA staining. Scale bars: 5 μm. The result is representative of two biologically independent experiments. The left panel is the quantification of the overlap coefficient. Mean ± SD, n = 6 technically independent samples. One‐way ANOVA, *P < 0.05.
- F
Schematic representation of the full‐length PI4KB and various truncations. ∆N, deletion of the N‐terminal region (1‐306aa); ∆C, deletion of the C‐terminal kinase domain (307‐801aa); ∆N1, deletion of the N‐terminal disordered region (1‐127aa); ∆N2, deletion of the helical domain (128‐242aa); and ∆N3, deletion of the helical‐kinase linker region (243‐306aa). “+” denotes positive interaction with ARL5B, and “−” denotes no interaction.
- G
The N1 region of PI4KB is required for the interaction with ARL5B. Flag‐tagged full‐length or truncations of PI4KB were co‐expressed with HA‐tagged ARL5BQ70L. PI4KB was immunoprecipitated with Flag beads, and the coprecipitated ARL5B was detected by HA Western blot. The result is representative of three biologically independent experiments.
- H
The N1 region of PI4KB is required for the colocalization of ARL5A/B and PI4P. P4Mx2‐mEGFP was co‐expressed with HA‐tagged ARL5AQ70L in HEK293A wild‐type or PI4KB knockout cells (clone#2–5). HEK293A cells were cotransfected with indicated constructs. After 24 h, cells were fixed with 4% paraformaldehyde, followed by incubation with anti‐HA primary antibodies. DAPI (blue) was used for nucleus staining. Scale bars: 10 μm. The result is representative of two biologically independent experiments.
- I
Mander's overlap coefficient of (H). Mean ± SD, n = 8 technically independent samples. One‐way ANOVA, *P < 0.05.
- A
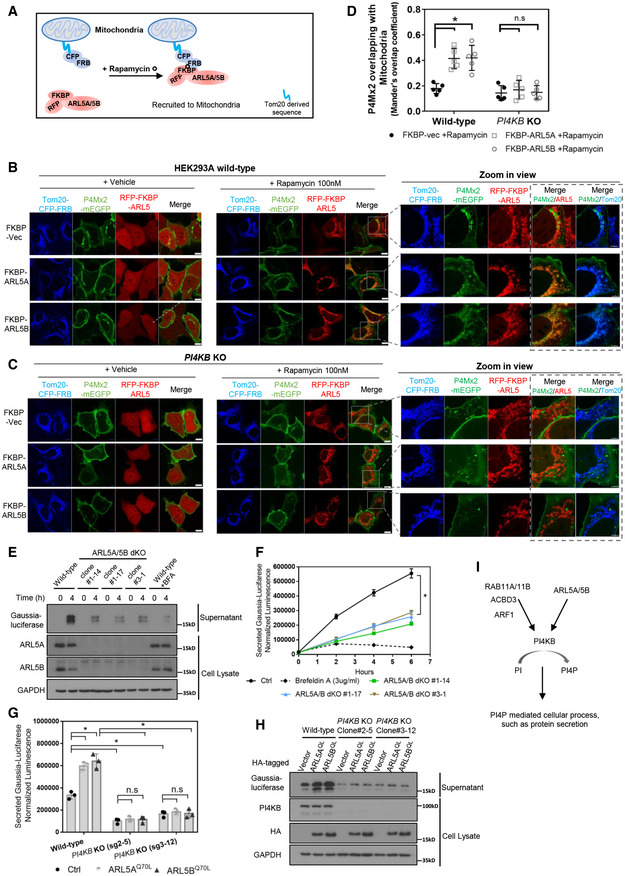
Schematic representation of the rapamycin‐induced mitochondria translocation of ARL5A/5B. The FRB domain was fused with the Tom20‐derived mitochondrial anchor sequence. ARL5A/5B were fused with RFP and FKBP. Rapamycin induces the dimer formation of FRB and FKBP, therefore recruiting the FKBP‐RFP‐ARL5A/5B to mitochondria.
- B
ARL5A/5B recruitment to mitochondria induces PI4P accumulation at the mitochondria. Tom20‐CFP‐RFB and P4Mx2‐mEGFP were co‐expressed with RFP‐FKBP vector or RFP‐FKBP‐ARL5A/5BQ70L constructs in HEK293A cells. Cell samples were treated with or without 100 nM rapamycin for 1 h. Scale bars: 10 μm. The dashed line box indicates the merged signal of PI4P with ARL5A/5B or Tom20. The result is representative of two biologically independent experiments.
- C
PI4KB knockout blocks the PI4P accumulation induced by mitochondria‐anchored ARL5A/5B. Tom20‐CFP‐RFB and P4Mx2‐mEGFP were co‐expressed with RFP‐FKBP vector or RFP‐FKBP‐ARL5A/5BQ70L constructs in HEK293A PI4KB knockout cells (clone#2–5). Cell samples were treated with or without 100 nM rapamycin for 1 h before imaging. Scale bars: 10 μm. The dashed line box indicates the merged signal of PI4P with ARL5A/5B or Tom20. The result is representative of two biologically independent experiments.
- D
Mander's overlap coefficient of (B and C, result of rapamycin treatment). Mean ± SD, n = 5 technically independent samples. Two‐way ANOVA, *P < 0.05.
- E
ARL5A/5B double knockout decreases protein secretion. Gaussia luciferase was expressed in HEK293A wild‐type or three ARL5A/5B double knockout clones as indicated. After 24 h, the medium was replaced with the fresh medium. After 4 h, the medium was collected, and the secreted Gaussia luciferase was detected by Western blot. Cells were also collected and probed with indicated antibodies.
- F
ARL5A/5B double knockout decreases protein secretion. Experiments were similar to panel (E). The medium was collected at the indicated time points and measured for luciferase activity. The cellular firefly luciferase activity was measured as the transfection control. Details were described in the Methods part. 3 μg/ml BFA was used as a positive control to inhibit protein secretion. Data are presented as mean ± SD, n = 3 biologically independent samples. One‐way ANOVA, *P < 0.05.
- G
PI4KB knockout blocks protein secretion stimulated by ARL5A/5BQ70L. Gaussia luciferase was co‐expressed with HA‐tagged ARL5AQ70L or ARL5BQ70L in HEK293A wild‐type or two PI4KB knockout cell lines as indicated. After 24 h, the medium was replaced with the fresh medium. After 3 h, the medium was collected and measured for Gaussia luciferase activity. Data are presented as mean ± SD, n = 3 biologically independent samples. Two‐way ANOVA, n.s denotes not significant, *P < 0.05.
- H
PI4KB knockout blocks protein secretion stimulated by ARL5A/5BQ70L. Experiments were similar to panel (G). Gaussia luciferase in culture medium was detected by Western blot, and the cell lysate was immunoblotted with indicated antibodies.
- I
A proposed model of PI4KB regulation by ARL5A/5B. In addition to the reported ARF1, ACBD3, and RAB11A/11B, ARL5A/5B act as novel regulators of PI4KB to promote PI4P synthesis and protein secretion.
Similar articles
-
ARFs get the BioID treatment: what have we been missing?EMBO J. 2022 Sep 1;41(17):e112181. doi: 10.15252/embj.2022112181. Epub 2022 Aug 5. EMBO J. 2022. PMID: 35929178 Free PMC article.
-
Mapping the global interactome of the ARF family reveals spatial organization in cellular signaling pathways.J Cell Sci. 2024 May 1;137(9):jcs262140. doi: 10.1242/jcs.262140. Epub 2024 May 14. J Cell Sci. 2024. PMID: 38606629 Free PMC article.
-
RalA interacts directly with the Arf-responsive, PIP2-dependent phospholipase D1.Biochem Biophys Res Commun. 1997 Jun 27;235(3):854-9. doi: 10.1006/bbrc.1997.6793. Biochem Biophys Res Commun. 1997. PMID: 9207251
-
The regulation of phospholipase D by inositol phospholipids and small GTPases.FEBS Lett. 2002 Oct 30;531(1):62-4. doi: 10.1016/s0014-5793(02)03410-5. FEBS Lett. 2002. PMID: 12401204 Review.
-
Phospholipase D as an effector for ADP-ribosylation factor in the regulation of vesicular traffic.Chem Phys Lipids. 1999 Apr;98(1-2):141-52. doi: 10.1016/s0009-3084(99)00026-2. Chem Phys Lipids. 1999. PMID: 10358936 Review.
Cited by
-
ARMH3 is an ARL5 effector that promotes PI4KB-catalyzed PI4P synthesis at the trans-Golgi network.Nat Commun. 2024 Nov 23;15(1):10168. doi: 10.1038/s41467-024-54410-y. Nat Commun. 2024. PMID: 39580461 Free PMC article.
-
RUFY1 binds Arl8b and mediates endosome-to-TGN CI-M6PR retrieval for cargo sorting to lysosomes.J Cell Biol. 2023 Jan 2;222(1):e202108001. doi: 10.1083/jcb.202108001. Epub 2022 Oct 25. J Cell Biol. 2023. PMID: 36282215 Free PMC article.
-
ARFs get the BioID treatment: what have we been missing?EMBO J. 2022 Sep 1;41(17):e112181. doi: 10.15252/embj.2022112181. Epub 2022 Aug 5. EMBO J. 2022. PMID: 35929178 Free PMC article.
-
Arfs on the Golgi: four conductors, one orchestra.Front Mol Biosci. 2025 Jul 31;12:1612531. doi: 10.3389/fmolb.2025.1612531. eCollection 2025. Front Mol Biosci. 2025. PMID: 40821699 Free PMC article. Review.
-
Mapping the global interactome of the ARF family reveals spatial organization in cellular signaling pathways.J Cell Sci. 2024 May 1;137(9):jcs262140. doi: 10.1242/jcs.262140. Epub 2024 May 14. J Cell Sci. 2024. PMID: 38606629 Free PMC article.
References
-
- Ali WH, Chen Q, Delgiorno KE, Su W, Hall JC, Hongu T, Tian H, Kanaho Y, Di Paolo G, Crawford HC et al (2013) Deficiencies of the lipid‐signaling enzymes phospholipase D1 and D2 alter cytoskeletal organization, macrophage phagocytosis, and cytokine‐stimulated neutrophil recruitment. PLoS One 8: e55325 - PMC - PubMed
-
- Antonicka H, Lin ZY, Janer A, Aaltonen MJ, Weraarpachai W, Gingras AC, Shoubridge EA (2020) A high‐density human mitochondrial proximity interaction network. Cell Metab 32: 479–497.e479 - PubMed
-
- Arakel EC, Schwappach B (2018) Formation of COPI‐coated vesicles at a glance. J Cell Sci 131: jcs209890 - PubMed
-
- Bagci H, Sriskandarajah N, Robert A, Boulais J, Elkholi IE, Tran V, Lin ZY, Thibault MP, Dube N, Faubert D et al (2020) Mapping the proximity interaction network of the rho‐family GTPases reveals signalling pathways and regulatory mechanisms. Nat Cell Biol 22: 120–134 - PubMed
-
- Balla A, Balla T (2006) Phosphatidylinositol 4‐kinases: old enzymes with emerging functions. Trends Cell Biol 16: 351–361 - PubMed
