

Xenon LFP Analysis Platform Is a Novel Graphical User Interface for Analysis of Local Field Potential From Large-Scale MEA Recordings
- PMID: 35844228
- PMCID: PMC9285004
- DOI: 10.3389/fnins.2022.904931
Xenon LFP Analysis Platform Is a Novel Graphical User Interface for Analysis of Local Field Potential From Large-Scale MEA Recordings
Abstract
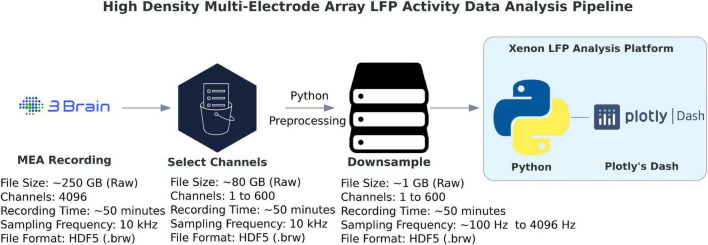
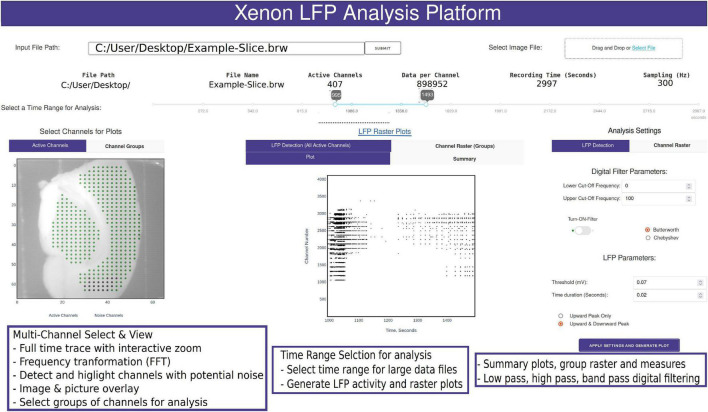
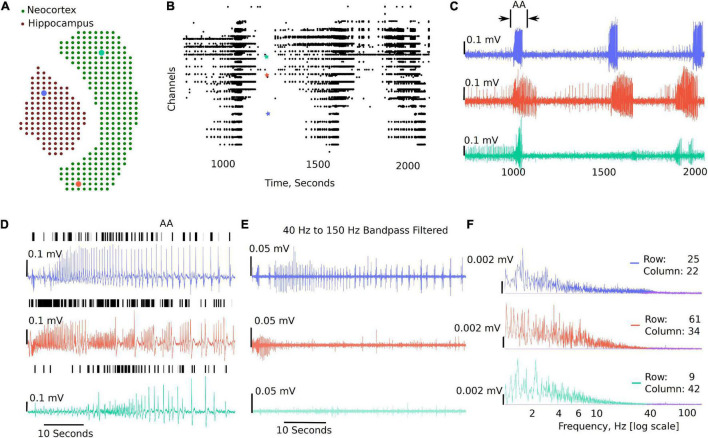
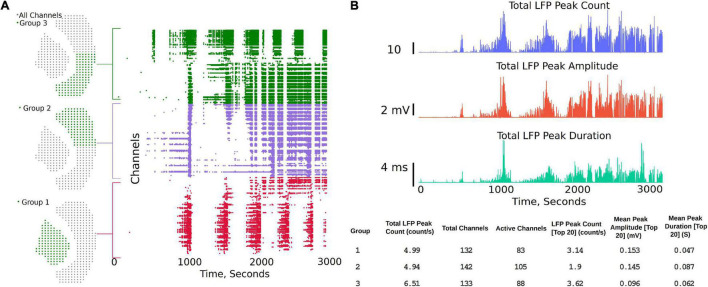
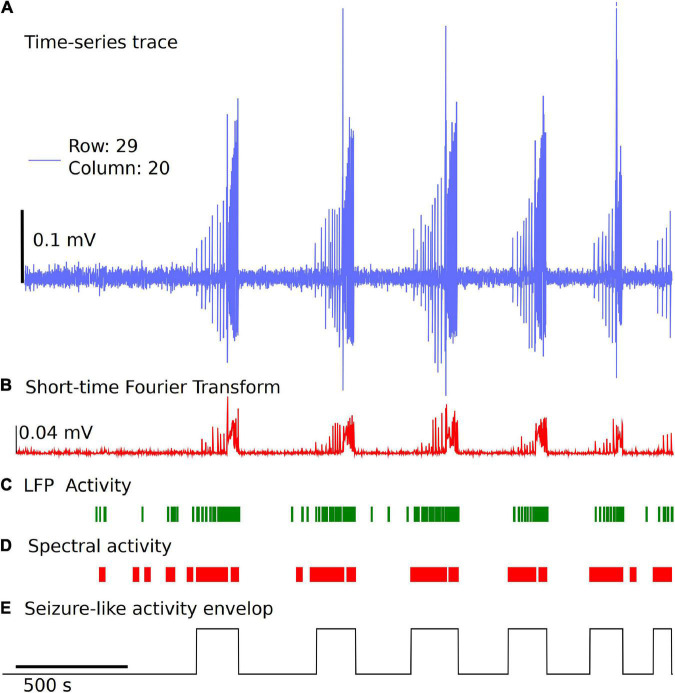
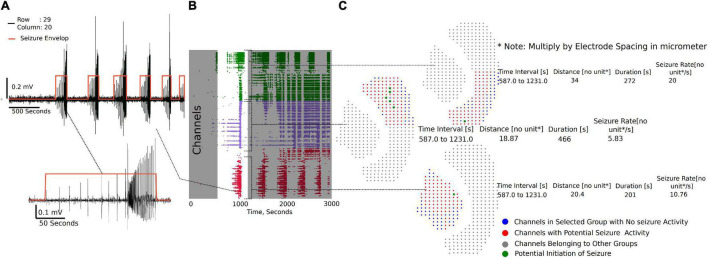
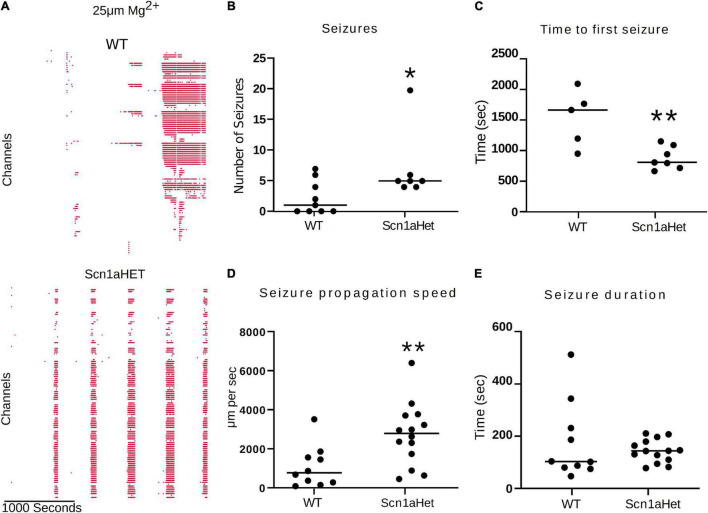
High-density multi-electrode array (HD-MEA) has enabled neuronal measurements at high spatial resolution to record local field potentials (LFP), extracellular action potentials, and network-wide extracellular recording on an extended spatial scale. While we have advanced recording systems with over 4,000 electrodes capable of recording data at over 20 kHz, it still presents computational challenges to handle, process, extract, and view information from these large recordings. We have created a computational method, and an open-source toolkit built in Python, rendered on a web browser using Plotly's Dash for extracting and viewing the data and creating interactive visualization. In addition to extracting and viewing entire or small chunks of data sampled at lower or higher frequencies, respectively, it provides a framework to collect user inputs, analyze channel groups, generate raster plots, view quick summary measures for LFP activity, detect and isolate noise channels, and generate plots and visualization in both time and frequency domain. Incorporated into our Graphical User Interface (GUI), we also created a novel seizure detection method, which can be used to detect the onset of seizures in all or a selected group of channels and provide the following measures of seizures: distance, duration, and propagation across the region of interest. We demonstrate the utility of this toolkit, using datasets collected from an HD-MEA device comprising of 4,096 recording electrodes. For the current analysis, we demonstrate the toolkit and methods with a low sampling frequency dataset (300 Hz) and a group of approximately 400 channels. Using this toolkit, we present novel data demonstrating increased seizure propagation speed from brain slices of Scn1aHet mice compared to littermate controls. While there have been advances in HD-MEA recording systems with high spatial and temporal resolution, limited tools are available for researchers to view and process these big datasets. We now provide a user-friendly toolkit to analyze LFP activity obtained from large-scale MEA recordings with translatable applications to EEG recordings and demonstrate the utility of this new graphic user interface with novel biological findings.
Keywords: HD-MEA; LFP analysis; Plotly Dash; SCN1a; seizures.
Copyright © 2022 Mahadevan, Codadu and Parrish.
Conflict of interest statement
The authors declare that this study received funding from Xenon Pharmaceuticals Inc. The funder was not involved in the study design, collection, analysis, interpretation of data, the writing of this article or the decision to submit it for publication.
Figures
Similar articles
-
Recording human electrocorticographic (ECoG) signals for neuroscientific research and real-time functional cortical mapping.J Vis Exp. 2012 Jun 26;(64):3993. doi: 10.3791/3993. J Vis Exp. 2012. PMID: 22782131 Free PMC article.
-
MEA-ToolBox: an Open Source Toolbox for Standardized Analysis of Multi-Electrode Array Data.Neuroinformatics. 2022 Oct;20(4):1077-1092. doi: 10.1007/s12021-022-09591-6. Epub 2022 Jun 9. Neuroinformatics. 2022. PMID: 35680724 Free PMC article.
-
Optimal Electrode Size for Multi-Scale Extracellular-Potential Recording From Neuronal Assemblies.Front Neurosci. 2019 Apr 26;13:385. doi: 10.3389/fnins.2019.00385. eCollection 2019. Front Neurosci. 2019. PMID: 31105515 Free PMC article.
-
A portable platform to collect and review behavioral data simultaneously with neurophysiological signals.Annu Int Conf IEEE Eng Med Biol Soc. 2017 Jul;2017:1784-1787. doi: 10.1109/EMBC.2017.8037190. Annu Int Conf IEEE Eng Med Biol Soc. 2017. PMID: 29060234 Review.
-
High-frequency gamma oscillations and human brain mapping with electrocorticography.Prog Brain Res. 2006;159:275-95. doi: 10.1016/S0079-6123(06)59019-3. Prog Brain Res. 2006. PMID: 17071238 Review.
Cited by
-
RNA Sequencing Demonstrates Ex Vivo Neocortical Transcriptomic Changes Induced by Epileptiform Activity in Male and Female Mice.eNeuro. 2024 May 24;11(5):ENEURO.0520-23.2024. doi: 10.1523/ENEURO.0520-23.2024. Print 2024 May. eNeuro. 2024. PMID: 38664009 Free PMC article.
-
Multiscale Cloud-Based Pipeline for Neuronal Electrophysiology Analysis and Visualization.bioRxiv [Preprint]. 2024 Dec 14:2024.11.14.623530. doi: 10.1101/2024.11.14.623530. bioRxiv. 2024. PMID: 39605518 Free PMC article. Preprint.
-
Pharmacological determination of the fractional block of Nav channels required to impair neuronal excitability and ex vivo seizures.Front Cell Neurosci. 2022 Sep 29;16:964691. doi: 10.3389/fncel.2022.964691. eCollection 2022. Front Cell Neurosci. 2022. PMID: 36246527 Free PMC article.
-
Molecular Pharmacology of Selective NaV1.6 and Dual NaV1.6/NaV1.2 Channel Inhibitors that Suppress Excitatory Neuronal Activity Ex Vivo.ACS Chem Neurosci. 2024 Mar 20;15(6):1169-1184. doi: 10.1021/acschemneuro.3c00757. Epub 2024 Feb 15. ACS Chem Neurosci. 2024. PMID: 38359277 Free PMC article.
References
-
- Buccino A., Garcia S., Yger P. (2022). Spike sorting: new trends and challenges of the era of high-density probes. Prog. Biomed. Eng. 4:022005.
LinkOut - more resources
Full Text Sources
Molecular Biology Databases