. 2022 Jun 30:16:869592.
doi: 10.3389/fnins.2022.869592. eCollection 2022.

A Strength Endurance Exercise Paradigm Mitigates Deficits in Hypoglossal-Tongue Axis Function, Strength, and Structure in a Rodent Model of Hypoglossal Motor Neuron Degeneration

Affiliations

A Strength Endurance Exercise Paradigm Mitigates Deficits in Hypoglossal-Tongue Axis Function, Strength, and Structure in a Rodent Model of Hypoglossal Motor Neuron Degeneration

Erika R Murphy et al. Front Neurosci. .

Abstract

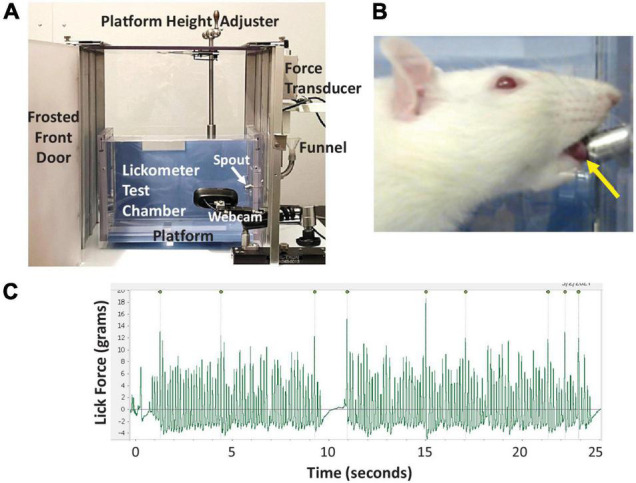
The tongue plays a crucial role in the swallowing process, and impairment can lead to dysphagia, particularly in motor neuron diseases (MNDs) resulting in hypoglossal-tongue axis degeneration (e.g., amyotrophic lateral sclerosis and progressive bulbar palsy). This study utilized our previously established inducible rodent model of dysphagia due to targeted degeneration of the hypoglossal-tongue axis. This model was created by injecting cholera toxin B conjugated to saporin (CTB-SAP) into the genioglossus muscle of the tongue base for retrograde transport to the hypoglossal (XII) nucleus via the hypoglossal nerve, which provides the sole motor control of the tongue. Our goal was to investigate the effect of high-repetition/low-resistance tongue exercise on tongue function, strength, and structure in four groups of male rats: (1) control + sham exercise (n = 13); (2) control + exercise (n = 10); (3) CTB-SAP + sham exercise (n = 13); and (4) CTB-SAP + exercise (n = 12). For each group, a custom spout with adjustable lick force requirement for fluid access was placed in the home cage overnight on days 4 and 6 post-tongue injection. For the two sham exercise groups, the lick force requirement was negligible. For the two exercise groups, the lick force requirement was set to ∼40% greater than the maximum voluntary lick force for individual rats. Following exercise exposure, we evaluated the effect on hypoglossal-tongue axis function (via videofluoroscopy), strength (via force-lickometer), and structure [via Magnetic Resonance Imaging (MRI) of the brainstem and tongue in a subset of rats]. Results showed that sham-exercised CTB-SAP rats had significant deficits in lick rate, swallow timing, and lick force. In exercised CTB-SAP rats, lick rate and lick force were preserved; however, swallow timing deficits persisted. MRI revealed corresponding degenerative changes in the hypoglossal-tongue axis that were mitigated by tongue exercise. These collective findings suggest that high-repetition/low-resistance tongue exercise in our model is a safe and effective treatment to prevent/diminish signs of hypoglossal-tongue axis degeneration. The next step is to leverage our rat model to optimize exercise dosing parameters and investigate corresponding treatment mechanisms of action for future translation to MND clinical trials.

Keywords: dysphagia; exercise; hypoglossal; motor neuron disease (MND); rodent model; tongue.


Conflict of interest statement

The authors declare that the research was conducted in the absence of any commercial or financial relationships that could be construed as a potential conflict of interest.

Figures

FIGURE 1
FIGURE 1
Experimental timeline. Our inducible rat model of targeted hypoglossal motor neuron degeneration has a 9-day timeline. On Day 0, rats received a single tongue injection of either control (unconjugated CTB + SAP) or conjugated CTB-SAP solution into the midline genioglossus. The week preceding tongue injection, rats underwent behavioral conditioning and baseline behavioral testing: (1) videofluoroscopic study (VFSS) to assess tongue motility and swallow function, and (2) force-lickometer testing to determine each rat’s maximum voluntary lick force (MVLF) during drinking. At Days 4 and 6, rats underwent an overnight (12-h) tongue exercise program consisting of low intensity (50% > MVLF) or sham (<4 g) exercise. Endline behavioral testing occurred on Day 8, followed by MRI (on a subset of 16 rats) and euthanasia on Day 9 (i.e., study endpoint).
FIGURE 2
FIGURE 2
VFSS methods. (A) A rat undergoing VFSS testing in our miniature c-arm designed for use with rodents, with labeled components. (B,C) Representative lateral view radiographic images depicting the swallow onset frame (B) and swallow end frame (C) during VFSS testing. Note the bolus filling the vallecular space at swallow onset (pink arrow), and the bolus in the proximal esophagus (blue arrow) at the swallow end frame. The yellow and blue square markers on the upper and lower jaw, respectively, automatically tracked jaw open/close motion via our JawTrack™ software. Image contrast was adjusted to accentuate the bolus rather than soft tissue; the asterisk indicates the location of the tongue protruding toward the bowl (filled with liquid contrast agent) during drinking. C2 = 2nd cervical vertebra; white open circle = hyoid bone. The cross in the upper right quadrant is a 1 cm calibration marker. (D) Representative graph generated by our JawTrack™ software showing 5 s (@ 30 frames per second, fps) of uninterrupted licking based on jaw motion tracking (B,C). The positive peaks (green dots) indicate maximum jaw opening/gape, whereas the negative peaks (red dots) indicate maximum jaw closure; the time stamp of each positive peak was used to calculate lick rate (Hz). Manually added event markers superimposed on the jaw motion graph indicate each pharyngeal swallow onset frame (pink lines) and pharyngeal swallow end frame (blue lines), which were used to calculate swallow rate (Hz) and pharyngeal transit time (PTT, ms). The black dashed line (i.e., video sync marker) moves in synchrony with the corresponding video frame when viewing video clips in our JawTrack™ interface.
FIGURE 3
FIGURE 3
Lickometer methods. (A) Our custom force-lickometer system for use with rodents, with labeled components. During testing, the funnel is filled with a 30% sucrose solution, which rats drink from the spout. (B) Close-up image of a rat drinking from the spout, recorded via the lickometer webcam. Note the protruded tongue contacting the spout (yellow arrow). (C) Representative lick force graph generated by LabChart software showing 25 s of drinking. Peaks with the highest lick forces are automatically labeled; 9 peaks in this case. For this rat, each labeled peak is followed by 10–30 lower force licks (i.e., ∼1:20 ratio).
FIGURE 4
FIGURE 4
Resisto-spout design and calibration. (A) Our custom exercise spout (i.e., resisto-spout) with disassembled components (labeled), designed for home-cage use by individual rats. (B) The assembled resisto-spout replaces the standard vivarium water bottle during the overnight (12 h) exercise period. (C) Demonstration of lick force calibration (in grams) using a hand-held analog tension force meter (gauge). The spout force setting is manually adjusted to the target level for an individual rat by turning the Allen screw further in/out of the spout shaft, followed by re-testing with the force gauge. To measure the resisto-spout force setting, the resisto-spout and force gauge are secured in each hand and positioned perpendicular on an immovable tabletop. The tip of the gauge lever is precisely positioned to contact only the ball bearing that slightly protrudes from the spout tip. Pressure is incrementally applied to the ball bearing by manually moving the gauge dial slowly toward the resisto-spout in a single smooth, uninterrupted manner. The “reading” on the dial at which liquid begins to leak from the spout tip (red arrow) corresponds with the resisto-spout force setting.
FIGURE 5
FIGURE 5
Baseline MVLF and corresponding resisto-spout force settings and exercise intensity. Baseline MVLF was used to determine the resisto-spout force setting and corresponding exercise intensity level for individual rats. (A) Baseline MVLF performance was similar (∼20 g) across the four experimental groups (i.e., no significant pairwise differences). (B) Resisto-spout force settings also were similar (∼29 g) between the two exercise groups. (C) The average exercise intensity was similar (∼40%) between both groups of exercised rats, which is consistent with our targeted low (<50%) intensity exercise paradigm. Error bars = standard error of the mean; n = group sample size; numbers in bars = average group value for each dependent variable.
FIGURE 6
FIGURE 6
Effect of tongue exercise on VFSS-based lick and swallow function. (A–D) Scatter plots of baseline vs. endline values and the regression lines from the fitted generalized regression model are shown for each VFSS outcome measure. The estimated difference between any pair of groups is the vertical distance between the corresponding lines. Significant differences between the regression lines are summarized in (E–H) as corresponding overlay boxplots (median, quartiles, and whiskers; mean = diamond) and dot plots (individual data points) to highlight the significant treatment effects at the Day 8 time point in our CTB-SAP model. Data points outside the whiskers are considered mild outliers; there were no extreme outliers. Note that only 3 of the 4 VFSS outcome measures (i.e., lick rate, swallow rate, and lick-swallow-ratio) were significantly impaired in the ‘CTB-SAP + sham exercise’ group, but only lick rate was significantly improved in the ‘CTB-SAP + exercise’ group. Specifically, compared to the ‘control + sham exercise’ group, lick rate was significantly slower in the ‘CTB-SAP + sham exercise’ group (p < 0.001) but not the ‘CTB-SAP + exercise’ group (p = 0.0689). Moreover, lick rate was significantly different between the two CTB-SAP groups (i.e., faster for the ‘CTB-SAP + exercise’ group; p < 0.042). Thus, our CTB-SAP model develops impaired lick motility that is beneficially improved by targeted tongue exercise. (B) Swallow rate was significantly slower in both CTB-SAP groups (‘CTB-SAP + sham exercise’: p = 0.0017; ‘CTB-SAP + exercise’: p = 0.0021) compared to the ‘control + sham exercise’ group, but targeted tongue exercise had no effect on this VFSS outcome measure. (C) Lick-swallow ratio was significantly lower in both CTB-SAP groups (‘CTB-SAP + sham exercise’: p = 0.0048; ‘CTB-SAP + exercise’: p = 0.0072) compared to the ‘control + sham exercise’ group but was unaffected by tongue exercise. (D) Pharyngeal transit time was not significantly different between experimental groups. Error bars = standard error of the mean; n = group sample size; asterisks indicate significant difference (p < 0.05) between pairwise groups.
FIGURE 7
FIGURE 7
Effect of tongue exercise on maximum voluntary lick force (MVLF). MVLF data are graphically summarized as a GLM regression plot (A) and corresponding overlay boxplots and dot plots (B) highlighting treatment effects at Day 8. Data points outside the boxplot whiskers are considered mild outliers. Compared to the ‘control + sham exercise’ group, MVLF was significantly reduced in the ‘CTB-SAP + sham exercise’ group (p = 0.0135). Moreover, MVLF was significantly different between the two CTB-SAP groups (i.e., higher for the ‘CTB-SAP + exercise’ group; p = 0.0016). MVLF also was significantly higher for the ‘CTB-SAP + exercise’ group compared to the ‘control + sham exercise’ group (p = 0.027). Thus, our CTB-SAP model develops impaired tongue strength that is beneficially improved (i.e., surpasses control levels) by targeted tongue exercise. Error bars = standard error of the mean; n = group sample size; asterisk indicates a significant difference (p < 0.05) between pairwise groups.
FIGURE 8
FIGURE 8
Structural changes in the brainstem in the absence and presence of tongue exercise. (A–D) In vivo diffusion weighted MRI of brainstem sagittal slice at Bregma position 0.0 mm shows a trend for an enlargement of the 4th ventricle in sham exercise-treated CTB-SAP rats (B, denoted by white arrow) vs. sham exercise-treated controls (A), suggesting degeneration of neighboring brainstem tissue (i.e., XII nucleus). Following tongue exercise, the size of the 4th ventricle (denoted by white arrow) in CTB-SAP rats (D) appeared to resemble that of sham exercise-treated (A) and exercise-treated (C) control rats, suggesting that tongue exercise may prevent or decrease/slow degeneration in CTB-SAP rats and provides sufficient preliminary evidence to continue collecting these non-invasive translational measurements with larger group sample sizes. (E) MRI segmented 4th ventricle volume showed no significant differences across groups (p = 0.075). Error bars = standard error of the mean; n = group sample size.
FIGURE 9
FIGURE 9
Structural changes in the tongue in the absence and presence of tongue exercise. (A–D) In vivo T2-weighted MRI of the axial images at the A-P position 4.8 mm from the anterior apex of the tongue shows hyperintensity (i.e., increased brightness, denoted by white arrows) and increased tongue thickness and volume in sham exercise-treated CTB-SAP rats (B) vs. sham exercise-treated controls (A), suggesting hypertrophy of the tongue and is consistent with muscle fiber inflammation and fatty replacement of atrophied muscle fibers. Following tongue exercise, tongue thickness, volume, and intensity in CTB-SAP rats (D) resembled that of sham exercise-treated and exercise-treated control rats (A,C), suggesting that tongue exercise may prevent or decrease/slow degenerative structural changes in CTB-SAP rats. Tongue thickness and width are indicated by vertical and horizontal double arrows, respectively in (A). (E) MRI segmentation of tongue volume showed a significant increase in the ‘CTB-SAP + sham exercise’ group vs. the ‘control + exercise’ group (p = 0.05) but was not significantly different compared to ‘CTB SAP + exercise’ (p = 0.08) and ‘control + sham exercise’ (p = 0.18) groups. (F) Tongue thickness was significantly increased in the ‘CTB-SAP + sham exercise’ group vs. the ‘control + sham exercise group’ (p = 0.05). (G,H) The tongue blade and root widths were not significantly different across groups (p = 0.251 and p = 0.1805, respectively). Error bars = standard error of the mean; n = group sample size.

Similar articles

Cited by

References

    1. Alves P. (2010). Imaging the hypoglossal nerve. Eur. J. Radiol. 74 368–377. 10.1016/j.ejrad.2009.08.028 - DOI - PubMed
    1. Anderson T., Kearney J. T. (1982). Effects of three resistance training programs on muscular strength and absolute and relative endurance. Res. Q. Exerc. Sport 53 1–7. 10.1080/02701367.1982.10605218 - DOI - PubMed
    1. Argolo N., Sampaio M., Pinho P., Melo A., Nobrega A. C. (2013). Do swallowing exercises improve swallowing dynamic and quality of life in Parkinson’s disease? NeuroRehabilitation 32 949–955. 10.3233/NRE-130918 - DOI - PubMed
    1. Baumer D., Talbot K., Turner M. R. (2014). Advances in motor neurone disease. J. R. Soc. Med. 107 14–21. - PMC - PubMed
    1. Bede P., Chipika R. H., Finegan E., Li Hi Shing S., Doherty M. A., Hengeveld J. C., et al. (2019). Brainstem pathology in amyotrophic lateral sclerosis and primary lateral sclerosis: a longitudinal neuroimaging study. Neuroimage Clin. 24:102054. - PMC - PubMed