

Redistribution of Doctors and Decentralization of Clinics Improved Utilization of Services, Demand, and Capacity of Hamad Medical Corporation's Staff Clinic
- PMID: 35844307
- PMCID: PMC9278801
- DOI: 10.7759/cureus.25883
Redistribution of Doctors and Decentralization of Clinics Improved Utilization of Services, Demand, and Capacity of Hamad Medical Corporation's Staff Clinic
Abstract
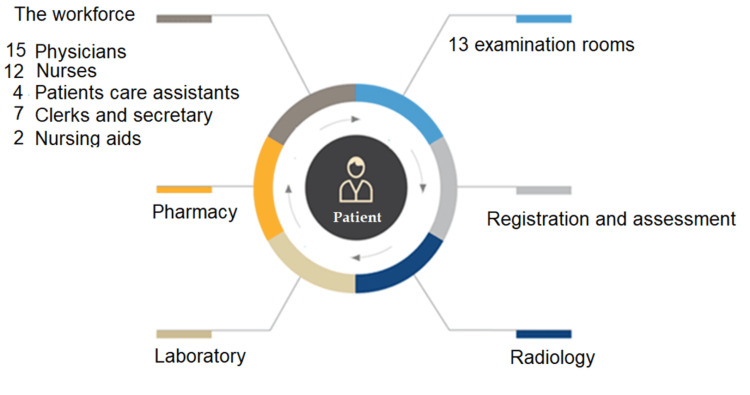
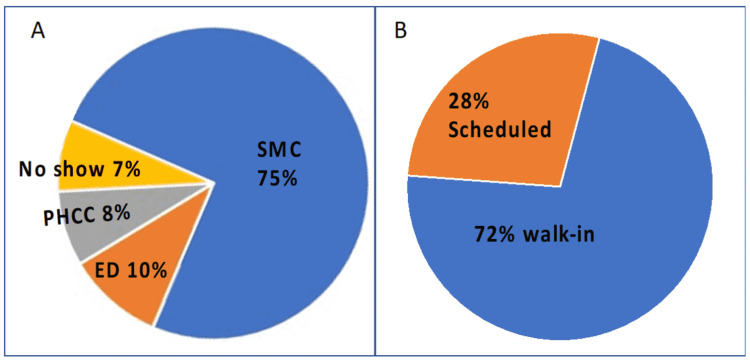
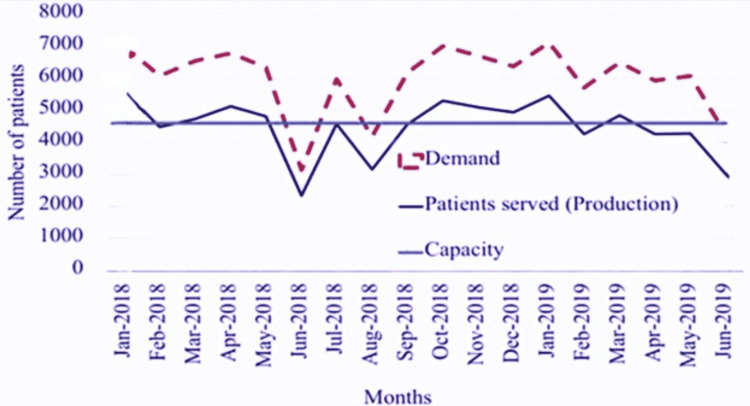
Background: The Staff Medical Clinic (SMC) of the Hamad Medical Corporation (HMC) serves the staff members who require healthcare services, but in a crowded environment, the SMC can only meet 75% of that demand. Overcrowding reduces productivity and service quality and increases waiting time. Furthermore, overcrowding in healthcare facilities decreases the experience and satisfaction of patients and healthcare providers.
Aim: The main objective of this study was to use simulation modeling to evaluate interventions that could improve SMC waiting time and efficiency.
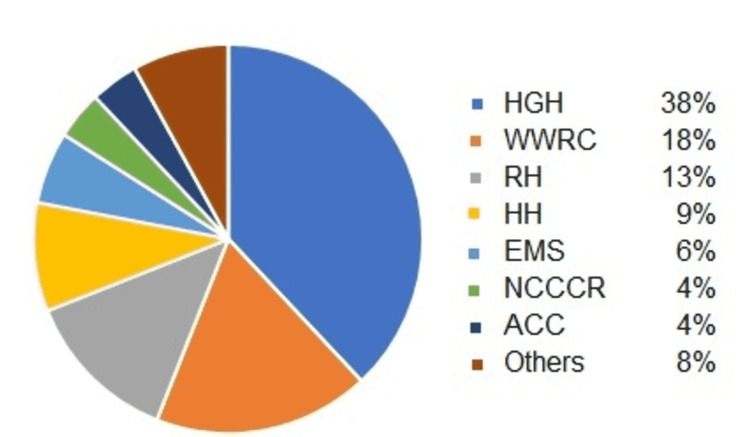
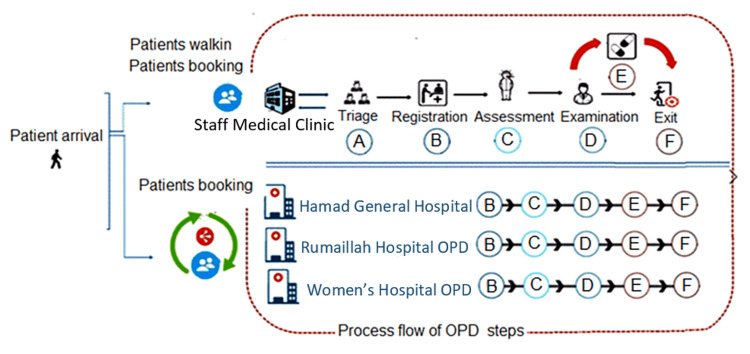
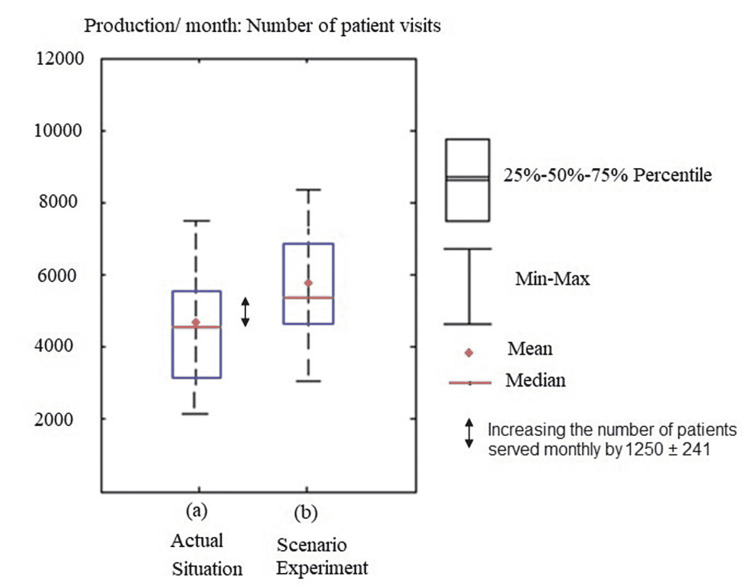
Method: Eighteen months of data on SMC patient flow, staffing, and clinical sessions were collected (January 2018 to June 2019). The patient's journey through the SMC was modeled as a series of processes with assigned durations defined mathematically using the appropriate probability distribution. A simulation flow model was developed considering the locations of the staff and nearby main hospital facilities. An intervention was proposed and evaluated through a simulation. The intervention involved redistributing 25% of the SMC staff into three main satellite clinics located at the facilities where most of the SMC patients came. Results: The proposed intervention decreased crowding by 37%, reduced staffing requirements by 28%, and increased the number of patient slots by 22%, resulting in a net increase in the number of patients served by an average of 1250 monthly, without the need for hiring new additional staffing.
Conclusion: Redistribution of the available medical staff to three new satellite clinics reduces workload pressure at all sites and increases clinic capacity without additional costs.
Keywords: patient flow; physician redistribution; simulation; staff clinic; waiting time.
Copyright © 2022, Habas et al.
Conflict of interest statement
The authors have declared that no competing interests exist.
Figures
References
-
- Using discrete-event simulation in strategic capacity planning for an outpatient physical therapy service. Rau CL, Tsai PF, Liang SF, et al. Health Care Manag Sci. 2013;16:352–365. - PubMed
-
- Using simulation modeling to improve patient flow at an outpatient orthopedic clinic. Rohleder TR, Lewkonia P, Bischak DP, Duffy P, Hendijani R. Health Care Manag Sci. 2011;14:135–145. - PubMed
LinkOut - more resources
Full Text Sources