

Dampened Inflammatory Signalling and Myeloid-Derived Suppressor-Like Cell Accumulation Reduces Circulating Monocytic HLA-DR Density and May Associate With Malignancy Risk in Long-Term Renal Transplant Recipients
- PMID: 35844527
- PMCID: PMC9283730
- DOI: 10.3389/fimmu.2022.901273
Dampened Inflammatory Signalling and Myeloid-Derived Suppressor-Like Cell Accumulation Reduces Circulating Monocytic HLA-DR Density and May Associate With Malignancy Risk in Long-Term Renal Transplant Recipients
Abstract
Background: Malignancy is a major cause of morbidity and mortality in transplant recipients. Identification of those at highest risk could facilitate pre-emptive intervention such as reduction of immunosuppression. Reduced circulating monocytic HLA-DR density is a marker of immune depression in the general population and associates with poorer outcome in critical illness. It has recently been used as a safety marker in adoptive cell therapy trials in renal transplantation. Despite its potential as a marker of dampened immune responses, factors that impact upon monocytic HLA-DR density and the long-term clinical sequelae of this have not been assessed in transplant recipients.
Methods: A cohort study of stable long-term renal transplant recipients was undertaken. Serial circulating monocytic HLA-DR density and other leucocyte populations were quantified by flow cytometry. Gene expression of monocytes was performed using the Nanostring nCounter platform, and 13-plex cytokine bead array used to quantify serum concentrations. The primary outcome was malignancy development during one-year follow-up. Risk of malignancy was calculated by univariate and multivariate proportionate hazards modelling with and without adjustment for competing risks.
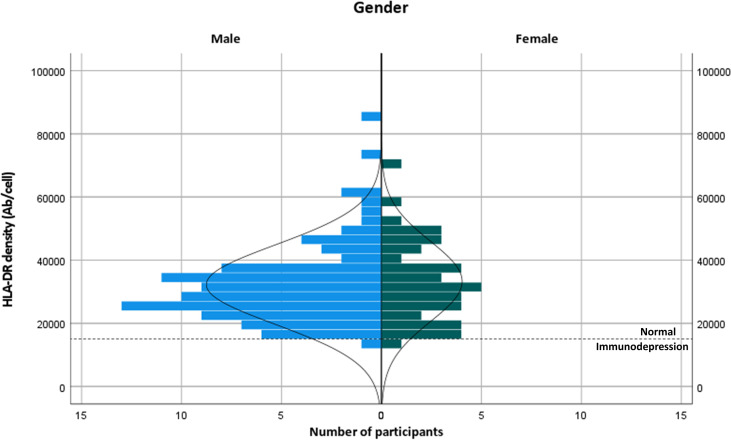
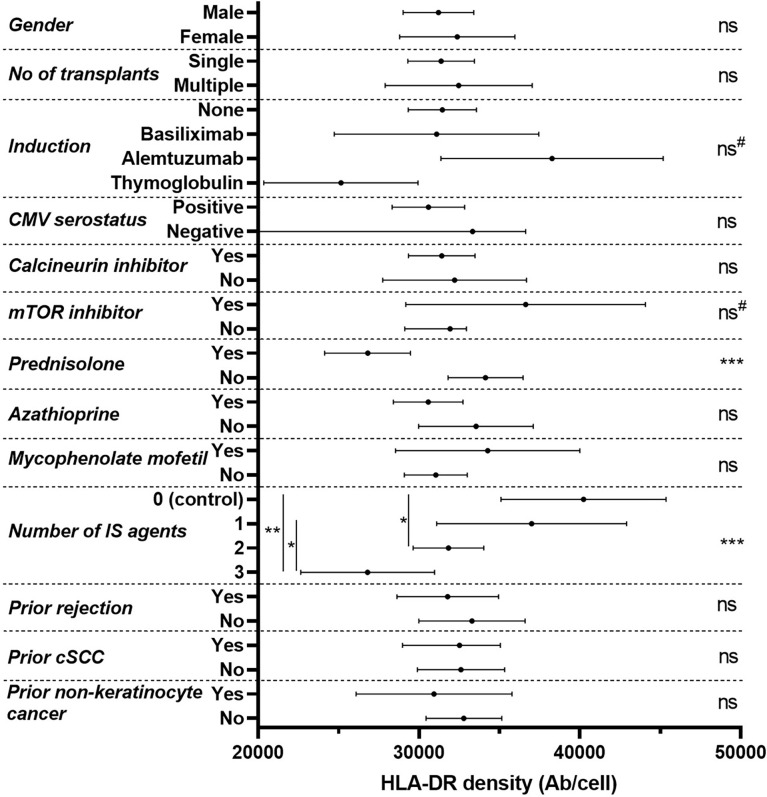
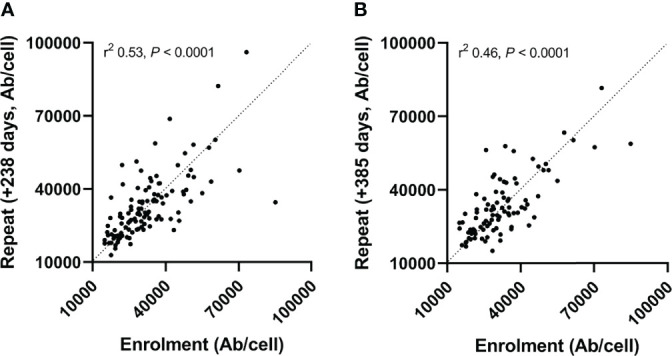
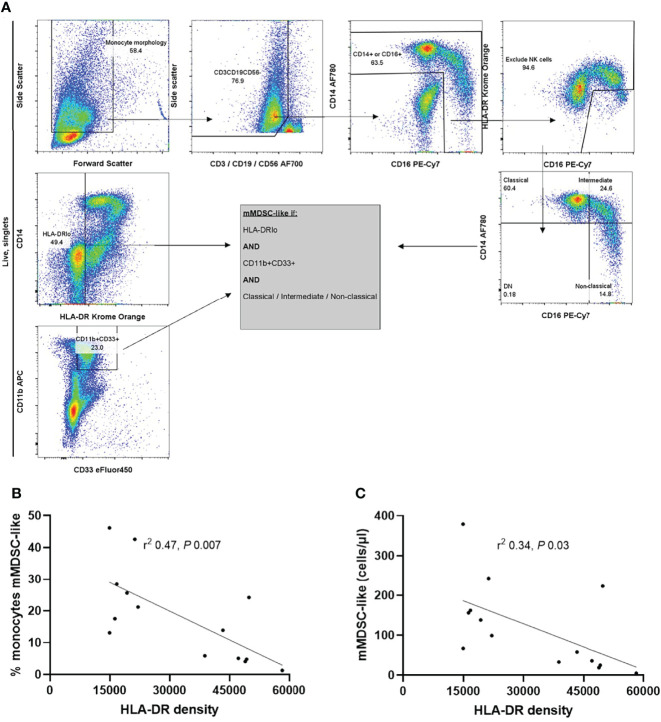
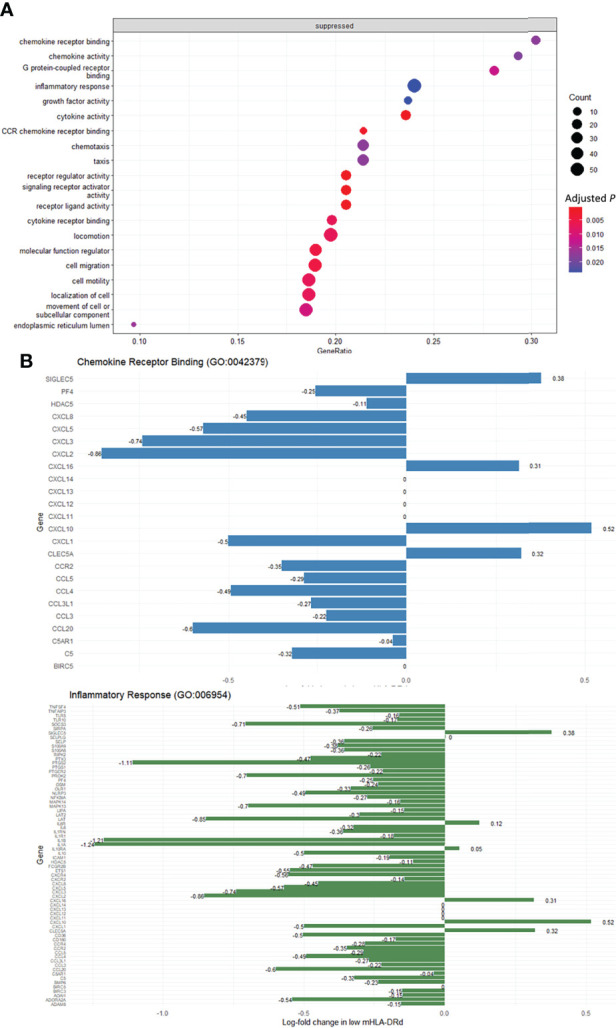
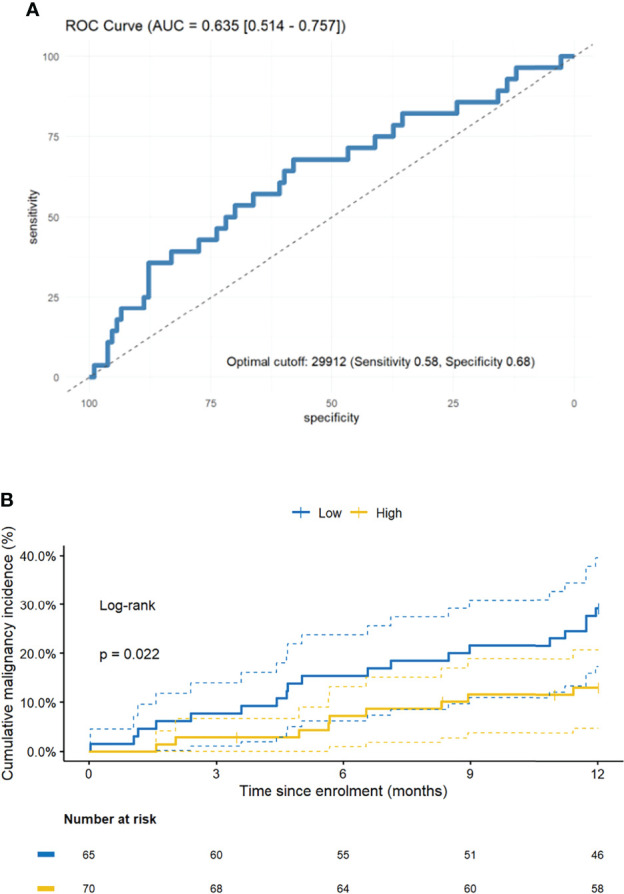
Results: Monocytic HLA-DR density was stable in long-term renal transplant recipients (n=135) and similar to non-immunosuppressed controls (n=29), though was suppressed in recipients receiving prednisolone. Decreased mHLA-DRd was associated with accumulation of CD14+CD11b+CD33+HLA-DRlo monocytic myeloid-derived suppressor-like cells. Pathway analysis revealed downregulation of pathways relating to cytokine and chemokine signalling in monocytes with low HLA-DR density; however serum concentrations of major cytokines did not differ between these groups. There was an independent increase in malignancy risk during follow-up with decreased HLA-DR density.
Conclusions: Dampened chemokine and cytokine signalling drives a stable reduction in monocytic HLA-DR density in long-term transplant recipients and associates with subsequent malignancy risk. This may function as a novel marker of excess immunosuppression. Further study is needed to understand the mechanism behind this association.
Keywords: HLA-DR; cytokines; gene expression; immunosuppression; kidney transplantation; long term; malignancy; monocyte.
Copyright © 2022 Bottomley, Harden, Wood, Hester and Issa.
Conflict of interest statement
The authors declare that the research was conducted in the absence of any commercial or financial relationships that could be construed as a potential conflict of interest.
Figures
Similar articles
-
Persistent accumulation of circulating monocytic myeloid-derived suppressor cells contributes to post-infectious immunosuppression in renal transplant recipients with bacterial infection: A pilot study.Transpl Immunol. 2018 Jun;48:10-17. doi: 10.1016/j.trim.2018.02.007. Epub 2018 Feb 22. Transpl Immunol. 2018. PMID: 29477752
-
A circulating subpopulation of monocytic myeloid-derived suppressor cells as an independent prognostic/predictive factor in untreated non-small lung cancer patients.J Immunol Res. 2014;2014:659294. doi: 10.1155/2014/659294. Epub 2014 Nov 11. J Immunol Res. 2014. PMID: 25436215 Free PMC article.
-
The CD14+HLA-DRlo/neg Monocyte: An Immunosuppressive Phenotype That Restrains Responses to Cancer Immunotherapy.Front Immunol. 2019 May 22;10:1147. doi: 10.3389/fimmu.2019.01147. eCollection 2019. Front Immunol. 2019. PMID: 31191529 Free PMC article. Review.
-
Early Posttransplant Mobilization of Monocytic Myeloid-derived Suppressor Cell Correlates With Increase in Soluble Immunosuppressive Factors and Predicts Cancer in Kidney Recipients.Transplantation. 2020 Dec;104(12):2599-2608. doi: 10.1097/TP.0000000000003179. Transplantation. 2020. PMID: 32068661
-
Monocytic HLA-DR Expression in Immune Responses of Acute Pancreatitis and COVID-19.Int J Mol Sci. 2023 Feb 7;24(4):3246. doi: 10.3390/ijms24043246. Int J Mol Sci. 2023. PMID: 36834656 Free PMC article. Review.
Cited by
-
Standardization of neutrophil CD64 and monocyte HLA-DR measurement and its application in immune monitoring in kidney transplantation.Front Immunol. 2022 Nov 23;13:1063957. doi: 10.3389/fimmu.2022.1063957. eCollection 2022. Front Immunol. 2022. PMID: 36505404 Free PMC article.
-
Managing the immune microenvironment of osteosarcoma: the outlook for osteosarcoma treatment.Bone Res. 2023 Feb 27;11(1):11. doi: 10.1038/s41413-023-00246-z. Bone Res. 2023. PMID: 36849442 Free PMC article. Review.
-
Barriers to Treg therapy in Europe: From production to regulation.Front Med (Lausanne). 2023 Jan 19;10:1090721. doi: 10.3389/fmed.2023.1090721. eCollection 2023. Front Med (Lausanne). 2023. PMID: 36744143 Free PMC article. Review.
References
-
- Harwood CA, Mesher D, McGregor JM, Mitchell L, Leedham-Green M, Raftery M, et al. . A Surveillance Model for Skin Cancer in Organ Transplant Recipients: A 22-Year Prospective Study in an Ethnically Diverse Population. Am J Transplant (2013) 13(1):119–29. doi: 10.1111/j.1600-6143.2012.04292.x - DOI - PubMed
MeSH terms
Substances
Grants and funding
LinkOut - more resources
Full Text Sources
Medical
Molecular Biology Databases
Research Materials