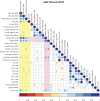
. 2022 Jun 30:13:886442.
doi: 10.3389/fimmu.2022.886442. eCollection 2022.

Altered Balance of Pro-Inflammatory Immune Cells to T Regulatory Cells Differentiates Symptomatic From Asymptomatic Individuals With Anti-Nuclear Antibodies

Affiliations

Altered Balance of Pro-Inflammatory Immune Cells to T Regulatory Cells Differentiates Symptomatic From Asymptomatic Individuals With Anti-Nuclear Antibodies

Rashi Gupta et al. Front Immunol. .

Abstract

Systemic Autoimmune Rheumatic Diseases (SARDs) are characterized by the production of anti-nuclear antibodies (ANAs). ANAs are also seen in healthy individuals and can be detected years before disease onset in SARD. Both the immunological changes that promote development of clinical symptoms in SARD and those that prevent autoimmunity in asymptomatic ANA+ individuals (ANA+ NS) remain largely unexplored. To address this question, we used flow cytometry to examine peripheral blood immune populations in ANA+ individuals, with and without SARD, including 20 individuals who subsequently demonstrated symptom progression. Several immune populations were expanded in ANA+ individuals with and without SARD, as compared with ANA- healthy controls, particularly follicular and peripheral T helper, and antibody-producing B cell subsets. In ANA+ NS individuals, there were significant increases in T regulatory subsets and TGF-ß1 that normalized in SARD patients, whereas in SARD patients there were increases in Th2 and Th17 helper cell levels as compared with ANA+ NS individuals, resulting in a shift in the balance between inflammatory and regulatory T cell subsets. Patients with SARD also had increases in the proportion of pro-inflammatory innate immune cell populations, such as CD14+ myeloid dendritic cells, and intermediate and non-classical monocytes, as compared to ANA+ NS individuals. When comparing ANA+ individuals without SARD who progressed clinically over the subsequent 2 years with those who did not, we found that progressors had significantly increased T and B cell activation, as well as increased levels of LAG3+ T regulatory cells and TGF-ß1. Collectively, our findings suggest that active immunoregulation prevents clinical autoimmunity in ANA+ NS and that this becomes impaired in patients who progress to SARD, resulting in an imbalance favoring inflammation.

Keywords: anti-nuclear antibodies; b cells; dendritic cells; interferon-alpha; monocytes; systemic autoimmune rheumatic diseases; t cells; t regulatory cells.


Conflict of interest statement

The authors declare that the research was conducted in the absence of any commercial or financial relationships that could be construed as a potential conflict of interest.

Figures
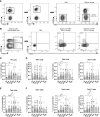
Figure 1
Figure 1
Asymptomatic anti-nuclear antibody positive (ANA+) individuals lacking a diagnosis of systemic autoimmune rheumatic diseases (SARD) have abnormalities in T helper subsets that are amplified in symptomatic patients with early SARD. (A) Gating strategy for identification of (CD3+CD4+CD45RA-) memory T cells from the peripheral blood mononuclear cells of a representative ANA+ patient. (B) Gating strategy for identification of T follicular helper (Tfh, PD-1hiCXCR5+) and T peripheral helper (Tph, PD-1hi, CXCR5-) cells and the Th1 (CXCR3+, CCR6-), Th2 (CXCR3-, CCR6-), and Th17 CXCR3-, CCR6+) subsets within these populations. (C, D) The proportions of Tfh cells and the individual Tfh subsets within the memory T compartment stratified by subject group. (E, F) The proportions of Tph cells and the individual Tph subsets within the memory T compartment stratified by subject group. The solid vertical line in each plot separates the groups that were statistically compared to one another from the individual SARD on the right, which were not statistically compared to any group. Bars represent the median with interquartile range. Each data point represents an individual subject. Statistical significance was determined using the Kruskal-Wallis test with Dunn’s post-hoc test for multiple comparisons; *p ≤ 0.05, **p ≤ 0.01, ***p ≤ 0.001, ****p ≤ 0.0001. HC, ANA- healthy control; ANA, asymptomatic ANA+; UCTD, undifferentiated connective tissue disease; SARD, systemic autoimmune rheumatic disease; SLE, systemic lupus erythematosus; SS, Sjögren’s syndrome; SSc, systemic sclerosis.
Figure 2
Figure 2
T regulatory (Treg) subsets and transforming growth factor beta-1 (TGF-β1) are increased in anti-nuclear antibody positive (ANA+) individuals lacking a systemic autoimmune rheumatic diseases (SARD) diagnosis. (A) Gating strategy for identification of (CD3+CD4+) follicular (CXCR5+) and extra-follicular (CXCR5-) T cells for a representative ANA+ patient. Gating strategy for identification of (B) (HELIOS+FOXP3+) follicular and extra-follicular Tregs and (C) memory (CD45RA-) LAG3+ T regulatory cells (LAG3+ Tregs, LAG3+CD25-). (D–F) The proportions of Treg subsets stratified by subject group. (G) The ratio of memory T peripheral helper 2 cells to extra-follicular Tregs; and the ratio of memory T peripheral helper 17 cells to extra-follicular Tregs stratified by subject group on a log10 scale. (H) Plasma TGF-β1 levels stratified by subject group. (I) The correlation between the proportion of memory LAG3+ Tregs and TGF-β1 levels. The solid vertical line in each plot separates the groups that were statistically compared to one another from the individual SARD on the right, which were not statistically compared to any group. Bars represent the median with interquartile range. Each data point represents an individual subject. Statistical significance was determined using the Kruskal-Wallis test with Dunn’s post-hoc test for multiple comparisons; *p ≤ 0.05, **p ≤ 0.01, ***p ≤ 0.001. The strength of association was determined using a non-parametric Spearman correlation analysis. The solid line of best fit was computed from linear regression. HC, ANA- healthy control; ANA, asymptomatic ANA+; UCTD, undifferentiated connective tissue disease; SARD, systemic autoimmune rheumatic disease; SLE, systemic lupus erythematosus; SS, Sjögren’s syndrome; SSc, systemic sclerosis.
Figure 3
Figure 3
Differences in the frequencies of innate immune populations distinguish anti-nuclear antibody positive (ANA+) individuals lacking a systemic autoimmune rheumatic diseases (SARD) diagnosis from early SARD patients. (A) Gating strategy for identification of CD14-HLA-DR+CD56- plasmacytoid dendritic cells (pDCs, CD123+CD11c-) and myeloid dendritic cells (mDCs, CD123-CD11c+) from the lineage negative compartment (CD3-CD19-CD20-) in a representative ANA+ patient. (B) Gating strategy for identification of CD14+ mDCs (CD14loCD123-CD11c+). (C–E) The proportion of pDCs, mDCs, and CD14+ mDCs stratified by subject group. (F) Gating strategy for identification of classical monocytes (CD16-CD14hi); non-classical monocytes (CD16+CD14lo); and intermediate monocytes (CD16+CD14-). (G) The proportion of the monocyte subsets stratified by subject group. The solid vertical line in each plot separates the groups that were statistically compared to one another from the individual SARD on the right, which were not statistically compared to any group. Bars represent the median with interquartile range. Each data point represents an individual subject. Statistical significance was determined using the Kruskal-Wallis test with Dunn’s post-hoc test for multiple comparisons. *p ≤ 0.05, **p ≤ 0.01, ***p ≤ 0.001. HC, ANA- healthy control; ANA, asymptomatic ANA+; UCTD, undifferentiated connective tissue disease; SARD, systemic autoimmune rheumatic disease; SLE, systemic lupus erythematosus; SS, Sjögren’s syndrome; SSc, systemic sclerosis.
Figure 4
Figure 4
Spearman correlation matrix between cellular and selected serologic/cytokine phenotypes in anti-nuclear antibody positive (ANA+) individuals lacking a systemic autoimmune rheumatic diseases (SARD) diagnosis. The color and size of the dots represents the ρ value, with the scales shown at the bottom of each matrix. Non-significant (p ≥ 0.05) correlations are not displayed. Associations with autoAb levels are highlighted in yellow and those with IFN levels are highlighted in pink. ANA, anti-nuclear autoantibody; CSM, class-switched memory; DN, double-negative; IFN, interferon; TGF, transforming growth factor; mDCs, myeloid dendritic cells; pDCs, plasmacytoid dendritic cells; Tfh, T follicular helper; Tph, T peripheral helper; Tregs, T regulatory cells.
Figure 5
Figure 5
Antinuclear antibody positive (ANA+) individuals lacking a systemic autoimmune rheumatic diseases (SARD) diagnosis who demonstrated symptomatic progression demonstrate differences in adaptive and innate immune populations, relative to non-progressors. All graphs compare progressors and non-progressors at baseline (initial assessment). Patients diagnosed as ANA+ NS or UCTD at initial assessment are represented by the closed circles and the open triangles, respectively. (A) B cell subsets. (B, C) T helper cell subsets. (D) T regulatory cell subsets. (E) Plasma transforming growth factor beta-1 (TGF-β1) levels. (F) Dendritic cell subsets. (G) Monocyte subsets. Bars represent the median with interquartile range. Each data point represents an individual subject. For each set of comparisons, statistical significance was determined using the Mann-Whitney test. *p ≤ 0.05, **p ≤ 0.01. P, Progressors; NP, Non-Progressors.

Similar articles

Cited by

References

    1. Bentham J, Morris DL, Cunninghame Graham DS, Pinder CL, Tombleson P, Behrens TW, et al. . Genetic Association Analyses Implicate Aberrant Regulation of Innate and Adaptive Immunity Genes in the Pathogenesis of Systemic Lupus Erythematosus. Nat Genet (2015) 47(12):1457–64. doi: 10.1038/ng.3434 - DOI - PMC - PubMed
    1. Korman BD, Criswell LA. Recent Advances in the Genetics of Systemic Sclerosis: Toward Biological and Clinical Significance. Curr Rheumatol Rep (2015) 17(3):21. doi: 10.1007/s11926-014-0484-x - DOI - PMC - PubMed
    1. Langefeld CD, Ainsworth HC, Cunninghame Graham DS, Kelly JA, Comeau ME, Marion MC, et al. . Transancestral Mapping and Genetic Load in Systemic Lupus Erythematosus. Nat Commun (2017) 8:16021. doi: 10.1038/ncomms16021 - DOI - PMC - PubMed
    1. Lopez-Isac E, Acosta-Herrera M, Kerick M, Assassi S, Satpathy AT, Granja J, et al. . GWAS for Systemic Sclerosis Identifies Multiple Risk Loci and Highlights Fibrotic and Vasculopathy Pathways. Nat Commun (2019) 10(1):4955. doi: 10.1038/s41467-019-12760-y - DOI - PMC - PubMed
    1. Teruel M, Alarcon-Riquelme ME. Genetics of Systemic Lupus Erythematosus and Sjogren's Syndrome: An Update. Curr Opin Rheumatol (2016) 28(5):506–14. doi: 10.1097/BOR.0000000000000310 - DOI - PubMed

Publication types

Substances

Grants and funding