. 2022 Jun 30:13:777113.
doi: 10.3389/fimmu.2022.777113. eCollection 2022.

Naïve Primary Mouse CD8+ T Cells Retain In Vivo Immune Responsiveness After Electroporation-Based CRISPR/Cas9 Genetic Engineering

Affiliations

Naïve Primary Mouse CD8+ T Cells Retain In Vivo Immune Responsiveness After Electroporation-Based CRISPR/Cas9 Genetic Engineering

Petra Pfenninger et al. Front Immunol. .

Abstract

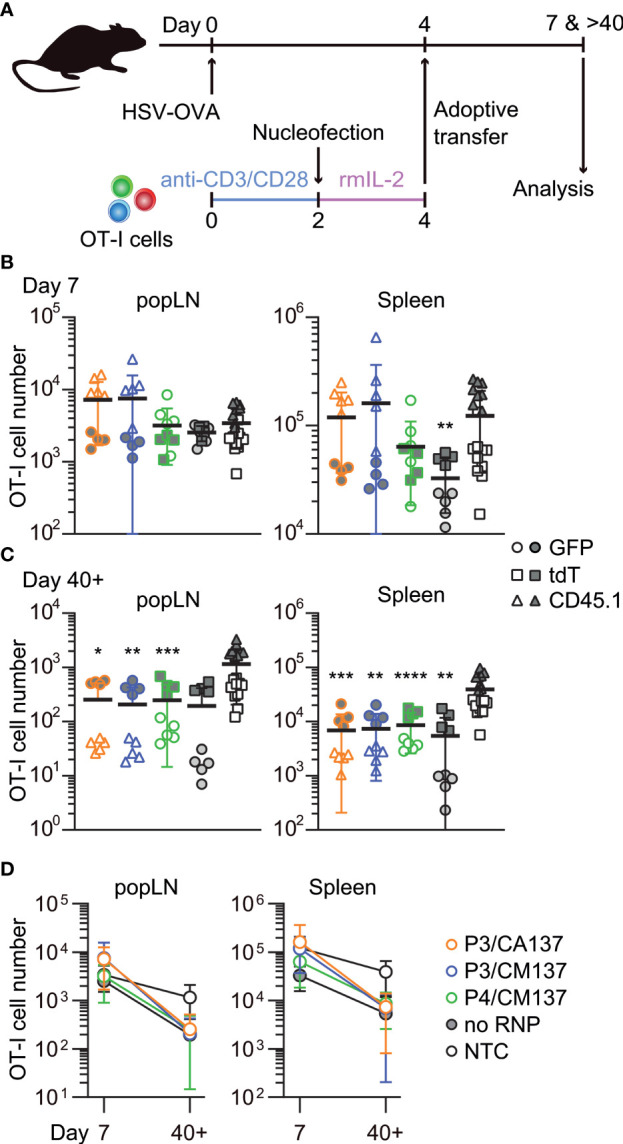
CRISPR/Cas9 technology has revolutionized genetic engineering of primary cells. Although its use is gaining momentum in studies on CD8+ T cell biology, it remains elusive to what extent CRISPR/Cas9 affects in vivo function of CD8+ T cells. Here, we optimized nucleofection-based CRISPR/Cas9 genetic engineering of naïve and in vitro-activated primary mouse CD8+ T cells and tested their in vivo immune responses. Nucleofection of naïve CD8+ T cells preserved their in vivo antiviral immune responsiveness to an extent that is indistinguishable from non-nucleofected cells, whereas nucleofection of in vitro-activated CD8+ T cells led to slightly impaired expansion/survival at early time point after adoptive transfer and more pronounced contraction. Of note, different target proteins displayed distinct decay rates after gene editing. This is in stark contrast to a comparable period of time required to complete gene inactivation. Thus, for optimal experimental design, it is crucial to determine the kinetics of the loss of target gene product to adapt incubation period after gene editing. In sum, nucleofection-based CRISPR/Cas9 genome editing achieves efficient and rapid generation of mutant CD8+ T cells without imposing detrimental constraints on their in vivo functions.

Keywords: CD8+ T cell genetic engineering; CRISPR/Cas9; antiviral immunity; gene inactivation; nucleofection; primary CD8+ T cell; target protein depletion.


Conflict of interest statement

The authors declare that the research was conducted in the absence of any commercial or financial relationships that could be construed as a potential conflict of interest.

Figures

Figure 1
Figure 1
Assessment of knockout efficacy and cellular yield after CRISPR/Cas9 genetic engineering of in vitro-activated CD8+ T cells using nucleofection. (A) Experimental procedure. After activation with anti-CD3ϵ/CD28 antibodies for 2 days, cells were nucleofected with three CD90 crRNAs and then kept in culture in the presence of rmIL-2 for 2 days before analysis. (B) Representative plots from one experiment showing the downregulation of CD90 protein 2 days after nucleofection. Plots are gated on viable CD8+ T cells. (C–D) %CD90.2lo in viable CD8+ T cells (C) and cellular yield (D) on day 2. (E) Nucleofection score calculated as [%CD90lo] × [%Yield]/100. Graphs show pooled data from three independent experiments. (F) Viability of nucleofected and unpulsed control CD8+ T cells at 24 and 48 hours after nucleofection. Graphs show pooled data of n = 5 from four independent experiments. *p < 0.05, **p < 0.01, ***p < 0.001 as compared to unpulsed control by ordinary two-way ANOVA with Dunnett’s multiple comparison. Differences at 24 and 48 hours after nucleofection were statistically non-significant.
Figure 2
Figure 2
In vivo survival/expansion of nucleofected in vitro-activated CD8+ T cells. (A) Experimental scheme. OT-I cells were nucleofected with three CD90 crRNAs using P3/CA137, P3/CM137 or P4/CM137. After nucleofection and 2-day culture in the presence of rmIL-2, 150,000 OT-I cells per group were injected into hosts (450,000 cells in total) that were subcutaneously infected with HSV-OVA 4 days before adoptive transfer of OT-I cells. Each host received three groups including NTC control. (B, C) OT-I cell number in popLN and spleen on days 7 (B) and > 40 (C) after infection. (D) Data shown in B and C plotted in 2D to gauge the severity of contraction. Graphs show pooled data from two independent experiments with n = 8–9 or 14–15 each nucleofected groups or non-nucleofected control, respectively. Congenic marker assignment was swapped in each experiment. *p < 0.05, **p < 0.01, ***p < 0.001, ****p < 0.0001 as compared to NTC by Kruskal-Wallis test with Dunn’s multiple comparison.
Figure 3
Figure 3
Phenotype of in vitro-activated OT-I cells in spleen after adoptive transfer into HSV-OVA-infected hosts. OT-I cells were nucleofected as in Figure 2. (A, B) Expression of CD127 and KLRG1 on OT-I cells in the spleen on days 7 (A) and > 40 (B). Pie charts show the mean frequencies of four populations identified by these two markers. (C) Expression of activation-associated glycoform of CD43 and CXCR3 on OT-I cells in the spleen > 40 days after infection. Pie charts show the mean frequencies of three populations identified by these two markers. Graphs show pooled data from two independent experiments with n = 9 or 15 for each nucleofected group or non-nucleofected control, respectively. Flow cytometric plots are gated on viable OT-I cells identified by the expression of congenic markers and show concatenated data from one of two experiments with n = 5 per group. Congenic marker assignment was swapped in each experiment. *p < 0.005, **p < 0.0001 as compared to NTC by ordinary two-way ANOVA with Dunnett’s multiple comparison.
Figure 4
Figure 4
Recall responses of memory OT-I cells generated from in vitro-activated, nucleofected OT-I cells. (A) Experimental scheme. Mice were treated in the same manner as in Figure 2. On day 30, peripheral blood leukocytes (PBL) were analyzed to determine the number of OT-I cells before secondary infection with 105 pfu LCMV-OVA on day 35. Five days after intraperitoneal LCMV-OVA infection, number and phenotype of OT-I cells in PBL, spleen and popLN were determined by flow cytometry. (B, C) Number of OT-I cells in PBL (B) and popLN and spleen (C). Cell number on day 40 was calculated based on OT-I cell frequencies normalized to those in the blood on day 30. There was no statistically significant difference between NTC and nucleofected groups in all three compartments as analyzed by Kruskal-Wallis test with Dunn’s multiple comparison. (D) Expression of CD127 and KLRG1 on OT-I cells. There was no statistically significant difference between NTC and nucleofected groups in all four subsets as analyzed by ordinary two-way ANOVA with Dunnett’s multiple comparison.
Figure 5
Figure 5
Assessment of knockout efficacy and cellular yield after CRISPR/Cas9 genetic engineering of naïve CD8+ T cells using nucleofection. (A) Experimental procedure. Magnetically isolated CD8+ T cells were kept in culture in the presence of rmIL-7 for 24 hr before nucleofection. Nucleofected cells were kept in culture for additional 5 days before analysis. (B) Representative plots from one experiment showing the downregulation of CD90 protein 5 days after nucleofection. Plots are gated on viable CD8+ T cells. (C, D) %CD90.2lo in viable CD8+ T cells (C) and cellular yield (D) on day 2. (E) Nucleofection score calculated as [%CD90lo] × [%Yield]/100. Graphs show pooled data from 3–4 independent experiments. (F, G) Proliferation of CD8+ T cells after nucleofection. Cells were labelled with CellTrace Violet before placing them in culture on day –1. Dilution of CellTrace Violet was measured by flow cytometry on day 5. Graph shows pooled data from five independent experiments. *p < 0.05, **p < 0.01 as compared to unpulsed control by Kruskal-Wallis test with Dunn’s multiple comparison.
Figure 6
Figure 6
In vivo antiviral immune response of nucleofected naïve CD8+ T cells. (A) Experimental scheme. OT-I cells were nucleofected with three CD90 crRNAs using P4/CM137, P4/DS137 or P5/CM137. One day before subcutaneous HSV-OVA infection, 5,000 OT-I cells per group (a total of 15,000 cells per mouse) were injected into hosts. Each recipient received three groups including freshly isolated OT-I cells. (B) OT-I cell number on day 7 post-infection. No statistically significant difference between nucleofected groups and freshly isolated OT-I cells by Kruskal-Wallis test with Dunn’s multiple comparison (popLN) or ordinary one-way ANOVA with Dunnett’s multiple comparison (spleen). (C, D) CD127 and KLRG1 expression on OT-I cells in popLN (C) and spleen (D) on day 7. *p < 0.05 as compared to NTC by ordinary two-way ANOVA with Dunnett’s multiple comparison. (E–H) Frequency of CD90lo cells in OT-I cells in popLN (E, F) and spleen (G, H) on day 7. Flow cytometric plots are gated on viable OT-I cells identified by the expression of congenic markers and show concatenated data from one of three experiments with n = 5 per group. Congenic marker assignment was swapped in each experiment. Graphs show pooled data from three independent experiments with n = 10–11 or 21–22 for nucleofected groups and freshly-isolated cells, respectively.
Figure 7
Figure 7
Enrichment of DOCK2-knockout cells using simultaneously targeted CD90 as a reporter in naïve CD8+ T cells. DOCK2-GFP CD8+ T cells were nucleofected with CD90 and/or DOCK2 crRNAs using P4/DS137. (A–D) Representative flow cytometric plots of DOCK2-GFP versus CD90 (A), DOCK2-GFP (B) and CD90 (C) among total CD8+ T cells and DOCK2-GFP among CD90lo cells (D). Plots are taken from experiment 3. (E) %CD90lo cells among total CD8+ T cells and %DOCK2-GFPlo cells among total and CD90lo CD8+ T cells. (F) Paired comparison of %DOCK2-GFPlo cells between total and CD90lo CD8+ T cells in six independent experiments. **p < 0.005 by paired t-test. (G) Dock2 mRNA level in sorted CD90lo and CD90hi CD8+ T cells. Data are normalized to the expression level of Dock2 in the control cells that are nucleofected only with three CD90 crRNAs. Cells were sorted on day 7 or 10 for experiments 1–3 or 4–6, respectively. *p < 0.05 by paired t-test. (H) Enrichment efficacy of DOCK2-GFPlo cells by gating on CD90lo cells on each time point measured with %enrichment values. No statistically significant difference by Kruskal-Wallis test with Dunn’s post-hoc. (I, J) Correlation between %enrichment and the frequency of CD90lo (I) or DOCK2-GFPlo cells (J) among total viable CD8+ T cells. Pearson correlation coefficient was computed using the pooled data of six independent experiments.
Figure 8
Figure 8
Disparate kinetics of gene inactivation and protein loss for DOCK2, CD90, CD49d/integrin α4 and CCR7 in naïve CD8+ T cells. (A) Decay of normalized MFI values of target proteins among targetlo cells. (B) Relative MFI values of target proteins calculated by normalizing the values presented in (A) to the MFI value on day 0. Curves defined as y = [100 – (Plateau)] × exp(–K × x) were fitted to the data, with R2 = 0.979, 0.997, 0.999 and 0.999 for DOCK2, CD90, CCR7 and CD49d, respectively. Plateau values and half-life were computed during curve fitting. (C) Kinetics of relative knockout efficacy calculated by normalizing %DOCK2-GFPlo and %CD90lo in each experiment to the corresponding values on day 10. Data were fitted with the equation y = [Plateau] × (1 – exp(–K×x)], with R2 = 0.984, 0.970, 0.999 and 0.926 for DOCK2, CD90, CCR7 and CD49d, respectively. Plateau value and half-time to reach the plateau was estimated from the data during curve fitting. Results of ordinary one-way ANOVA with Dunnett’s multiple comparison of differences in half-life shown in (B, C) are summarized in Table 2. Graphs show pooled data from 3–6 independent experiments. Values of %CD90lo from experiments 5 and 6 (as indicated in Figure 7) were excluded in C because of their continuous increase until day 10.

Similar articles

Cited by

References

    1. Simeonov DR, Marson A. CRISPR-Based Tools in Immunity. Annu Rev Immunol (2019) 37:571–97. doi: 10.1146/annurev-immunol-042718-041522 - DOI - PubMed
    1. Cong L, Ran FA, Cox D, Lin S, Barretto R, Habib N, et al. . Multiplex Genome Engineering Using CRISPR/Cas Systems. Science (2013) 339(6121):819–23. doi: 10.1126/science.1231143 - DOI - PMC - PubMed
    1. Mali P, Yang L, Esvelt KM, Aach J, Guell M, DiCarlo JE, et al. . RNA-Guided Human Genome Engineering via Cas9. Science (2013) 339(6121):823–6. doi: 10.1126/science.1232033 - DOI - PMC - PubMed
    1. Seki A, Rutz S. Optimized RNP Transfection for Highly Efficient CRISPR/Cas9-Mediated Gene Knockout in Primary T Cells. J Exp Med (2018) 215(3):985–97. doi: 10.1084/jem.20171626 - DOI - PMC - PubMed
    1. Kurachi M, Kurachi J, Chen Z, Johnson J, Khan O, Bengsch B, et al. . Optimized Retroviral Transduction of Mouse T Cells for In Vivo Assessment of Gene Function. Nat Protoc (2017) 12(9):1980–98. doi: 10.1038/nprot.2017.083 - DOI - PMC - PubMed

Publication types