. 2022 Jun 30:13:883159.
doi: 10.3389/fimmu.2022.883159. eCollection 2022.

Antigenic Determinants of SARS-CoV-2-Specific CD4+ T Cell Lines Reveals M Protein-Driven Dysregulation of Interferon Signaling

Affiliations

Antigenic Determinants of SARS-CoV-2-Specific CD4+ T Cell Lines Reveals M Protein-Driven Dysregulation of Interferon Signaling

Pedro H Gazzinelli-Guimaraes et al. Front Immunol. .

Abstract

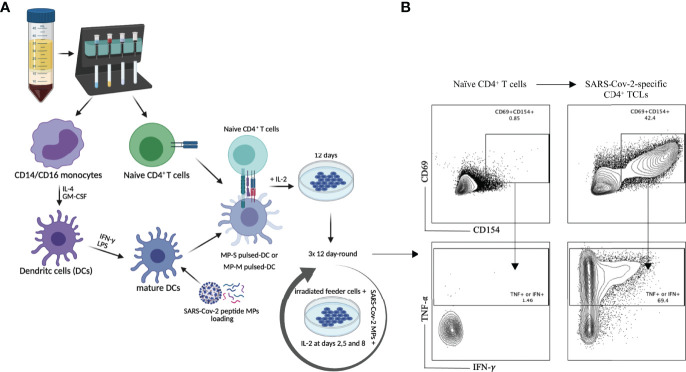
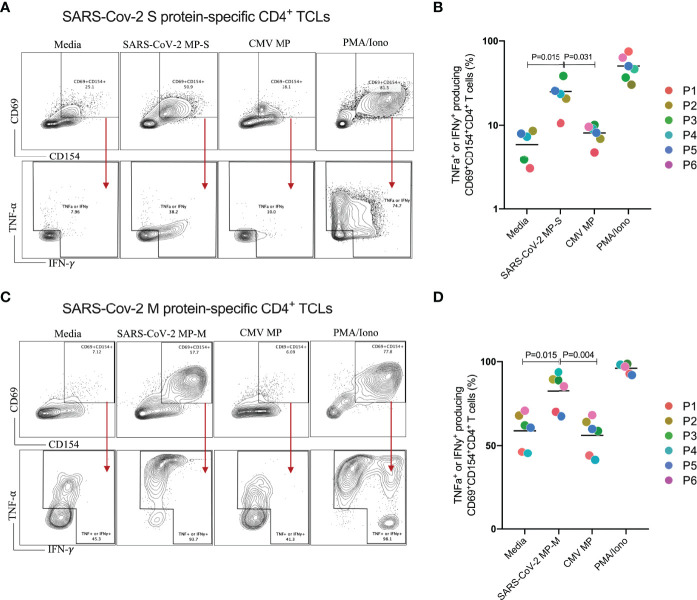
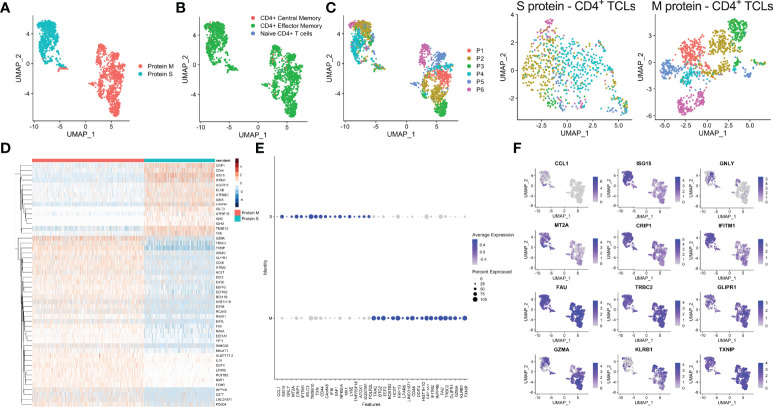
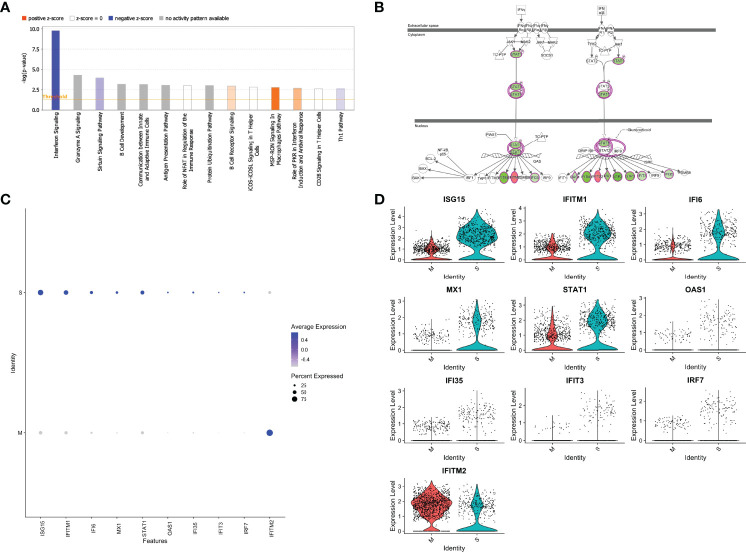
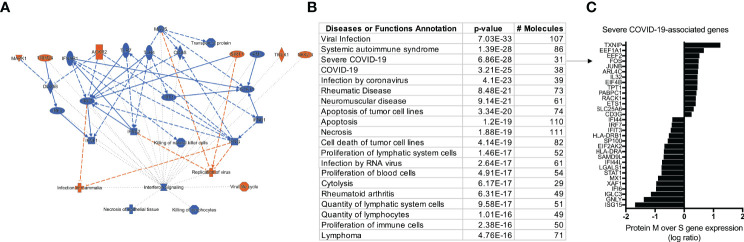
We generated CD4+ T cell lines (TCLs) reactive to either SARS-CoV-2 spike (S) or membrane (M) proteins from unexposed naïve T cells from six healthy donor volunteers to understand in fine detail whether the S and M structural proteins have intrinsic differences in driving antigen-specific CD4+ T cell responses. Having shown that each of the TCLs were antigen-specific and antigen-reactive, single cell mRNA analyses demonstrated that SARS-CoV-2 S and M proteins drive strikingly distinct molecular signatures. Whereas the S-specific CD4+ T cell transcriptional signature showed a marked upregulation of CCL1, CD44, IL17RB, TNFRSF18 (GITR) and IGLC3 genes, in general their overall transcriptome signature was more similar to CD4+ T cell responses induced by other viral antigens (e.g. CMV). However, the M protein-specific CD4+ TCLs have a transcriptomic signature that indicate a marked suppression of interferon signaling, characterized by a downregulation of the genes encoding ISG15, IFITM1, IFI6, MX1, STAT1, OAS1, IFI35, IFIT3 and IRF7 (a molecular signature which is not dissimilar to that found in severe COVID-19). Our study suggests a potential link between the antigen specificity of the SARS-CoV-2-reactive CD4+ T cells and the development of specific sets of adaptive immune responses. Moreover, the balance between T cells of significantly different specificities may be the key to understand how CD4+ T cell dysregulation can determine the clinical outcomes of COVID-19.

Keywords: Sars-CoV-2; immune regulation; interferon signaling; membrane protein; spike (S) glycoprotein.


Conflict of interest statement

AS is a consultant for Gritstone Bio, Flow Pharma, Arcturus Therapeutics, ImmunoScape, CellCarta, Oxford Immunotec, and Avalia Immunotherapies. JL has filed for patent protection for various aspects of T cell epitope and vaccine design work. The remaining authors declare that the research was conducted in the absence of any commercial or financial relationships that could be construed as a potential conflict of interest.

Figures

Figure 1
Figure 1
SARS-Cov-2 antigen-specific CD4+ T-cell line generation from healthy donor PBMC. Panel (A) demonstrates the methodology used for generation of the various TCLs beginning with healthy donor naive T-cells and driven by SARS-Cov-2 structural spike (S) and membrane (M) protein-based peptide megapools. Panel (B) shows a representative flow cytometric dot plot highlighting the immunophenotypic conversion from naïve T cells to SARS-CoV-2-reactive CD4+ TCLs expressing CD69+CD154+ and producing either IFN-γ or TNF-α upon stimulation with SARS-CoV-2 peptide pools. Figure 1A was created with BioRender.com
Figure 2
Figure 2
Profiling of SARS-CoV-2 spike (S) and membrane (M) proteins-specific CD4+ T cell line for antigen specificity. SARS-Cov-2 spike protein-specific CD4+ TCLs from 6 different donors were cultured in vitro in the absence (media) or in the presence of different stimulation conditions including: either SARS-Cov-2 MP-S (1 µg/mL) or MP-M (1 µg/mL); CMV MP-M (1µg/mL), and PMA/ionomycin (0.5/0.05pg/mL). Panels (A–C) show a representative flow cytometric analysis of the of both MP-S or MP-M-specific CD4+ TCLs expressing CD69+CD154+ and the subsequent antigen-specific cells expressing either IFN-γ+ or TNF-α+ after the different stimulation conditions. Panels B and D reveal the specificity and the reactivity of the six MP-S specific CD4+ TCLs (B) or the six MP-M specific CD4+ TCLs (D) demonstrating the frequency of CD69+CD154+ TCLs producing either IFN-γ or TNF-α upon stimulation, in comparison with the unstimulated condition. Each plot represents the CD4+ TCLs from each donor (colored from P1-P6). All differences by Wilcoxon matched-pairs test with P < 0.05 are indicated in the graph.
Figure 3
Figure 3
Single-cell transcriptional profiling of SARS-CoV-2 spike (S) and membrane (M) protein-specific CD4+ T cell lines (A). SingleR analysis utilizing Novershtern Hematopoietic database for cell identification (B). Exome SNP data by Demuxlet algorithm was used to call cell genotypes in order to demultiplex the aggregate analysis of both S-reactive or M-reactive TCLs by patient-specific manner (colored from P1-P6) is displayed by manifold approximation and projection (UMAP) (C). (D) Heatmap showing expression of the most significantly 50 enriched transcripts in each cluster. Dot and feature graph highlighting the average expression and percent expression of selected marker transcripts in each cluster (E, F).
Figure 4
Figure 4
SARS-CoV-2 membrane (M) protein downregulates types I, II, III interferon pathway signaling in CD4+ T cell lines generated from unexposed individuals. Canonical signaling pathways of immunological relevance affected in M protein-specific TCLs (A) indicating a marked suppression interferon signaling pathway and others, including Th1 pathway. (B) Map of the interferon signaling pathway indicating the 9 downstream molecules that were associated with the suppression of interferon, where in green are the genes affected negatively or in red the genes upregulated by SARS-CoV-2 M protein. Feature graph (C) and the violin plot graph (D) showing the average expression and the percent expression of the interferon signaling pathway genes in the respective S-protein-specific CD4+ T cell lines and M-protein-specific CD4+ T cell lines. Figures 4A and 4B were generated by QIAGEN Ingenuity Pathway Analysis.
Figure 5
Figure 5
IPA analysis demonstrating an overview summary of the major biological events in the transcriptome of SARS-CoV-2 M protein-reactive CD4+ TCLs (A) and The Disease or Function View highlighting how the SARS-Cov-2 specific-CD4+ TCLs relate to other diseases and functions through the ingenuity ontology (B). Severe COVID-19 associated genes that overlap with the marked differentially expressed genes in the SARS-Cov-2 M protein-reactive CD4+ TCLs (C). Figure 5A was generated by QIAGEN Ingenuity Pathway Analysis.

Similar articles

Cited by

References

    1. Hu B, Guo H, Zhou P, Shi ZL. Characteristics of SARS-CoV-2 and COVID-19. Nat Rev Microbiol (2021) 19(3):141–54. doi: 10.1038/s41579-020-00459-7 - DOI - PMC - PubMed
    1. Raoult D, Zumla A, Locatelli F, Ippolito G, Kroemer G. Coronavirus Infections: Epidemiological, Clinical and Immunological Features and Hypotheses. Cell Stress (2020) 4(4):66–75. doi: 10.15698/cst2020.04.216 - DOI - PMC - PubMed
    1. Le Bert N, Tan AT, Kunasegaran K, Tham CYL, Hafezi M, Chia A, et al. . SARS-CoV-2-Specific T Cell Immunity in Cases of COVID-19 and SARS, and Uninfected Controls. Nature (2020) 584(7821):457–62. doi: 10.1038/s41586-020-2550-z - DOI - PubMed
    1. Tan AT, Linster M, Tan CW, Le Bert N, Chia WN, Kunasegaran K, et al. . Early Induction of Functional SARS-CoV-2-Specific T Cells Associates With Rapid Viral Clearance and Mild Disease in COVID-19 Patients. Cell Rep (2021) 34(6):108728. doi: 10.1016/j.celrep.2021.108728 - DOI - PMC - PubMed
    1. Liao M, Liu Y, Yuan J, Wen Y, Xu G, Zhao J, et al. . Single-Cell Landscape of Bronchoalveolar Immune Cells in Patients With COVID-19. Nat Med (2020) 26(6):842–4. doi: 10.1038/s41591-020-0901-9 - DOI - PubMed

Publication types