. 2022 Jun 29:13:907529.
doi: 10.3389/fimmu.2022.907529. eCollection 2022.

Human Milk Oligosaccharides Impact Cellular and Inflammatory Gene Expression and Immune Response

Affiliations

Human Milk Oligosaccharides Impact Cellular and Inflammatory Gene Expression and Immune Response

Fernanda Rosa et al. Front Immunol. .

Abstract

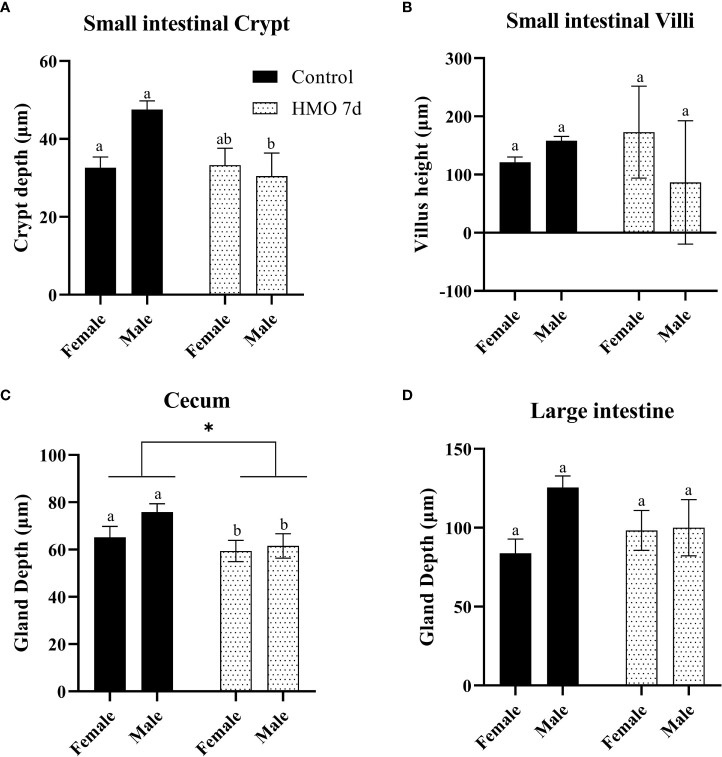
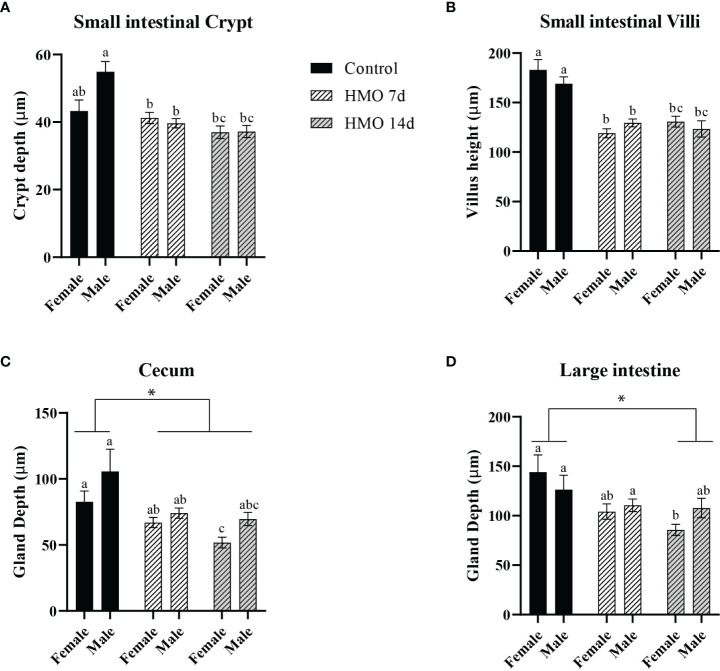
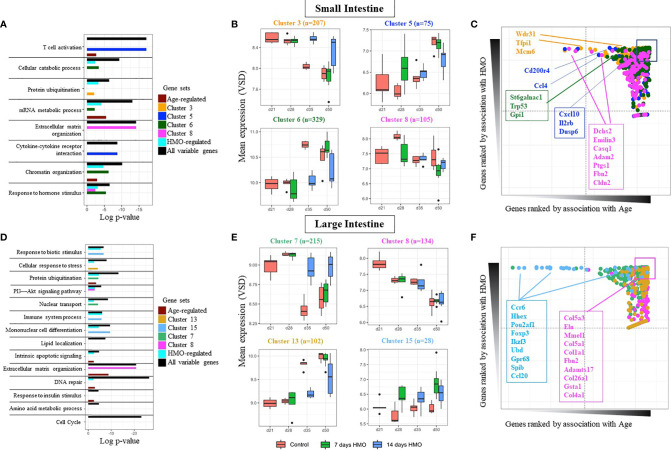
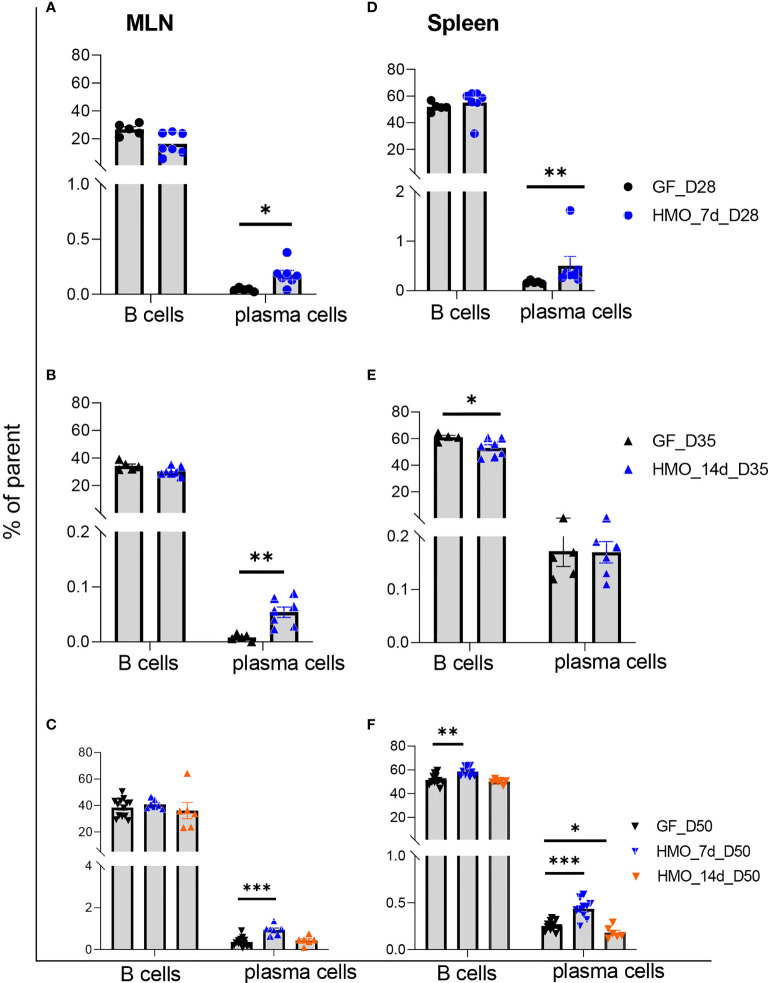
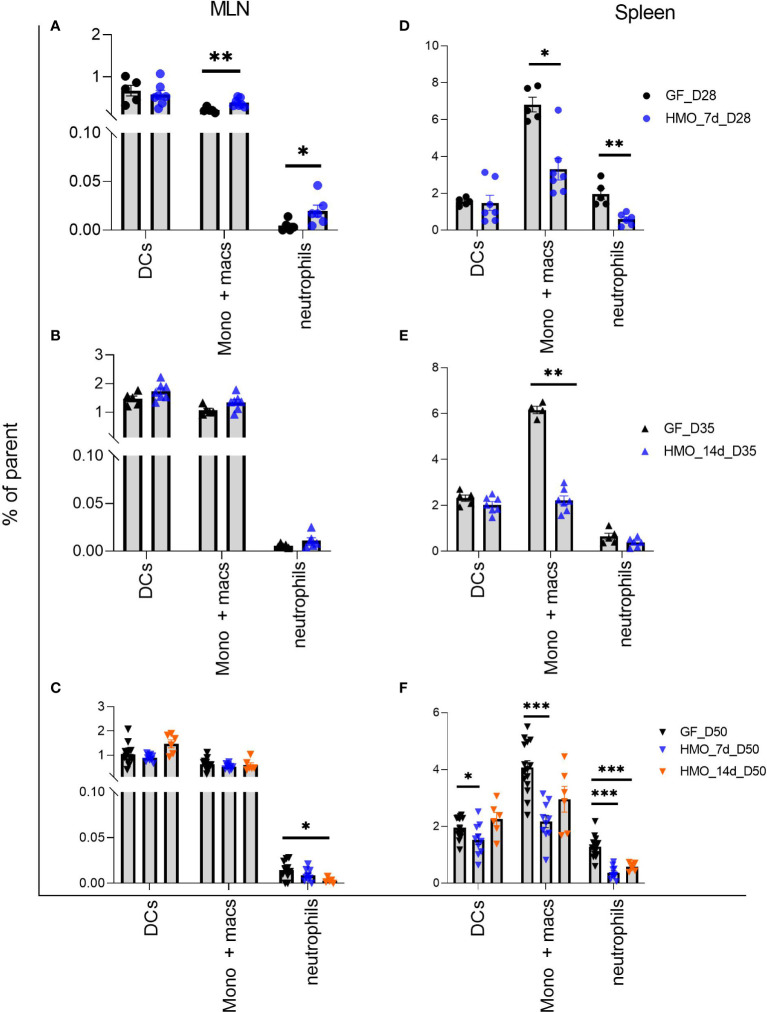
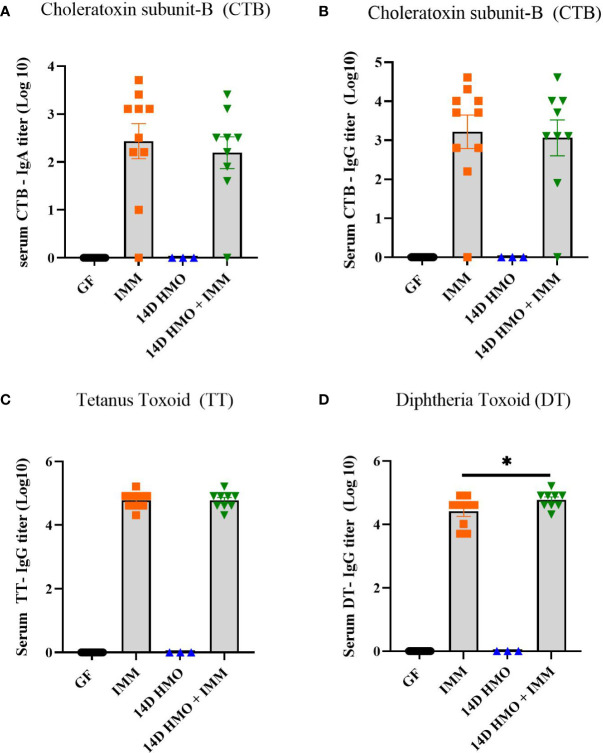
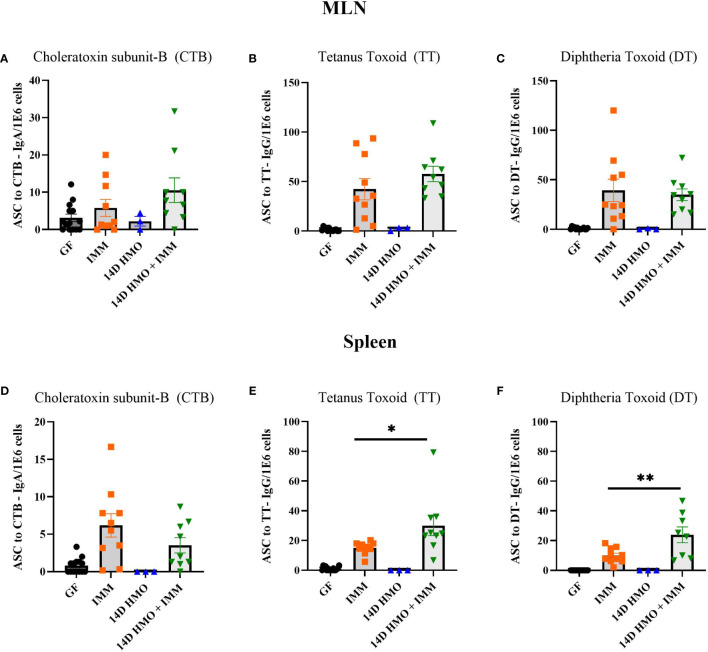
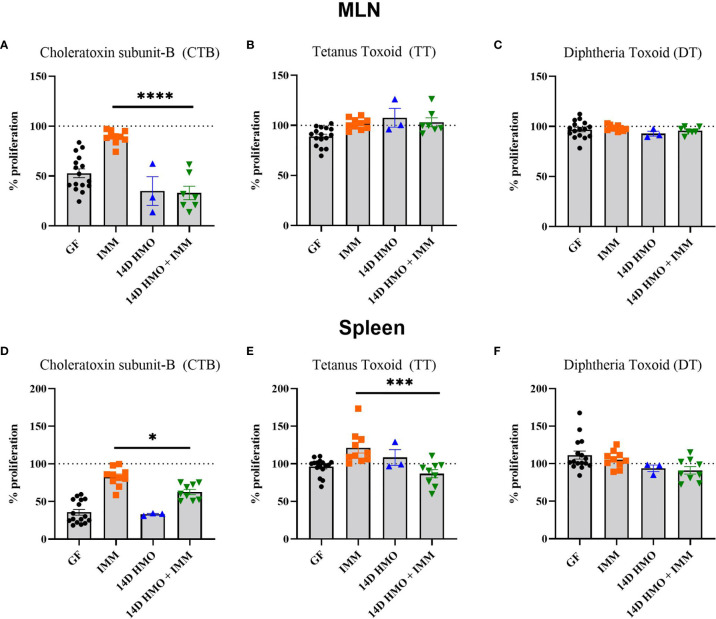
Human milk harbors complex carbohydrates, including human milk oligosaccharides (HMOs), the third most abundant component after lactose and lipids. HMOs have been shown to impact intestinal microbiota, modulate the intestinal immune response, and prevent pathogenic bacterial binding by serving as decoy receptors. However, the direct effect of HMOs on intestinal function and immunity remains to be elucidated. To address this knowledge gap, 21-day-old germ-free mice (C57BI/6) were orally gavaged with 15 mg/day of pooled HMOs for 7 or 14 days and euthanized at day 28 or 35. A set of mice was maintained until day 50 to determine the persistent effects of HMOs. Control groups were maintained in the isolators for 28, 35, or 50 days of age. At the respective endpoints, intestinal tissues were subjected to histomorphometric and transcriptomic analyses, while the spleen and mesenteric lymph nodes (MLNs) were subjected to flow cytometric analysis. The small intestine (SI) crypt was reduced after HMO treatment relative to control at days 28 and 35, while the SI villus height and large intestine (LI) gland depth were decreased in the HMO-treated mice relative to the control at day 35. We report significant HMO-induced and location-specific gene expression changes in host intestinal tissues. HMO treatment significantly upregulated genes involved in extracellular matrix, protein ubiquitination, nuclear transport, and mononuclear cell differentiation. CD4+ T cells were increased in both MLNs and the spleen, while CD8+ T cells were increased in the spleen at day 50 in the HMO group in comparison to controls. In MLNs, plasma cells were increased in HMO group at days 28 and 35, while in the spleen, only at day 28 relative to controls. Macrophages/monocytes and neutrophils were lower in the spleen of the HMO group at days 28, 35, and 50, while in MLNs, only neutrophils were lower at day 50 in the 14-day HMO group. In addition, diphtheria toxoid and tetanus toxoid antibody-secreting cells were higher in HMO-supplemented group compared to controls. Our data suggest that HMOs have a direct effect on gastrointestinal tract metabolism and the immune system even in the absence of host microbiota.

Keywords: HMO; gastrointestinal tract; human milk oligosaccharides; immunity; neonatal.


Conflict of interest statement

The authors declare that the research was conducted in the absence of any commercial or financial relationships that could be construed as a potential conflict of interest.

Figures

Figure 1
Figure 1
Histomorphometric parameters analyzed in the control groups (n=18; M = 11, F = 7) and in the mice that received human milk oligosaccharides (HMOs) for 7 days and euthanized at 28 days of age (n=7; M = 3, F = 4). (A) Small intestinal (SI) crypt depth (µm). (B) SI villus height (µm). (C) Cecal gland depth (µm). (D) Large intestinal gland depth (µm). a,bDifferent superscripts represent the statistical difference between individual groups. *Represents the statistical difference between groups regardless of sex.
Figure 2
Figure 2
Histomorphometric parameters analyzed in the control groups (n=10; M = 5, F = 5) and in the mice that received HMOs for 14 days and euthanized at 35 days of age (n=7; M = 3, F = 4). (A) SI crypt depth (µm). (B) SI villus height (µm). (C) Cecal gland depth (µm). (D) Large intestinal gland depth (µm). a,bDifferent superscripts represent the statistical difference between individual groups. *Represents the statistical difference between groups regardless of sex.
Figure 3
Figure 3
Histomorphometric parameters analyzed in the control groups (n=5; M = 3, F = 2) and in the mice that received HMOs either for 7 days (n=18; M = 11, F = 7) or for 14 days (n=11; M = 8, F = 3) and euthanized at 50 days of age, respectively. (A) SI crypt depth (µm). (B) SI villus height (µm). (C) Cecal gland depth (µm). (D) Large intestinal gland depth (µm). a,b,cDifferent superscripts represent the statistical difference between individual groups. *Represents the statistical difference between groups regardless of sex.
Figure 4
Figure 4
(A) Experimental schema with mice weaned at 21 days of age (n=3 F) and HMO feeding for 7 and 14 days in mice sacrificed at 28, 35, and 50 days. Samples collected from SI and large intestine (LI) at each time point were subjected to RNA-seq to determine the effect of HMO feeding and age on overall gene expression patterns. (B) Variance partition analysis using a global model to find out the contribution of each variable to the overall gene expression variance. (C) Heat map of the top 300 genes most associated with the tissue type in multivariate models, showing maximal location-specific expression; (D) Gene enrichment analysis (GSEA) to estimate the degree of overlap between age-induced and HMO-induced expression alterations. Separately in LI and SI samples, genes were ranked based on variance explained due to age (x-axis), and the segment plots (bottom) highlight the position of the top 300 genes most affected by HMO. The vertical axis in line plots (top) represents the cumulative enrichment score (ES) from GSEA analysis, and NES is the overall normalized enrichment score (with FDR = false discovery rate). Groups (conditions): Control germ-free mice (GF) euthanized either at 28 days of age (n= 9; M=5, F=4) or 35 days of age (n= 5; M=3, F=2) or 50 days of age (n = 5; M=1, F=4) respectively; 7d HMOs euthanized at d28 = GF mice that received 100 μl of HMO through 7 consecutive days and euthanized at 28 days of age (n= 5; M=2, F=3); HMO_14d_D35 = GF mice that received 100 μl of HMO through 14 days and euthanized at 35 days of age (n= 6; M=3, F=3); HMO_7d_D50 = GF mice that received 100 ul of HMO through 7 consecutive days and euthanized at 50 days of age (n= 5; M=1, F=4); HMO_14d_D50 = GF mice that received 100 μl of HMO through 14 consecutive days and euthanized at 50 days of age (n= 10; M=7, F=3).
Figure 5
Figure 5
Gene cluster–based analysis for SI samples (A) Pathway enrichment based for several gene classes: All variable genes (highly variable genes regardless of factor); Age (genes most affected by age), Condition (genes most affected by HMO feeding), and for specific clusters of co-expressed genes (shown here for clusters 3, 5, 6, and 8). (B) Gene expression profile of selected gene clusters in SI samples. Each bar represents data from at least 5 replicates. (C) Rank distribution plot of selected genes in each SI cluster in (B) highlighting individual contributions of age and HMO to the gene’s expression profile. (D–F) same as above for large intestine samples (LI). GF mice weaned at 21 days of age (n=3 F); Groups (conditions): Control GF mice euthanized either at 28 days of age (n= 9; M=5, F=4) or 35 days of age (n= 5; M=3, F=2) or 50 days of age (n= 5; M=1, F=4) respectively; 7d HMOs euthanized at d28 = GF mice that received 100 ul of HMO through 7 consecutive days and euthanized at 28 days of age (n= 5; M=2, F=3); HMO_14d_D35 = GF mice that received 100 μl of HMO through 14 days and euthanized at 35 days of age (n= 6; M=3, F=3); HMO_7d_D50 = GF mice that received 100 μl of HMO through 7 consecutive days and euthanized at 50 days of age (n= 5; M=1, F=4); HMO_14d_D50 = GF mice that received 100 μl of HMO through 14 consecutive days and euthanized at 50 days of age (n= 10; M=7, F=3).
Figure 6
Figure 6
T cells (CD3+ CD4+ and CD3+ CD4- CD8+) composition in MLN and spleen following HMO administration. (A–C) T-cell composition in MLN. (D–F) T-cell composition in spleen. Cell populations are shown as the percentage of parent population ( Supplementary Figure 1A ). (G–I) Ratio of CD4+ T cells to CD8+ T cells in MLN. (J-L) Ratio of CD4+ T cells to CD8+ T cells in spleen. Ratio was calculated using absolute numbers of CD4+ and CD8+ cells. Each dot represents a mouse, and data are shown on mean ± SEM. Statistical analysis was performed using the Mann–Whitney test in GraphPad Prism Version 9.3.1 (www.graphpad.com). Statistical significance: *** p<0.001, **p<0.01, *p<0.05, ns, not significant. Groups: Control (GF_D28, GF_D35, and GF_D50) = germ-free mice (GF) euthanized either at 28 days of age (n= 5; M=2, F=3) or 35 days of age (n= 5; M=2, F=3) or 50 days of age (n= 16; M=8, F=8) respectively; HMO_7d_D28 (n= 7; M=3, F=4) = GF mice that received 100 μl of HMO through 7 consecutive days and euthanized at 28 days of age; HMO_14d_D35 (n= 7; M=3, F=4) = GF mice that received 100 μl of HMO through 14 days and euthanized at 35 days of age; HMO_7d_D50 (n= 11; M=6, F=5) = GF mice that received 100 μl of HMO through 7 consecutive days and euthanized at 50 days of age; HMO_14d_D50 (n= 6; M=5, F=1) = GF mice that received 100 μl of HMO through 14 consecutive days and euthanized at 50 days of age.
Figure 7
Figure 7
B cells (B220+) and plasma cells (B220- CD138+) in MLN and the spleen following HMO administration. (A–C) B cells and plasma cells in MLN. (D–F) B cells and plasma cells in the spleen. Data are shown as the percentage of the respective parent population ( Supplementary Figure 1B ). Each dot represents a mouse, and data are shown as mean ± SEM. Statistical analysis was performed using the Mann–Whitney test in GraphPad Prism Version 9.3.1 (www.graphpad.com). Statistical significance: *** p<0.001, **p<0.01, *p<0.05, ns, not significant. Groups: Control (GF_D28, GF_D35, and GF_D50) = GF mice euthanized either at 28 days of age (n= 5; M=2, F=3) or 35 days of age (n= 5; M=2, F=3) or 50 days of age (n= 16; M=8, F=8) respectively; HMO_7d_D28 (n= 7; M=3, F=4) = GF mice that received 100 μl of HMO through 7 consecutive days and euthanized at 28 days of age; HMO_14d_D35 (n= 7; M=3, F=4) = GF mice that received 100 μl of HMO through 14 days and euthanized at 35 days of age; HMO_7d_D50 (n= 11; M=6, F=5) = GF mice that received 100 μl of HMO through 7 consecutive days and euthanized at 50 days of age; HMO_14d_D50 (n= 6; M=5, F=1) = GF mice that received 100 μl of HMO through 14 consecutive days and euthanized at 50 days of age.
Figure 8
Figure 8
Neutrophils (PMNs) (B220- NK 1.1- CD11b+ Ly6G+), Monocytes/Macrophages (B220- NK 1.1- Ly6G- CD11b+) and dendritic cells (B220- NK 1.1- CD11c+ MHC-II+) in MLN and spleen following HMO administration. (A–C) Myeloid cell composition in MLN. (D–F) Myeloid cells composition in spleen. Data are shown as the percentage of respective parent population ( Supplementary Figure 1C ). Each dot represents a mouse and data are shown as mean ± SEM. Statistical analysis was performed using Mann–Whitney test in GraphPad Prism Version 9.3.1 (www.graphpad.com). Statistical significance: *** p<0.001, **p<0.01, *p<0.05, ns, not significant. Groups: Control (GF_D28, GF_D35, and GF_D50) = GF Mice euthanized either at 28 days of age (n= 5; M=2, F=3) or 35 days of age (n= 5; M=2, F=3) or 50 days of age (n= 16; M=8, F=8) respectively; HMO_7d_D28 (n= 7; M=3, F=4) = GF mice that received 100 ul of HMO through 7 consecutive days and euthanized at 28 days of age; HMO_14d_D35 (n= 7; M=3, F=4) = GF mice that received 100 ul of HMO through 14 days and euthanized at 35 days of age; HMO_7d_D50 (n= 11; M=6, F=5) = GF mice that received 100 ul of HMO through 7 consecutive days and euthanized at 50 days of age; HMO_14d_D50 (n= 6; M=5, F=1) = GF mice that received 100 ul of HMO through 14 consecutive days and euthanized at 50 days of age.
Figure 9
Figure 9
Serum IgA and IgG titers in immunized or HMO-supplemented groups. (A) CTB-specific serum IgA (B) CTB-specific IgG (C) TT-specific serum IgG (D) DT-specific IgG. GF control (n = 16, M = 8, F = 8), immunized (IMM) (n = 10, M = 6, F = 4), 14-day (14D) HMO (n = 3, F = 3) and 14D HMO + IMM (n = 9, M = 4, F = 5). Statistical significance between control and treatment groups were determined using one-way ANOVA with Bonferroni’s multiple comparison correction in GraphPad Prism Version 9.3.1 and adjusted p-value <0.05 was considered significant. Outliers were removed using ROUT (Q = 1%) in GraphPad Prism Version 9.3.1.* indicates significance P<0.05.
Figure 10
Figure 10
Immunization specific antibody-secreting cells (ASCs) from MLN and spleen, normalized per million cells. (A–C) CTB, TT and DT-specific ASCs from MLN. (D–F) CTB, TT and DT-specific ASCs from spleen. GF control (n = 16, M = 8, F = 8), immunized (IMM) (n = 10, M = 6, F = 4), 14D HMO (n = 3, F = 3) and 14D HMO + IMM (n = 9, M = 4, F = 5). Statistical significance between control and treatment groups were determined using one-way ANOVA with Bonferroni’s multiple comparisons correction in GraphPad Prism Version 9.3.1 and adjusted p-value <0.05 was considered significant. Outliers were removed using ROUT (Q = 1%) in GraphPad Prism Version 9.3.1. *P<0.05, **P<0.01.
Figure 11
Figure 11
The proliferation response elicited from MLN or spleen cells to CTB, TT, or DT. (A–C) CT-, TT-, and DT-specific proliferation in MLN, respectively. (D–F) CT-, TT-, and DT-specific proliferation in spleen, respectively. Statistical significance between control and treatment groups were determined using one-way ANOVA with Bonferroni’s multiple comparison correction in GraphPad Prism Version 9.3.1 and the adjusted p- value <0.05 was considered significant. Outliers were removed using ROUT (Q = 1%) in GraphPad Prism Version 9.3.1. This indicates statistical significance.* P < 0.05, *** P < 0.005, ****P < 0.0001.

Similar articles

Cited by

References

    1. Sobti J, Mathur GP, Gupta A. WHO's Proposed Global Strategy for Infant and Young Child Feeding: A Viewpoint. J Indian Med Assoc (2002) 100(8):502–4, 6. - PubMed
    1. Eidelman AI., Schanler RJ., Johnston M, Landers S, Noble L, Szucs K. Breastfeeding and the Use of Human Milk. Pediatrics (2012) 129(3):e827–41. doi: doi.org/10.1542/peds.2011-3552 - PubMed
    1. Carr LE, Virmani MD, Rosa F, Munblit D, Matazel KS, Elolimy AA, et al. . Role of Human Milk Bioactives on Infants' Gut and Immune Health. Front Immunol (2021) 12:604080. doi: 10.3389/fimmu.2021.604080 - DOI - PMC - PubMed
    1. Nishimura T, Suzue J, Kaji H. Breastfeeding Reduces the Severity of Respiratory Syncytial Virus Infection Among Young Infants: A Multi-Center Prospective Study. Pediatr Int (2009) 51(6):812–6. doi: 10.1111/j.1442-200X.2009.02877.x - DOI - PubMed
    1. Quitadamo PA, Comegna L, Cristalli P. Anti-Infective, Anti-Inflammatory, and Immunomodulatory Properties of Breast Milk Factors for the Protection of Infants in the Pandemic From COVID-19. Front Public Health (2020) 8:589736. doi: 10.3389/fpubh.2020.589736 - DOI - PMC - PubMed

Publication types

Substances