. 2022 Jun 30:13:935465.
doi: 10.3389/fimmu.2022.935465. eCollection 2022.

T Cell-Intrinsic Vitamin A Metabolism and Its Signaling Are Targets for Memory T Cell-Based Cancer Immunotherapy

Affiliations

T Cell-Intrinsic Vitamin A Metabolism and Its Signaling Are Targets for Memory T Cell-Based Cancer Immunotherapy

Fumihiro Fujiki et al. Front Immunol. .

Abstract

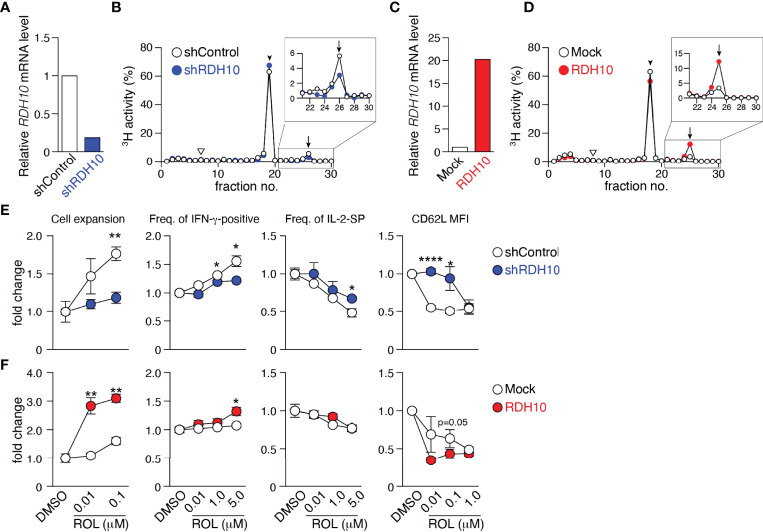
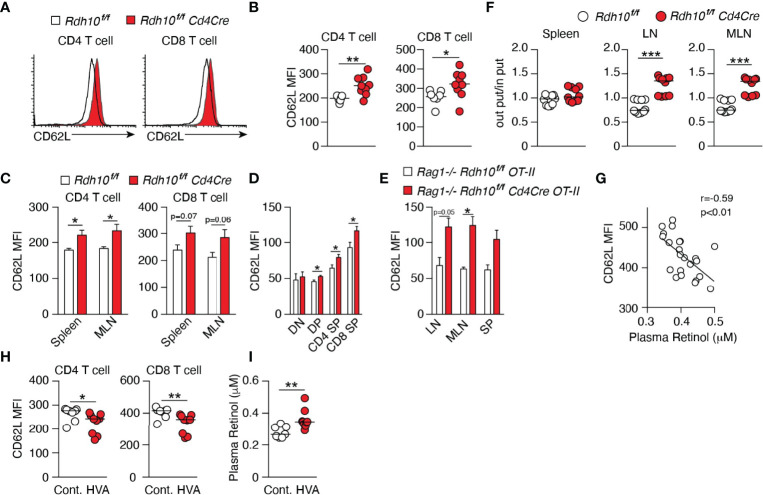
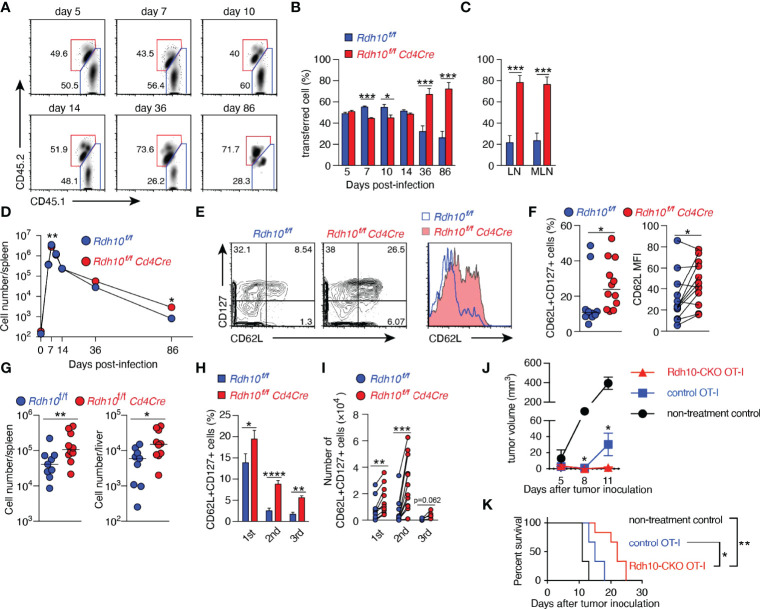
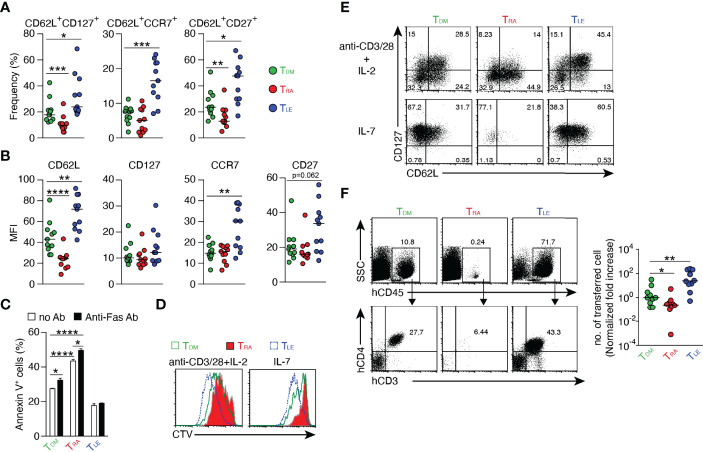
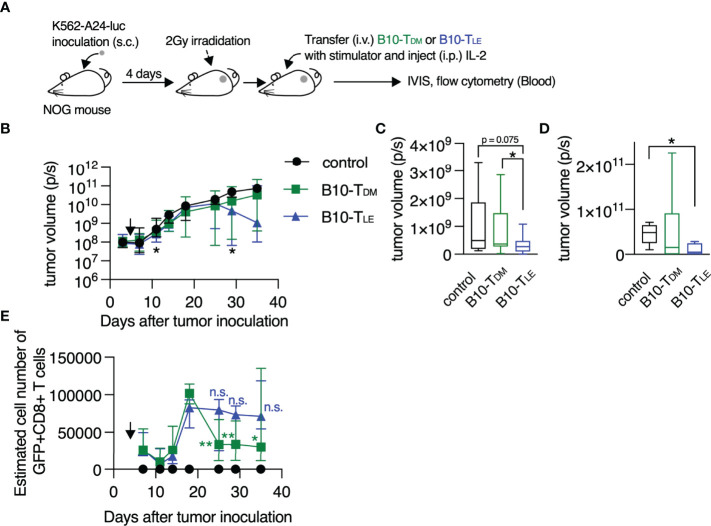
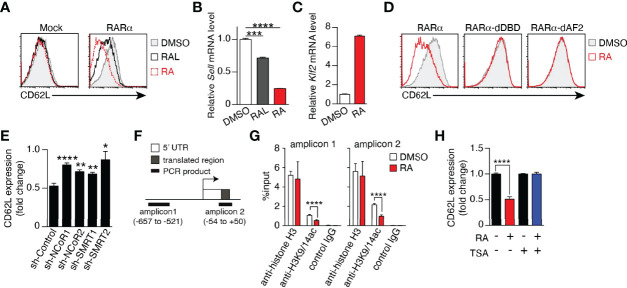
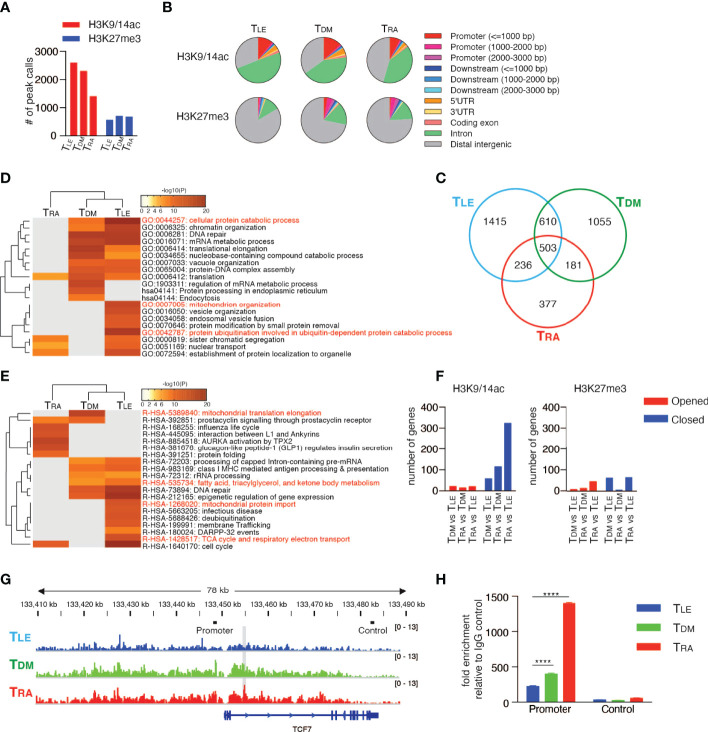
Memory T cells play an essential role in infectious and tumor immunity. Vitamin A metabolites such as retinoic acid are immune modulators, but the role of vitamin A metabolism in memory T-cell differentiation is unclear. In this study, we identified retinol dehydrogenase 10 (Rdh10), which metabolizes vitamin A to retinal (RAL), as a key molecule for regulating T cell differentiation. T cell-specific Rdh10 deficiency enhanced memory T-cell formation through blocking RAL production in infection model. Epigenetic profiling revealed that retinoic acid receptor (RAR) signaling activated by vitamin A metabolites induced comprehensive epigenetic repression of memory T cell-associated genes, including TCF7, thereby promoting effector T-cell differentiation. Importantly, memory T cells generated by Rdh deficiency and blocking RAR signaling elicited potent anti-tumor responses in adoptive T-cell transfer setting. Thus, T cell differentiation is regulated by vitamin A metabolism and its signaling, which should be novel targets for memory T cell-based cancer immunotherapy.

Keywords: RDH10; cancer immunotherapy; effector T cell; memory T cell; retinoic acid; vitamin A; vitamin A metabolism.


Conflict of interest statement

FF and HS applied for a patent titled ‘‘Method for modifying T cell population’’. The remaining authors declare that the research was conducted in the absence of any commercial or financial relationships that could be construed as a potential conflict of interest. The Department of Cancer Immunology collaborates with Otsuka Pharmaceutical Co., Ltd. The company had no role in the study design, data collection and analysis, decision to publish, or preparation of the manuscript.

Figures

Figure 1
Figure 1
RDH10 metabolizes vitamin A and regulates T cell differentiation. RDH10 in human CD4+ T cells was lentivirally knocked down (A, B, E) or overexpressed (C, D, F). (A, C) RDH10 mRNA expression level. (B, D) shRDH10- (B) or RDH10 (D)-transduced T cells were cultured in the presence of [3H]-all-trans ROL for 4 h. Then, cell extracts were fractionated by HPLC and the radioactivity of each fraction was measured. Arrowhead, arrow, and inverted triangle indicate the peak fraction of standard all-trans ROL, RAL, and RA, respectively. Representative results from two independent experiments are shown. (E, F) shRDH10- (E) or RDH10 (F) -transduced T cells were cultured in the presence of anti-CD3/28 mAbs, IL-2, and all-trans ROL (or DMSO) for 7 days, and then the cell number, cytokine-producing capacity in response to PMA/Ionomycin, and expression level of CD62L were measured. Data from three (cell number and cytokine-producing capacity) or five (CD62L expression) independent experiments were analyzed by unpaired t-tests. Error bars show s.e.m. *p < 0.05; **p < 0.01; ****p < 0.0001.
Figure 2
Figure 2
Vitamin A metabolism mediated by Rdh10 physiologically regulates CD62L expression in T cells. (A–C) CD62L expression in CD4+ and CD8+ T cells isolated from the lymph node (LN) (A, B), spleen, and mesenteric lymph node (MLN) (C) of 6- to 8-week-old mice. Data represent n = 7 littermate control and n = 9 Cd4Cre mice. (D) CD62L expression in CD4- CD8- double-negative (DN), CD4+ CD8+ double-positive (DP), CD4 single-positive (SP), and CD8 SP thymocytes of 5-week-old mice. Data represent n = 8 littermate control and n = 10 Cd4Cre mice. (E) CD62L expression in OT-II cells isolated from the LN, MLN, and spleen (SP) of 6- to 8-week-old mice. Data represent n = 2 littermate control and n = 4 Cd4Cre mice. (F) T cells purified from splenocytes of littermate control and Cd4Cre mice were labeled with either CFSE or CTV, mixed at a ratio of 1:1 and injected into B6 mice (8 × 10⁶ cells per mouse). Donor cells were analyzed in the spleen, LN, and MLN 16 h later. Each symbol indicates one host mouse (n = 10). Data from two independent experiments are shown. (G–I) B6 mice were fed a high vitamin A (HVA) or control diet for 1 week. Peripheral blood was collected pre- (G) and post-feeding (H, I), and CD62L expression levels in T cells and the plasma retinol concentration were measured. Data represent CD62L expression levels pre-feeding (n = 23) (G) and in control diet-fed (n = 8) and HVA diet-fed (n = 9) mice (H, I). Data were analyzed by unpaired t-tests (B–F, I), Pearson’s correlation coefficients (G), or Mann–Whitney tests (H). Error bars show s.e.m. *p < 0.05; **p < 0.01; ***p < 0.001.
Figure 3
Figure 3
Rdh10 deficiency enhances the generation of central memory T cells. (A–F) OT-I cells were isolated from Rdh10CKO (CD45.1+CD45.2+) and control (CD45.1+) mice, mixed at a ratio of 1:1, and then intravenously transferred into the B6 host (CD45.2+). On the next day, the mice were intravenously infected with LM-OVA. (A) Representative dot plots showing the frequency of transferred OT-I cells in the spleen on the indicated days post-infection (pi). (B, C) Frequencies of the indicated OT-I cells among total transferred OT-I cells from the spleen (B) and lymph nodes (C, 86 days pi). (D) Kinetics of OT-I cell number in the spleen. Symbols show median values. Data represent n = 5 (day 0), n = 8 (day 5, 7, 10, and 14), and n = 12 (day 36 and 86) mice from two independent experiments (B–D). (E, F) Frequency of CD62L+CD127+ TCM (left) and the level of CD62L expression (right) in OT-I cells from the spleen in the memory phase (>30 days pi). Representative dot plots and histogram (E). Data represent n = 10 (left) or n = 12 (right) control OT-I cells and n = 12 Rdh10CKO OT-I cells (F). (G) Memory OT-I cells were transferred into B6 mice, and OT-I cells were counted in the spleen and liver on day 5 after LM-OVA re-challenge (1 × 10⁶ CFU/mouse). (H, I) Serial transfer of primary (1st) memory OT-I cells and LM-OVA infection were performed. The resultant secondary (2nd) and tertiary (3rd) memory OT-I cells were obtained from the spleen and were measured for the frequency (H) and absolute number (I) of TCM. Data represent n = 12 (1st and 2nd) and n = 6 (3rd) mice from two independent experiments. (J, K) Rdh10CKO or control memory OT-I cells were intravenously transferred immediately after subcutaneous inoculation of EG-7 tumor cells into 3 Gy-irradiated B6 mice. Tumor volumes (J) and survival rates (K) were evaluated. Data represent n = 3 (non-treatment control and control OT-I) and n = 6 (Rdh10CKO OT-I). Data were analyzed by unpaired t-tests (B, C, H, J), Mann–Whitney test (D, F-left and G), Wilcoxon test (F-right and I), or Log-rank test (K). Error bars show s.e.m. *p < 0.05; **p < 0.01; ***p < 0.001; ****p < 0.0001.
Figure 4
Figure 4
Regulation of T cell differentiation by RAR signaling. Human CD4+ CD45RO+ T cells were stimulated with anti-CD3/CD28 mAbs in the presence of DMSO, RA (1 μM), or LE540 (10 μM). Seven days later, the T cells were rested in IL-2-free medium overnight and then used for subsequent experiments. (A, B) Surface phenotypes of TDM, TRA, and TLE cells. Each symbol indicates the results (n = 11) obtained from six independent experiments. (C) Frequency of apoptotic cells for TDM, TRA, and TLE cells after 4 h of incubation with or without anti-Fas Ab (n = 3). (D, E) TDM, TRA, and TLE cells were labeled with CTV and stimulated with the indicated agents. (D) Analysis of cell proliferation using CTV dilution after 4 days of stimulation. (E) The T cells were harvested after 5 days of the stimulation, rested in a cytokine-free medium overnight, and analyzed for their surface phenotypes. Representative data from three independent experiments are shown (C-E). (F) TDM, TRA, and TLE cells were co-transferred with CD3+ T cell-depleted autologous PBMCs into NOG mice. Four weeks later, a flow cytometric analysis was performed to evaluate transferred cells in the spleen. Representative dot plots (Left) and normalized fold increases in the cell number (Right) are shown. The normalized fold increase was calculated by dividing each value by a median value of the corresponding control (i.e., TDM) group. Data from three independent experiments are shown. Each symbol indicates results from a single mouse (n = 10). Data were analyzed by Mann–Whitney tests (A, F) or unpaired t-tests (C). Error bars show s.e.m. *p < 0.05; **p < 0.01; ***p < 0.001; ****p<0.0001.
Figure 5
Figure 5
RAR signal blockade confers a strong anti-tumor activity on human T cells. (A) Experimental schematic. B10-TDM or B10-TLE cells were intravenously co-transferred with WT1 peptide-pulsed autologous CD3+ cell-depleted PBMCs into K562-A24-luc tumor-bearing NOG mice. Control mice were treated in the same procedure without T-cell transfer. (B) Kinetics of tumor growth. Significant differences were observed in the three groups on days 11 and 29 after tumor inoculation, as marked with asterisk (*). Symbols show median with interquartile range. (C) Tumor volume on day 11 after tumor inoculation (control, n = 11; B10-TDM and B10-TLE, n = 17). (D) Tumor volume on day 29 after tumor inoculation (control and B10-TLE, n = 5; B10-TDM, n = 6). (E) Kinetics of persistence of GFP+ CD8+ T cells. GFP+ CD8+ T cells in B10-TDM significantly decreased from a peak (day 18), whereas those in B10-TLE persisted. Symbols show median (with interquartile range) of estimated number of cells (each group, n = 6). The estimated number of cells were calculated from frequencies of GFP+ CD8+ cells in blood. Data from six (B, C) or two (D, E) independent experiments were analyzed by Mann-Whitney test (C, D) or paired t-test (E; day 18 vs. day 25, 29, and 35). *p < 0.05; **p < 0.01. n.s., not significant.
Figure 6
Figure 6
RAR signaling-induced CD62L repression is mediated by epigenetic modifications. (A–D) Jurkat cells transduced with the empty vector (Mock), full-length (RARα), DBD-deficient (RARα-dDBD), or AF2-deficient RARα (RARα-dAF2) were cultured for 3–4 days in the presence of RAL (1 μM), RA (1 μM), or DMSO and the expression levels of CD62L protein (A, D), CD62L mRNA (B), and KLF2 mRNA (C) were measured. (A, D) Representative histograms are shown. (B, C) Representative CD62L and KLF2 mRNA levels in RARα-overexpressing Jurkat cells after the indicated treatments. Representative data from two independent experiments are shown (A-D). (E) RARα-overexpressing Jurkat cells transduced with the indicated shRNAs were cultured for 4 days in the presence of RA (1 μM) or DMSO, and CD62L protein levels were measured. Data show the fold change of CD62L expression (MFIs of CD62L in RA-treated cells/those in DMSO-treated cells) in three independent experiments. (F) CD62L locus and positions of amplicons for the ChIP assay. (G) ChIP assay results from RARα-overexpressed Jurkat cells treated with DMSO or RA for 4 days. Data were obtained from two (DMSO) or three (RA) independent experiments. (H) CD62L expression (fold change) on RARα-overexpressing Jurkat cells cultured under the indicated conditions (RA, 1 μM; TSA, 50 nM) for 4 days. Data were obtained from three independent experiments. Data were analyzed by unpaired t-tests. Error bars show s.e.m. *p < 0.05; **p < 0.01; ***p < 0.001; ****p < 0.0001.
Figure 7
Figure 7
RAR signaling deletes memory T cell profile through comprehensive histone modifications. ChIP-seq using the Illumina HiSeq2500 system was performed with TDM, TRA, and TLE cells for both H3K9/14ac and H3K27me3. (A) The number of peak calls. (B) Pie charts show the proportion of H3K9/14ac- and H3K27me3-occupied genomic regions. (C) Venn diagram shows the number of genes located within ±10 kb of H3K9/14ac-occupied regions. Genes were filtered as follows: p < 1e-5, Fold Enrichment ≥ 5, and Peak Tag count ≥ 5. (D, E) Metascape analysis was performed on the uniquely H3K9/14ac-occupied genes (i.e., 1415 genes in TLE, 1055 genes in TDM, and 377 genes in TRA, as described in (C). Pathway and Process Enrichment analyses were performed using default settings without Reactome Gene Sets (D) and using only Reactome Gene Sets (E). (F) Genes located within ±10 kb of H3K9/14ac- and H3K27me3-occupied regions were extracted for the indicated comparison and categorized as closed and opened genes, respectively, during differentiation. The number of closed and opened genes is shown. (G) The patterns of H3K27me3 peaks at the TCF7 locus are shown. The gray shadow indicates the region that was detected as a peak call in the comparison between TLE and TRA cells. Bars indicated as Promoter or Control are positions of amplicons for ChIP-qPCR (H). (H) A ChIP assay was performed for H3K27me3-occupied genes in the naïve CD8+ T cells treated with DMSO, RA, or LE540. Representative data are shown from two independent experiments. Data were analyzed by one-way ANOVA with post-hoc tests. Error bars show SD. ****p < 0.0001.

References

    1. Pearce EL, Walsh MC, Cejas PJ, Harms GM, Shen H, Wang LS, et al. . Enhancing CD8 T-Cell Memory by Modulating Fatty Acid Metabolism. Nature (2009) 460:103–7. doi: 10.1038/nature08097 - DOI - PMC - PubMed
    1. Chang CH, Curtis JD, Maggi LB, Jr, Faubert B, Villarino AV, O'Sullivan D, et al. . Posttranscriptional Control of T Cell Effector Function by Aerobic Glycolysis. Cell (2013) 153:1239–51. doi: 10.1016/j.cell.2013.05.016 - DOI - PMC - PubMed
    1. Cham CM, Gajewski TF. Glucose Availability Regulates IFN-Gamma Production and P70s6 Kinase Activation in CD8+ Effector T Cells. J Immunol (2005) 174:4670–7. doi: 10.4049/jimmunol.174.8.4670 - DOI - PubMed
    1. Chang CH, Pearce EL. Emerging Concepts of T Cell Metabolism as a Target of Immunotherapy. Nat Immunol (2016) 17:364–8. doi: 10.1038/ni.3415 - DOI - PMC - PubMed
    1. Chambon P. A Decade of Molecular Biology of Retinoic Acid Receptors. FASEB J (1996) 10:940–54. doi: 10.1096/fasebj.10.9.8801176 - DOI - PubMed

Publication types