. 2022 Jul 12;6(7):e421.
doi: 10.1002/pld3.421. eCollection 2022 Jul.

Enhanced seedling growth by 3- n-pentadecylphenolethanolamide is mediated by fatty acid amide hydrolases in upland cotton (Gossypium hirsutum L.)

Affiliations

Enhanced seedling growth by 3- n-pentadecylphenolethanolamide is mediated by fatty acid amide hydrolases in upland cotton (Gossypium hirsutum L.)

Omar Arias-Gaguancela et al. Plant Direct. .

Abstract

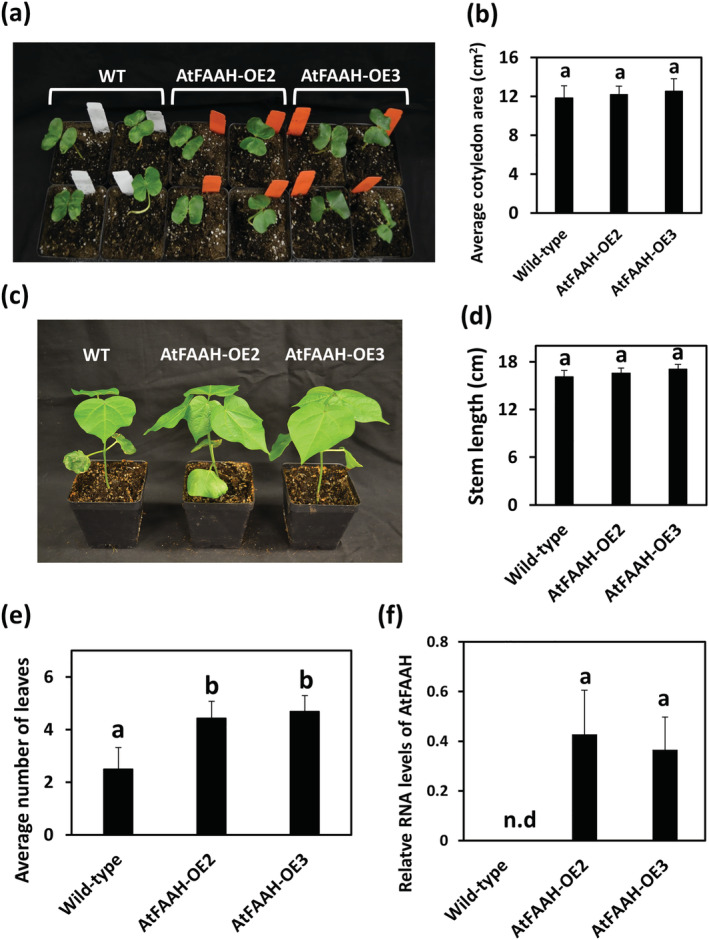
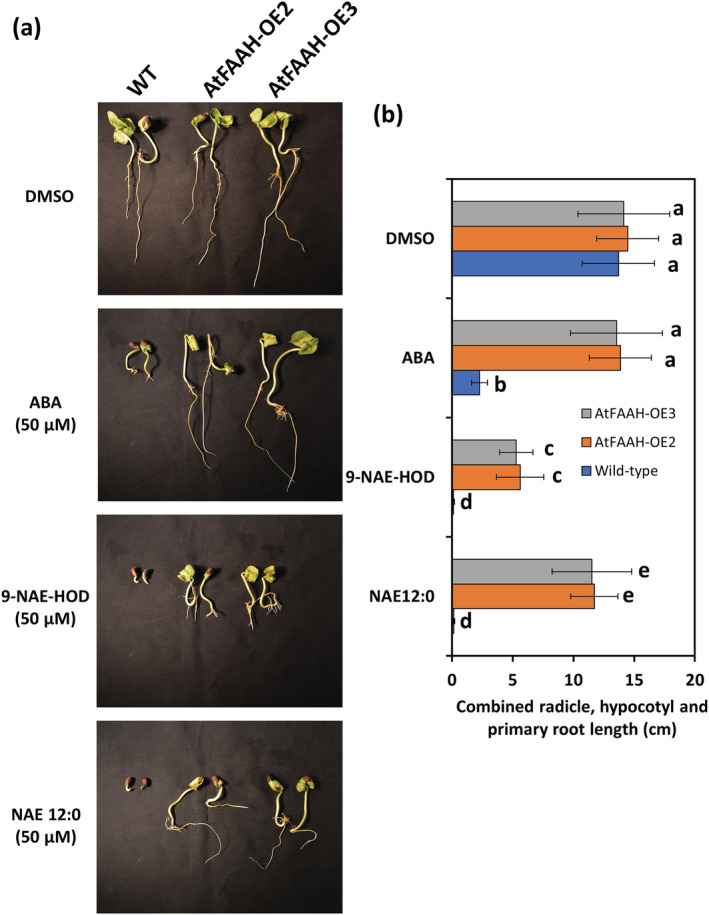
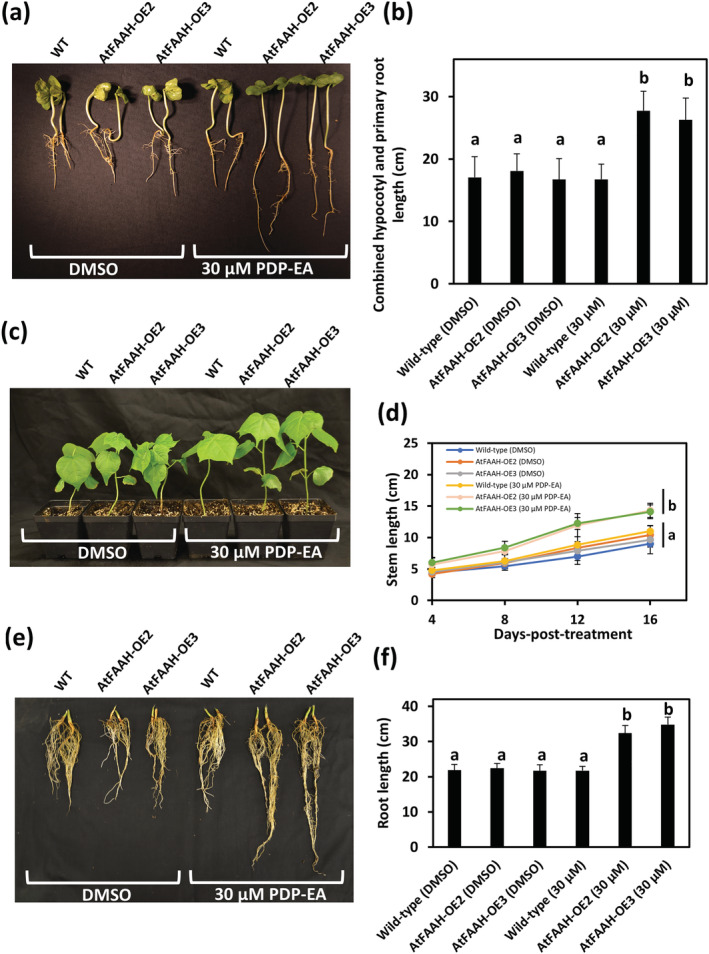
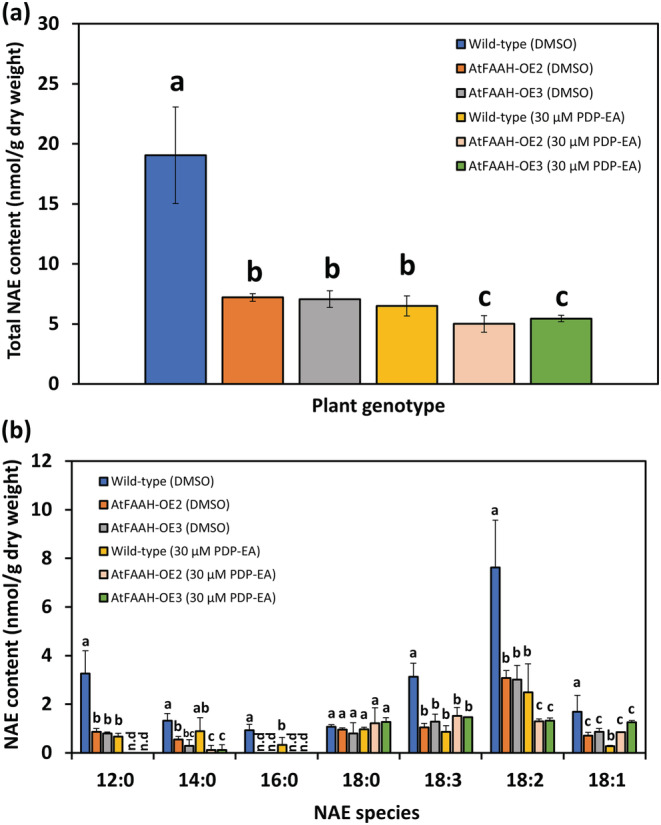
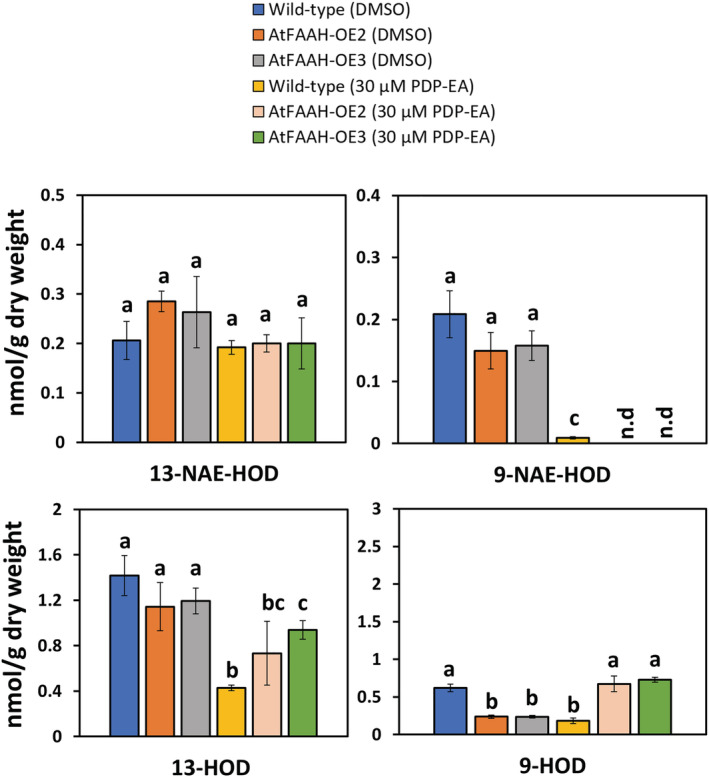
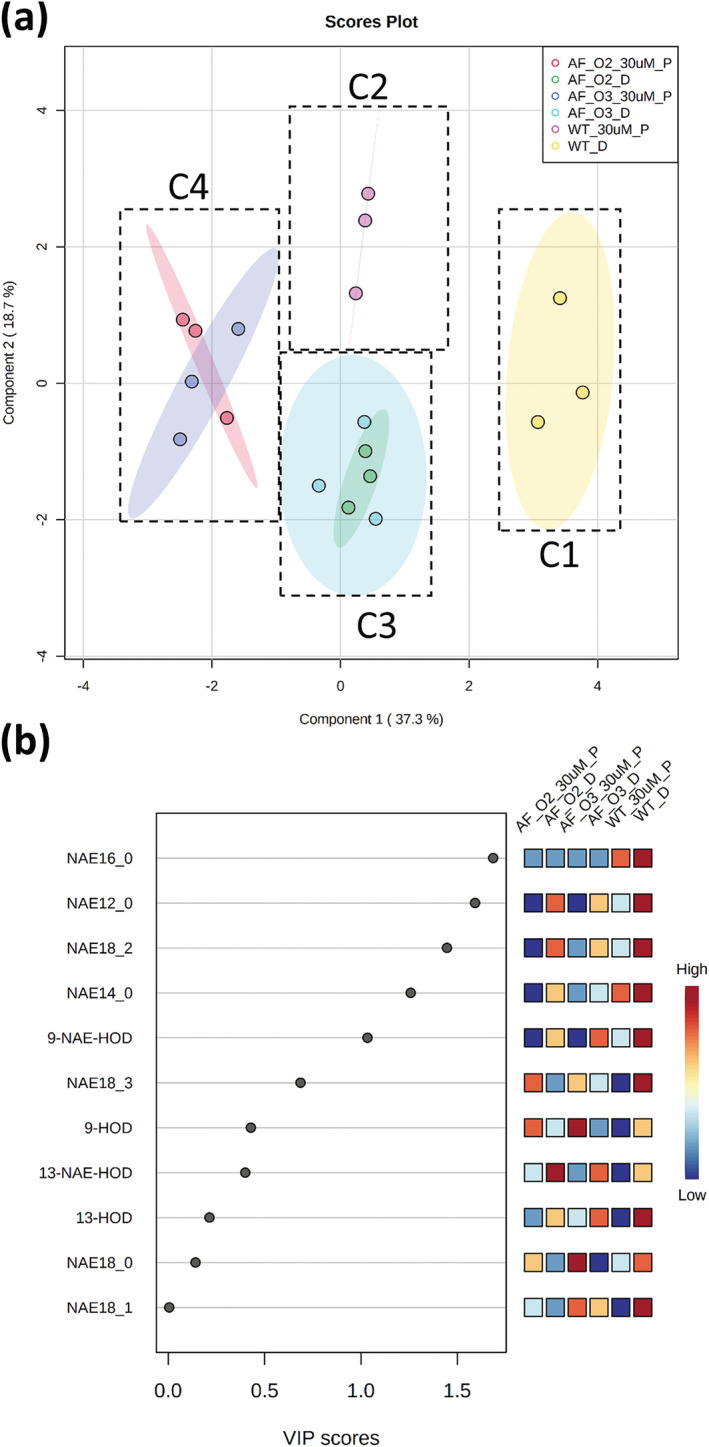
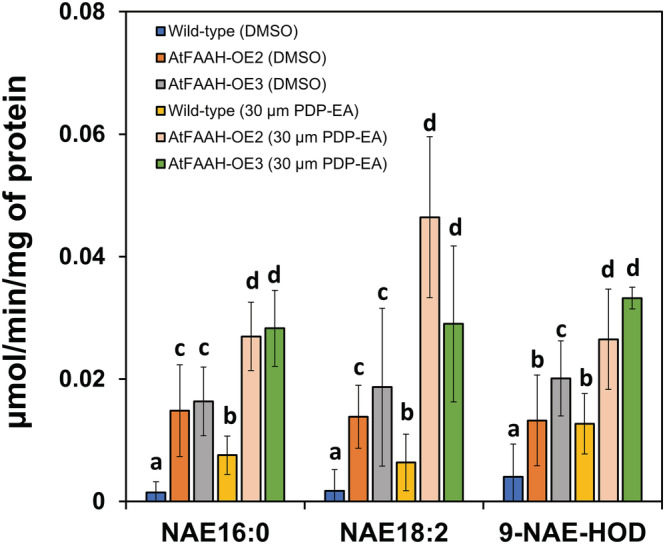
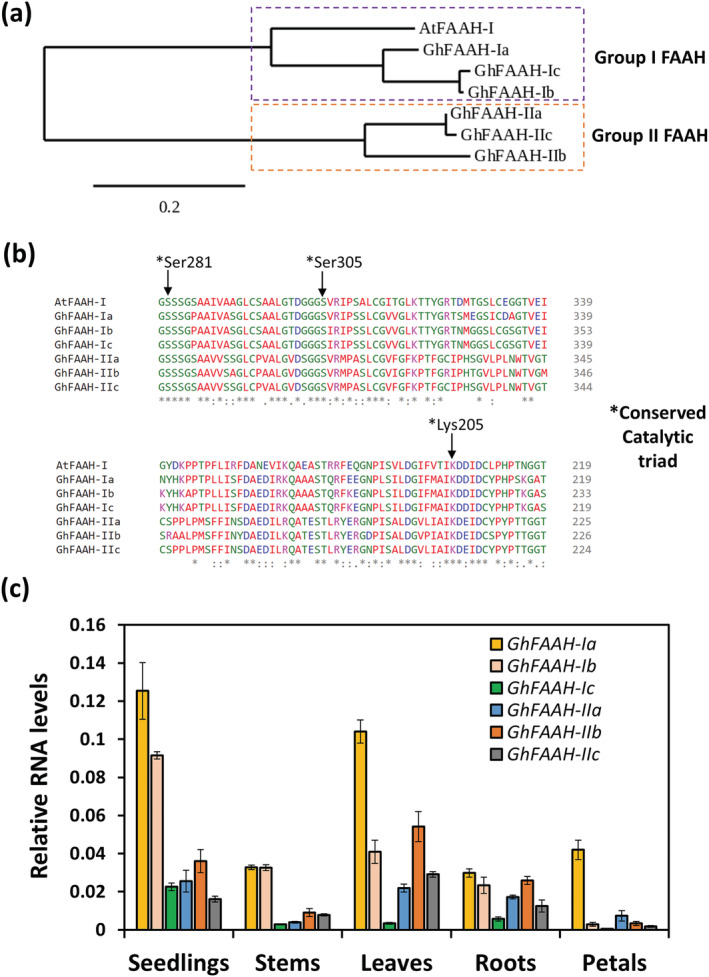
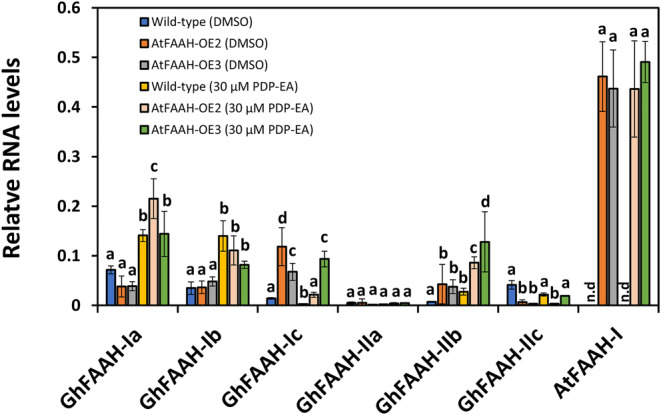
Fatty acid amide hydrolase (FAAH) is a conserved amidase that is known to modulate the levels of endogenous N-acylethanolamines (NAEs) in both plants and animals. The activity of FAAH is enhanced in vitro by synthetic phenoxyacylethanolamides resulting in greater hydrolysis of NAEs. Previously, 3-n-pentadecylphenolethanolamide (PDP-EA) was shown to exert positive effects on the development of Arabidopsis seedlings by enhancing Arabidopsis FAAH (AtFAAH) activity. However, there is little information regarding FAAH activity and the impact of PDP-EA in the development of seedlings of other plant species. Here, we examined the effects of PDP-EA on growth of upland cotton (Gossypium hirsutum L. cv Coker 312) seedlings including two lines of transgenic seedlings overexpressing AtFAAH. Independent transgenic events showed accelerated true-leaf emergence compared with non-transgenic controls. Exogenous applications of PDP-EA led to increases in overall seedling growth in AtFAAH transgenic lines. These enhanced-growth phenotypes coincided with elevated FAAH activities toward NAEs and NAE oxylipins. Conversely, the endogenous contents of NAEs and NAE-oxylipin species, especially linoleoylethanolamide and 9-hydroxy linoleoylethanolamide, were lower in PDP-EA treated seedlings than in controls. Further, transcripts for endogenous cotton FAAH genes were increased following PDP-EA exposure. Collectively, our data corroborate that the enhancement of FAAH enzyme activity by PDP-EA stimulates NAE-hydrolysis and that this results in enhanced growth in seedlings of a perennial crop species, extending the role of NAE metabolism in seedling development beyond the model annual plant species, Arabidopsis thaliana.

Keywords: 3‐n‐pentadecylphenolethanolamide; N‐acylethanolamines; cotton; fatty acid amide hydrolase; oxylipins; seedling growth.


Conflict of interest statement

The authors declare no conflict of interest.

Figures

FIGURE 1
FIGURE 1
Phenotype evaluation of non‐transgenic, wild‐type (WT) cotton ( Gossypium hirsutum L. cv Coker 312) and Arabidopsis fatty acid amide hydrolase (AtFAAH) overexpressing cotton seedlings. Two transgenic events were used for side‐by‐side comparisons, namely, AtFAAH‐OE2 and AtFAAH‐OE3. (a) Representative images of 10‐day old wild‐type (non‐transgenic) and AtFAAH lines. (b) Cotyledon surface area (cm2) of WT and AtFAAH lines (n = 9). Image J software was used to measure the cotyledon area from each plant. (c) Representative images of 32‐day‐old cotton seedlings. (d) Stem length and (e) average number of leaves measured for WT and AtFAAH lines. Bars represent the means and standard deviation (±SD) from thirteen plants per group studied. One‐way ANOVA with Tukey post hoc test were used for statistical analyses of the data sets. Different letters indicate significant differences (P < 0.05). (f) Reverse transcriptase‐quantitative PCR (RT‐qPCR) data showing expression of AtFAAH in transgenic lines AtFAAH‐OE2 and AtFAAH‐OE3. Ubiquitin1 (UBQ1) was used as the housekeeping gene for normalization. Bars represent the means and standard deviation (±SD) from four plants per genotype studied. One‐way ANOVA with Tukey post hoc test was used for statistical analyses. Abbreviation “n.d” represents no detectable levels of the transcript
FIGURE 2
FIGURE 2
Evaluation of non‐transgenic (WT) and AtFAAH‐OE cotton lines pretreated with ABA, 9‐NAE‐HOD or NAE12:0. (a) Representative images of 8‐day‐old wild‐type (non‐transgenic) and AtFAAH lines exposed to ABA or NAEs. (b) Combined length of radicle, hypocotyl, and primary root for cotton seedlings exposed to ABA or NAEs. One‐way ANOVA with Tukey post hoc test were used for statistical analyses of the data sets (n = 9). Different letters indicate significant differences (P < 0.05)
FIGURE 3
FIGURE 3
Exogenous application of 3‐n‐pentadecylphenolethanolamide (PDP‐EA) in cotton seedlings. (a) Representative images of 10‐day‐old non‐transgenic wild‐type (WT) and AtFAAH transgenics pretreated with 0.05% DMSO (solvent control) or 30 μM PDP‐EA. (b) Combined length of hypocotyl and primary root length in the same treatments and genotypes. Bars represent the means and standard deviation (±SD) from 18 plants per group studied. (c) Representative images of non‐transgenic wild‐type (WT) and AtFAAH transgenics fed with 0.05% DMSO (solvent control) or 30 μM PDP‐EA at 16‐days of exposure. (d) Stem length was evaluated in seedlings irrigated with DMSO or PDP‐EA at 4, 8, 12, and 16 days after exposure with DMSO or PDP‐EA. Bars represent the means and standard deviation (±SD) from nine plants per group studied. (e) Representative images of roots collected from wild‐type (WT) and AtFAAH transgenics irrigated with DMSO or PDP‐EA at 16‐days of exposure. (f) The length of the root was measured for DMSO‐ or PDP‐EA‐treated cotton seedlings (WT or AtFAAH‐OE). Bars represent the means and standard deviation (±SD) from 18 plants per group studied. One‐way ANOVA with Tukey post hoc test were used for statistical analyses of all data sets. Different letters represent significant differences (P < 0.05) within the group analyzed
FIGURE 4
FIGURE 4
Comparison of endogenous N‐acylethanolamines (NAE) profiles in non‐transgenic wild‐type (WT) and AtFAAH cotton transgenics irrigated with 0.05% DMSO (control) and 30 μM (PDP‐EA). NAE content was quantified for (a) the total and (b) individual NAE species. Bars represent the means and standard deviation (±SD) from three biological samples. One‐way ANOVA with Tukey post hoc test was used for statistical analyses of the NAE profiles. Different letters indicate statistical differences (P < 0.05). Abbreviation “n.d” represents no detectable levels of the metabolite
FIGURE 5
FIGURE 5
Comparison of endogenous N‐acylethanolamines (NAE) oxylipins and free fatty acid (FFA) oxylipin profiles in non‐transgenic wild‐type (WT) and AtFAAH cotton transgenics fed with 0.05% DMSO (control) and 30 μM PDP‐EA. Tissues were collected at 16‐day‐post treatment and subjected to oxylipin extraction. Bars represent the means and standard deviation (±SD) from three biological samples. One‐way ANOVA with Tukey post hoc test was used for statistical analyses of the oxylipin profiles. Different letters indicate statistical differences (P < 0.05). Abbreviation “n.d” represents no detectable levels of the metabolite
FIGURE 6
FIGURE 6
Partial Least Squares Discriminant Analysis (PLS‐DA) and variable importance in projection (VIP) scores for the combined NAE‐oxylipins, FFA‐oxylipins, and NAE data sets. (a) Shaded colored clusters in PLS‐DA graph represent 95% confidence intervals, rectangles with dashed lines were drawn to enclose and name the data set clusters, namely, clusters 1 to 4 (C1 to C4). (b) VIP scores plot depict relative abundance and ranks each metabolite (from top to bottom) in terms of its importance in the data spatial distribution. Red represents the high values, whereas blue represents the low values. Abbreviations: WT_D, wild‐type fed with 0.05% DMSO; WT_30uM_P, wild‐type fed with 30 μM PDP‐EA; AF_O2_D, AtFAAH cotton line 2 fed with 0.05% DMSO; AF_O3_D, AtFAAH cotton line 3 fed with 0.05% DMSO; AF_O2_30uM_P, AtFAAH cotton line 2 fed with 30 μM PDP‐EA; AF_O3_30uM_P, AtFAAH cotton line 3 fed with 30 μM PDP‐EA
FIGURE 7
FIGURE 7
FAAH activity assay. Homogenates from non‐transgenic wild type (WT), and transgenics AtFAAH‐OE2, and AtFAAH‐OE3 were incubated with 100 μM of NAE16:0, NAE18:2, or 9‐NAE‐HOD substrates in the presence of 30 μM PDP‐EA or 100% DMSO (solvent control) at 30°C for 10 min. Reaction was stopped with phenylmethylsulfonyl fluoride (PSMF), and then, an aliquot of the reaction was taken and mixed with fluorescamine and water for detection of ethanolamine products. Bars represent the means and standard deviation (±SD) from four biological samples. One‐way ANOVA with Tukey post hoc test was used for statistical analyses of the activity assays. Different letters indicate statistical differences (P < 0.05)
FIGURE 8
FIGURE 8
(a) Phylogenetic analysis of amino acid sequences of cotton ( Gossypium hirsutum L.) and A. thaliana fatty acid amide hydrolases, namely, GhFAAH and AtFAAH. The phylogenetic tree was generated using Phylogeny.fr online server. Default settings included MUSCLE alignment and mid‐point rotting method for tree construction. Two major clusters were identified and named Group I FAAH and Group II FAAH. Group I FAAH comprises GhFAAH‐Ia, GhFAAH‐Ib, GhFAAH‐Ic, and AtFAAH‐I, whereas Group II FAAH includes GhFAAH‐IIa, GhFAAH‐IIb, GhFAAH‐IIc. (b) Sequence alignment of Groups I and II FAAHs. Arrows indicate conserved catalytic triad residues. Alignment was generated using Clustal Omega with default settings. (c) Reverse transcriptase‐quantitative PCR (RT‐qPCR) data show relative RNA levels of cotton FAAHs in seedlings, stems, leaves, roots, and petals. Values were determined with the deltaCT method using UBQ1 as housekeeping gene. Data shown in the bar graphs depict the mean of three biological replicates. Error bars represent the standard deviation (±SD) in the data set
FIGURE 9
FIGURE 9
Reverse transcriptase‐quantitative PCR (RT‐qPCR) analysis of endogenous and transgenic fatty acid amide hydrolase (FAAH) transcripts in non‐transgenic wild‐type (WT) and AtFAAH cotton transgenics at 16‐days‐post treatment with 0.05% DMSO (control) or 30 μM PDP‐EA. Relative RNA values were calculated with the deltaCT method, using Ubiquitin1 (UBQ1) as the housekeeping gene. Bars represent the means and standard deviation (±SD) from three biological replicates. One‐way ANOVA with Tukey post hoc test was used for statistical analyses of the data sets. Different letters represent significant differences (P < 0.05) within the group analyzed. Abbreviation “n.d” represents no detectable levels of the transcript

Similar articles

Cited by

References

    1. Amack, S. C. , & Antunes, M. S. (2020). CaMV35S promoter—A plant biology and biotechnology workhorse in the era of synthetic biology. Current Plant Biology, 24, 100179.
    1. Aziz, M. , & Chapman, K. D. (2020). Fatty acid amide hydrolases: An expanded capacity for chemical communication? Trends in Plant Science, 25(3), 236–249. - PubMed
    1. Aziz, M. , Wang, X. , Tripathi, A. , Bankaitis, V. A. , & Chapman, K. D. (2019). Structural analysis of a plant fatty acid amide hydrolase provides insights into the evolutionary diversity of bioactive acylethanolamides. The Journal of Biological Chemistry, 294(18), 7419–7432. - PMC - PubMed
    1. Bailey, T. L. , Williams, N. , Misleh, C. , & Li, W. W. (2006). MEME: Discovering and analyzing DNA and protein sequence motifs. Nucleic Acids Research, 34(suppl_2), W369–W373. - PMC - PubMed
    1. Blancaflor, E. B. , Kilaru, A. , Keereetaweep, J. , Khan, B. R. , Faure, L. , & Chapman, K. D. (2014). N‐Acylethanolamines: Lipid metabolites with functions in plant growth and development. The Plant Journal, 79(4), 568–583. - PubMed

LinkOut - more resources