. 2022 Jun 13;18(10):3993-4005.
doi: 10.7150/ijbs.72552. eCollection 2022.

Spatiotemporal quantification of metastatic tumour cell growth and distribution in lymph nodes by whole-mount tissue 3D imaging

Affiliations

Spatiotemporal quantification of metastatic tumour cell growth and distribution in lymph nodes by whole-mount tissue 3D imaging

Jun Li et al. Int J Biol Sci. .

Abstract

Lymph nodes (LNs) are a common site of metastasis in many solid cancers. Tumour cells can migrate to LNs for further metastatic colonization of distant organs, indicating poor prognosis and requiring different clinical interventions. The histopathological diagnostic methods currently used to detect clinical lymph node metastasis (LNM) have limitations, such as incomplete visualization. To obtain a complete picture of metastatic LNs on the spatial and temporal scales, we used ultimate 3D imaging of solvent-cleared organs (uDISCO) and 3D rapid immunostaining. MC38 cells labelled with EGFP were injected into the left footpads of C57BL/6 mice. Draining lymph nodes (DLNs) harvested from these mice were cleared using the uDISCO method. Metastatic colorectal cancer (CRC) cells in various regions of DLNs from mice at different time points were quantified using 3D imaging of whole-mount tissue. Several stages of tumour cell growth and distribution in LNs were identified: 1) invasion of lymphatic vessels (LVs) and blood vessels (BVs); 2) dispersion outside LVs and BVs for proliferation and expansion; and 3) re-entry into BVs and efferent lymphatic vessels (ELVs) for further distant metastasis. Moreover, these data demonstrated that mouse fibroblast cells (MFCs) could not only promote LNM of tumour cells but also metastasize to LNs together with tumour cells, thus providing a "soil" for tumour cell colonization. In conclusion, 3D imaging of whole-mount tissue and spatiotemporal analysis of LNM may collectively constitute an auxiliary method to improve the accuracy of clinical LNM detection.


Conflict of interest statement

Competing Interests: The authors have declared that no competing interest exists.

Figures

Figure 1
Figure 1
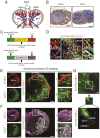
The whole-mount tissue 3D imaging of DLNs and quantification of tumour cells. A. The schedule of mouse footpad model construction and the time points of LN tissue collection. B. The uDISCO protocols of DLN. C. Photos of LN tissues before and after uDISCO clearing. The quantification of the diminution of LN size was shown right. Scale bars: 9.2 mm. D. The EGFP positive areas were further observed by a high resolution image in which cell nuclei were counterstained with TO-PRO-3. Scale bars: 20 µm. E. 3D images and cross-section photos of DLNs at the time points of 5d, 10d, 20d, and 30d, respectively. Scale bars: 200 µm. F. The invaded EGFP-tagged MC38 cells-associated voxel-number in DLNs at the time points of 5d, 10d, 20d, and 30d, quantified by Imaris. At least 6 samples were applied in each group. **P < 0.01; NS: no significant decrease.
Figure 2
Figure 2
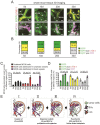
The immunofluorescent detection of ELVs, BVs, and EGFP-tagged MC38 cells. A. Distribution of ALVs, ELVs and BVs, including HEVs and arteries in LN. B. IHC staining photos of LVs and BVs in LNs. Scale bars: 200 µm. C. The immunofluorescent detection of LYVE-1 (LVs) and CD31 (BVs). Colocalization of LYVE1 and EGFP signals indicated MC38 cells distributed in ELVs (e-MC38), colocalization of CD31 and EGFP signals indicated MC38 cells distributed in BVs (b-MC38), and EGFP signal alone indicated MC38 cells scattered outside lymphatic/blood vessels (s-MC38). D. Images of EGFP-tagged MC38 cells, LYVE-1 and CD31 in a LN at 5d. LYVE-1: red; CD31: purple; *: MC38 cells scattered outside lymphatic/blood vessels. Scale bars: 100 µm. E and F. Cross-section photos of EGFP-tagged MC38 cells, LYVE-1 (E) and CD31 (F) in a LN at 5d. Scale bars: 100 µm. G. Cross-section photos of MC38 cells distributed in ELVs scattered outside lymphatic/blood vessels. Scale bars: 40 µm.
Figure 3
Figure 3
The spatiotemporal quantification of metastatic CRC cells in DLNs. A and B. Cross-section photos of EGFP-tagged MC38 cells in the different regions of LNs at 5d, 10d, 20d, and 30d, respectively (A). The percentage of MC38 cells distributed in ELVs or BVs / total MC38 cells were shown below (B). LYVE-1: red; CD31: purple; *: MC38 cells scattered outside lymphatic/blood vessels. Scale bars: 40 µm. C. The voxel-number associated with MC38 cells distributed in ELVs or BVs and the voxel-number associated with MC38 cells scattered outside lymphatic/blood vessels at 5d, 10d, 20d, and 30d, respectively. One-way ANOVA was used for comparison between groups. At least 6 samples were applied in each group. D. The ratio of MC38 cells distributed in ELVs or BVs / total MC38 cells and the ratio of MC38 cells scattered outside lymphatic/blood vessels / total MC38 cells at 5d, 10d, 20d, and 30d, respectively. One-way ANOVA was used for comparison between groups. At least 6 samples were applied in each group. E. The metastatic tumour cells were found mainly invaded in ELVs and BVs in the early stages of LNM, then most of them moved and scattered outside lymphatic/blood vessels in LNs for proliferation and expansion, and at last reaggregated in BVs and ELVs to support metastasis. *P < 0.05; **P < 0.01; NS: no significant difference.
Figure 4
Figure 4
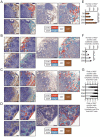
The proliferation of metastatic CRC cells in DLNs. A-D. IHC staining photos of Ki67, CD31 and LYVE-1 in DLNs at 5d (A), 10d (B), 20d (C) and 30d (D). Scale bars: 100 µm. E and F. The statistical results of total Ki67 (E) and scattered Ki67 (F) (the tumour cells distributed outside lymphatic/blood vessels) positive cells at 5d, 10d, 20d, and 30d, respectively. All experiments were repeated at least 3 times. G. The ratio of Ki67 positive cells (scattered outside lymphatic/blood vessels) / total Ki67 cells and Ki67 positive cells (distributed in lymphatic/blood vessels) / total Ki67 cells at 5d, 10d, 20d, and 30d, respectively. *P < 0.05; **P < 0.01; NS: no significant difference.
Figure 5
Figure 5
The co-metastasis of CRC cells and MFCs in DLNs. A. The schedule of mouse footpad injection. The mice were injected with co-cultured or mixed MC38 cells tagged with EGFP and MFCs tagged with mCherry. MC38 cells alone was set as the vehicle group. B and C. Photos of DLNs obtained from mice at 5d and 10d (B). The statistical results were shown below (C). D and E. 3D images of EGFP-tagged MC38 cells and mCherry-tagged MFCs in cleared DLNs at 5d (D) and 10d (E). Scale bars: 60 µm. A randomly selected 3D image (500 µm - X axis × 500 µm - Y axis × 100 µm - Z axis) was taken out and shown here. The number of MC38 cells or MFCs were quantified according to the 3D images. Thresholds in these images were set as: the surface modules with the size > 10 µm were considered to be MC38 cells (D) and surface modules with the size > 15 µm were considered to be MFCs (E). F and G. The statistical results of the 3D images of EGFP-tagged MC38 cells and mCherry-tagged MFCs in cleared DLNs at 5d (F) and 10d (G). Scale bars: 10 µm. All experiments were repeated at least three times. **P < 0.01; NS: no significant difference.
Figure 6
Figure 6
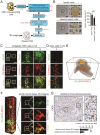
The whole-mount tissue 3D imaging of mesenteric LN tissues obtained from clinical CRC patients. A. The uDISCO protocols of clinical CRC corresponding mesenteric LN tissues. B. Photos of mesenteric LNs before and after uDISCO clearing. The quantification of the diminution of LN size was shown right. Scale bars: 9.2 mm. C and D. Photos of metastatic CRC cells and other cells detected by laser confocal microscope. Scale bars: 50 µm. E. 3D imaging of a LN tissue which was collected from a 70-year old man. Scale bars: 800 µm. F. Cross-section photos of invaded CRC cells in above LN tissue. Scale bars: 100 µm. G. The immunohistochemical staining of the LN used in 3D imaging. Similar locations were selected for the fields (162.5 µm × 162.5 µm) of immunohistochemical staining. Scale bars: 50 µm. The statistical result of tumour cell number per field analyzed by whole-mount tissue 3D imaging or traditional immunohistochemistry was shown below. *P < 0.05; **P < 0.01.

Similar articles

Cited by

References

    1. Brown M, Assen FP, Leithner A. et al. Lymph node blood vessels provide exit routes for metastatic tumor cell dissemination in mice. Science. 2018;359:1408–1411. - PubMed
    1. Reynoso GV, Weisberg AS, Shannon JP. et al. Lymph node conduits transport virions for rapid T cell activation. Nat Immunol. 2019;20:602–612. - PMC - PubMed
    1. Pereira ER, Kedrin D, Seano G. et al. Lymph node metastases can invade local blood vessels, exit the node, and colonize distant organs in mice. Science. 2018;359:1403–1407. - PMC - PubMed
    1. Werner-Klein M, Scheitler S, Hoffmann M. et al. Genetic alterations driving metastatic colony formation are acquired outside of the primary tumour in melanoma. Nat Commun. 2018;9:595. - PMC - PubMed
    1. Lee CK, Jeong SH, Jang C. et al. Tumor metastasis to lymph nodes requires YAP-dependent metabolic adaptation. Science. 2019;363:644–649. - PubMed

Publication types