

Trends of Blood Lead Levels in US Pregnant Women: The National Health and Nutrition Examination Survey (2001-2018)
- PMID: 35844875
- PMCID: PMC9283785
- DOI: 10.3389/fpubh.2022.922563
Trends of Blood Lead Levels in US Pregnant Women: The National Health and Nutrition Examination Survey (2001-2018)
Abstract
Objectives: This study investigates the trends of blood lead levels in US pregnant women based on the National Health and Nutrition Examination Survey from 2001 to 2018.
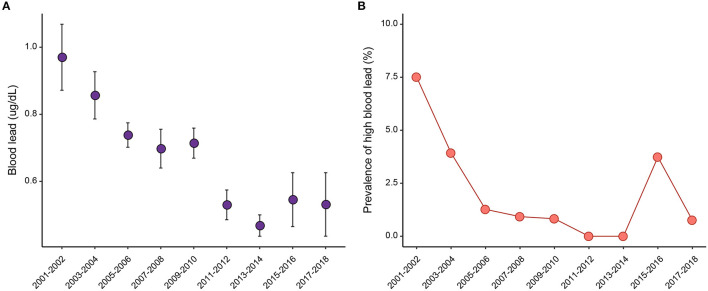
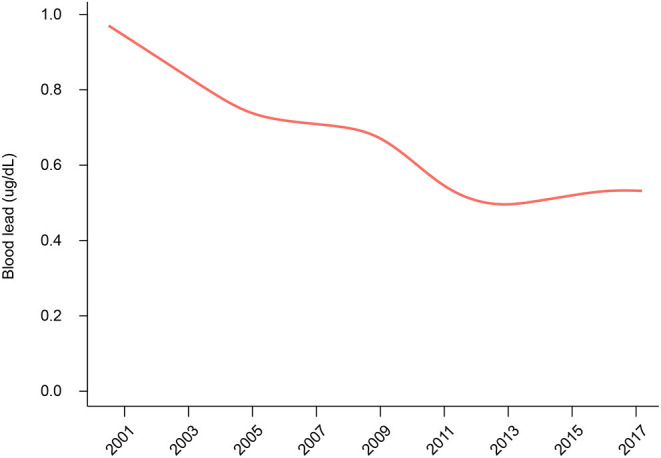
Methods: A total of 1,230 pregnant women were included in this study. The weighted logistic regression was applied to analyze the association between sociodemographic characteristics with high blood levels. We computed the blood lead levels for each survey period from 2001-2002 to 2017-2018. Moreover, we used the adjusted linear regression model to investigate the time-related change in blood lead level. The odds ratio (OR) with a 95% confidence interval (CI) was calculated accordingly.
Results: The mean blood lead was 0.73 ± 0.03 ug/dL, and high blood lead was observed in 2.53% of individuals. The Mexican Americans were more associated with high blood lead than the non-Hispanic white (OR, 1.072; 95% CI, 1.032-1.112). The mean blood lead level has decreased from 0.97 ug/dL in 2001-2002 to 0.46 ug/dL in 2013-2014. Afterward, a slight increase was observed with the mean blood lead of 0.55 ug/dL in 2015-2016 and 0.53 ug/dL in 2017-2018. In the adjusted linear regression model, each year's increase would lead to a 0.029 ug/dL decrease in blood lead (P < 0.001). However, no significant change was observed in the 2017-2018 cycle compared with 2009-2010 (P = 0.218).
Conclusion: This study summarized the trend of blood lead levels in US pregnant women over 2001-2018. Continued effort is still required to control lead sources better and protect this population from lead exposure.
Keywords: blood lead levels; lead exposure; pregnancy; prevalence; trend.
Copyright © 2022 Wang, Yang, Zhang, Liu, Xi and Liang.
Conflict of interest statement
The authors declare that the research was conducted in the absence of any commercial or financial relationships that could be construed as a potential conflict of interest.
Figures
Similar articles
-
Continual Decrease in Blood Lead Level in Americans: United States National Health Nutrition and Examination Survey 1999-2014.Am J Med. 2016 Nov;129(11):1213-1218. doi: 10.1016/j.amjmed.2016.05.042. Epub 2016 Jun 21. Am J Med. 2016. PMID: 27341956
-
Continued decline in blood lead levels among adults in the United States: the National Health and Nutrition Examination Surveys.Arch Intern Med. 2005 Oct 10;165(18):2155-61. doi: 10.1001/archinte.165.18.2155. Arch Intern Med. 2005. PMID: 16217007
-
The decline in blood lead levels in the United States. The National Health and Nutrition Examination Surveys (NHANES).JAMA. 1994 Jul 27;272(4):284-91. JAMA. 1994. PMID: 8028141
-
Screening for Elevated Blood Lead Levels in Childhood and Pregnancy: Updated Evidence Report and Systematic Review for the US Preventive Services Task Force.JAMA. 2019 Apr 16;321(15):1510-1526. doi: 10.1001/jama.2019.1004. JAMA. 2019. PMID: 30990555
-
Blood lead levels in Mexico and pediatric burden of disease implications.Ann Glob Health. 2014 Jul-Aug;80(4):269-77. doi: 10.1016/j.aogh.2014.08.002. Epub 2014 Nov 25. Ann Glob Health. 2014. PMID: 25459328 Review.
Cited by
-
Trends in urine lead and associated mortality in US adults: NHANES 1999-2018.Front Nutr. 2024 May 30;11:1411206. doi: 10.3389/fnut.2024.1411206. eCollection 2024. Front Nutr. 2024. PMID: 38873569 Free PMC article.
-
Determinants of Exposure to Potentially Toxic Metals in Pregnant Women of the DSAN-12M Cohort in the Recôncavo Baiano, Brazil.Int J Environ Res Public Health. 2023 Feb 8;20(4):2949. doi: 10.3390/ijerph20042949. Int J Environ Res Public Health. 2023. PMID: 36833642 Free PMC article.
-
Mixtures of Metals and Micronutrients in Early Pregnancy and Cognition in Early and Mid-Childhood: Findings from the Project Viva Cohort.Environ Health Perspect. 2023 Aug;131(8):87008. doi: 10.1289/EHP12016. Epub 2023 Aug 16. Environ Health Perspect. 2023. PMID: 37585348 Free PMC article.
-
Prenatal Lead Exposure, Genetic Factors, and Cognitive Developmental Delay.JAMA Netw Open. 2023 Oct 2;6(10):e2339108. doi: 10.1001/jamanetworkopen.2023.39108. JAMA Netw Open. 2023. PMID: 37870833 Free PMC article.
-
Possible Risk Factors and Their Potential Associations with Combined Heavy Metal Exposures in Pregnant Women in the Republic of Suriname.Ann Glob Health. 2024 Apr 9;90(1):30. doi: 10.5334/aogh.4402. eCollection 2024. Ann Glob Health. 2024. PMID: 38618276 Free PMC article.
References
-
- Raymond J Wheeler W Brown MJ Centers for Disease Control and Prevention . Lead screening and prevalence of blood lead levels in children aged 1-2 years–child blood lead surveillance system, United States, 2002-2010 and National Health and Nutrition Examination Survey, United States, 1999-2010. MMWR Suppl. (2014) 63:36–42. Available online at: https://www.cdc.gov/mmwr/preview/mmwrhtml/su6302a6.htm - PubMed
-
- National Toxicology Program . NTP monograph on health effects of low-level lead. NTP Monogr. (2012) 1:xiii, xv-148. Available online at: https://ntp.niehs.nih.gov/ntp/ohat/lead/final/monographhealtheffectslowl... - PubMed
MeSH terms
Substances
LinkOut - more resources
Full Text Sources