. 2022 Mar 21;10(7):2168-2201.
doi: 10.1002/fsn3.2828. eCollection 2022 Jul.

Effects of dietary protein level on small intestinal morphology, occludin protein, and bacterial diversity in weaned piglets

Affiliations

Effects of dietary protein level on small intestinal morphology, occludin protein, and bacterial diversity in weaned piglets

Zhihua Ren et al. Food Sci Nutr. .

Abstract

Due to the physiological characteristics of piglets, the morphological structure and function of the small intestinal mucosa change after weaning, which easily leads to diarrhea in piglets. The aim of this study was to investigate effects of crude protein (CP) levels on small intestinal morphology, occludin protein expression, and intestinal bacteria diversity in weaned piglets. Ninety-six weaned piglets (25 days of age) were randomly divided into four groups and fed diets containing 18%, 20%, 22%, and 24% protein. At 6, 24, 48, 72, and 96 h, changes in mucosal morphological structure, occludin mRNA, and protein expression and in the localization of occludin in jejunal and ileal tissues were evaluated. At 6, 24, and 72 h, changes in bacterial diversity and number of the ileal and colonic contents were analyzed. Results showed that structures of the jejunum and the ileum of piglets in the 20% CP group were intact. The expression of occludin mRNA and protein in the small intestine of piglets in the 20% CP group were significantly higher than those in the other groups. As the CP level increased, the number of pathogens, such as Clostridium difficile and Escherichia coli, in the intestine increased, while the number of beneficial bacteria, such as Lactobacillus, Bifidobacterium, and Roseburia, decreased. It is concluded that maintaining the CP level at 20% is beneficial to maintaining the small intestinal mucosal barrier and its absorption function, reducing the occurrence of diarrhea, and facilitating the growth and development of piglets.

Keywords: crude protein levels; diversity of intestinal bacteria; morphology and structure of small intestine; occludin protein.


Conflict of interest statement

The authors declare that they do not have any conflict of interest.

Figures

FIGURE 1‐1
FIGURE 1‐1
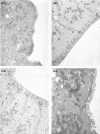
The pathological injury of jejunum in each group on 6 h after feeding. (×200). (a–d represents the groups of different CP level 18%, 20%, 22%, 24%, respectively. The arrow points to the villus injury site.)
FIGURE 1‐2
FIGURE 1‐2
The pathological injury of jejunum in each group on 24 h after feeding. (×200). (a–d represents the groups of different CP level 18%, 20%, 22%, 24%, respectively. The arrow points to the villus injury site.)
FIGURE 1‐3
FIGURE 1‐3
The pathological injury of jejunum in each group on 48 h after feeding. (×200). (a–d represents the groups of different CP level 18%, 20%, 22%, 24%, respectively. The arrow points to the villus injury site.)
FIGURE 1‐4
FIGURE 1‐4
The pathological injury of jejunum in each group on 72 h after feeding. (×200). (a–d represents the groups of different CP level 18%, 20%, 22%, 24%, respectively. The arrow points to the villus injury site.)
FIGURE 1‐5
FIGURE 1‐5
The pathological injury of jejunum in each group on 96 h after feeding. (×200). (a–d represents the groups of different CP level 18%, 20%, 22%, 24%, respectively. The arrow points to the villus injury site.)
FIGURE 1‐6
FIGURE 1‐6
The pathological injury of ileum in each group on 6 h after feeding. (×200). (a–d represents the groups of different CP level 18%, 20%, 22%, 24%, respectively. The arrow points to the villus injury site.)
FIGURE 1‐7
FIGURE 1‐7
The pathological injury of ileum in each group on 24 h after feeding. (×200). (a–d represents the groups of different CP level 18%, 20%, 22%, 24%, respectively. The arrow points to the villus injury site.)
FIGURE 1‐8
FIGURE 1‐8
The pathological injury of ileum in each group on 48 h after feeding. (×200). (a–d represents the groups of different CP level 18%, 20%, 22%, 24%, respectively. The arrow points to the villus injury site.)
FIGURE 1‐9
FIGURE 1‐9
The pathological injury of ileum in each group on 72 h after feeding. (×200). (a–d represents the groups of different CP level 18%, 20%, 22%, 24%, respectively. The arrow points to the villus injury site.)
FIGURE 1‐10
FIGURE 1‐10
The pathological injury of ileum in each group on 96 h after feeding. (×200). (a–d represents the groups of different CP level 18%, 20%, 22%, 24%, respectively. The arrow points to the villus injury site.)
FIGURE 2‐1
FIGURE 2‐1
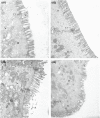
Effect of dietary protein level on the ultrastructure of ileum in weaned piglets fed for 6 h. (×6000). (a1–a4 represents the groups of different CP level 18%, 20%, 22%, 24%, respectively. M: Mitochondrion, V: Microvilli, G: Goblet cell, LY: Lysosome, N: Nucleus, TJ: Tight junction.)
FIGURE 2‐2
FIGURE 2‐2
Effect of dietary protein level on the ultrastructure of ileum in weaned piglets fed for 24 h. (×6000). (b1–b4 represents the groups of different CP level 18%, 20%, 22%, 24%, respectively. M: Mitochondrion, V: Microvilli, G: Goblet cell, LY: Lysosome, N: Nucleus, TJ: Tight junction.)
FIGURE 2‐3
FIGURE 2‐3
Effect of dietary protein level on the ultrastructure of ileum in weaned piglets fed for 48 h. (×6000). (c1–c4 represents the groups of different CP level 18%, 20%, 22%, 24%, respectively. M: Mitochondrion, V: Microvilli, G: Goblet cell, LY: Lysosome, N: Nucleus, TJ: Tight junction.)
FIGURE 2‐4
FIGURE 2‐4
Effect of dietary protein level on the ultrastructure of ileum in weaned piglets fed for 72 h. (×6000). (d1–d4 represents the groups of different CP level 18%, 20%, 22%, 24%, respectively. M: Mitochondrion, V: Microvilli, G: Goblet cell, LY: Lysosome, N: Nucleus, TJ: Tight junction.)
FIGURE 2‐5
FIGURE 2‐5
Effect of dietary protein level on the ultrastructure of ileum in weaned piglets fed for 96 h. (×6000). (e1–e4 represents the groups of different CP level 18%, 20%, 22%, 24%, respectively. M: Mitochondrion, V: Microvilli, G: Goblet cell, LY: Lysosome, N: Nucleus, TJ: Tight junction.)
FIGURE 3‐1
FIGURE 3‐1
The immunohistochemistry of jejunum in each group on 6 h after feeding. (×400). (a1–a4 represents the groups of different dietary protein level 18%, 20%, 22%, 24%, respectively.)
FIGURE 3‐2
FIGURE 3‐2
The immunohistochemistry of jejunum in each group on 24 h after feeding. (×400). (b1–b4 represents the groups of different dietary protein level 18%, 20%, 22%, 24%, respectively.)
FIGURE 3‐3
FIGURE 3‐3
The immunohistochemistry of jejunum in each group on 48 h after feeding. (×400). (c1–c4 represents the groups of different dietary protein level 18%, 20%, 22%, 24%, respectively.)
FIGURE 3‐4
FIGURE 3‐4
The immunohistochemistry of jejunum in each group on 72 h after feeding. (×400). (d1–d4 represents the groups of different dietary protein level 18%, 20%, 22%, 24%, respectively.)
FIGURE 3‐5
FIGURE 3‐5
The immunohistochemistry of jejunum in each group on 96 h after feeding. (×400). (e1–e4 represents the groups of different dietary protein level 18%, 20%, 22%, 24%, respectively.)
FIGURE 3‐6
FIGURE 3‐6
The immunohistochemistry of ileum in each group on 6 h after feeding. (×400). (a1–a4 represents the groups of different dietary protein level 18%, 20%, 22%, 24%, respectively.)
FIGURE 3‐7
FIGURE 3‐7
The immunohistochemistry of ileum in each group on 24 h after feeding. (×400). (b1–b4 represents the groups of different dietary protein level 18%, 20%, 22%, 24%, respectively.)
FIGURE 3‐8
FIGURE 3‐8
The immunohistochemistry of ileum in each group on 48 h after feeding. (×400). (c1–c4 represents the groups of different dietary protein level 18%, 20%, 22%, 24%, respectively.)
FIGURE 3‐9
FIGURE 3‐9
The immunohistochemistry of ileum in each group on 72 h after feeding. (×400). (d1–d4 represents the groups of different dietary protein level 18%, 20%, 22%, 24%, respectively.)
FIGURE 3‐10
FIGURE 3‐10
The immunohistochemistry of ileum in each group on 96 h after feeding. (×400). (e1–e4 represents the groups of different dietary protein level 18%, 20%, 22%, 24%, respectively.)
FIGURE 4‐1
FIGURE 4‐1
Effects of dietary protein level on jejunum occludin in weaned piglets. A–E represents the time point of 6, 24, 48, 72, 96 h.)
FIGURE 4‐2
FIGURE 4‐2
Effects of dietary protein level on ileum occludin in weaned piglets. (A–E represents the time point of 6, 24, 48, 72, 96 h.)
FIGURE 5‐1
FIGURE 5‐1
Rarefaction curves of samples
FIGURE 5‐2
FIGURE 5‐2
species accumulation boxplot
FIGURE 5‐3
FIGURE 5‐3
PCA profile of bacteria in ileum
FIGURE 5‐4
FIGURE 5‐4
PCA profile of bacteria in colon
FIGURE 6‐1
FIGURE 6‐1
Composition of ileal bacteria at phylum level
FIGURE 6‐2
FIGURE 6‐2
Composition of ileal bacteria at genus level
FIGURE 6‐3
FIGURE 6‐3
Composition of colonic bacteria at phylum level
FIGURE 6‐4
FIGURE 6‐4
Composition of colonic bacteria at genus level

Similar articles

Cited by

References

    1. Al‐Sadi, R. , Boivin, M. , & Ma, T. (2009). Mechanism of cytokine modulation of epithelial tight junction barrier. Frontiers in Bioscience (Landmark edition), 14, 2765–2778. 10.2741/3413 - DOI - PMC - PubMed
    1. Bokulich, N. A. , Subramanian, S. , Faith, J. J. , Gevers, D. , Gordon, J. I. , Knight, R. , Mills, D. A. , & Caporaso, J. G. (2013). Quality‐filtering vastly improves diversity estimates from Illumina amplicon sequencing. Nature Methods, 10(1), 57–59. 10.1038/nmeth.2276 - DOI - PMC - PubMed
    1. Buckley, A. , & Turner, J. R. (2018). Cell biology of tight junction barrier regulation and mucosal disease. Cold Spring Harbor Perspectives in Biology, 10(1), a029314. 10.1101/cshperspect.a029314 - DOI - PMC - PubMed
    1. Caporaso, J. G. , Kuczynski, J. , Stombaugh, J. , Bittinger, K. , Bushman, F. D. , Costello, E. K. , Fierer, N. , Peña, A. G. , Goodrich, J. K. , Gordon, J. I. , Huttley, G. A. , Kelley, S. T. , Knights, D. , Koenig, J. E. , Ley, R. E. , Lozupone, C. A. , McDonald, D. , Muegge, B. D. , Pirrung, M. , … Knight, R. (2010). QIIME allows analysis of high‐throughput community sequencing data. Nature Methods, 7(5), 335–336. 10.1038/nmeth.f.303 - DOI - PMC - PubMed
    1. Dong, Y. , Fan, H. , Yao, S. , Wang, Y. , Yao, R. , Kong, X. , & Deng, J. (2019). Effects of dietary crude protein level on digestive capacity, colonic ammonia nitrogen content and inflammatory injury in weaned piglets. Chinese Journal of Animal Nutrition, 31(08), 3561–3570.