

Ameliorated effects of a lipopeptide surfactin on insulin resistance in vitro and in vivo
- PMID: 35844917
- PMCID: PMC9281957
- DOI: 10.1002/fsn3.2852
Ameliorated effects of a lipopeptide surfactin on insulin resistance in vitro and in vivo
Abstract
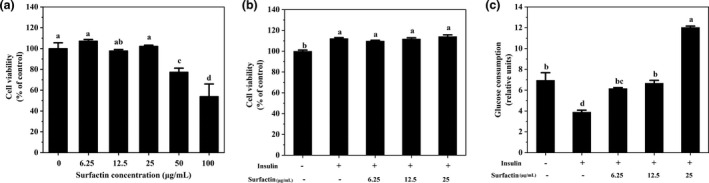
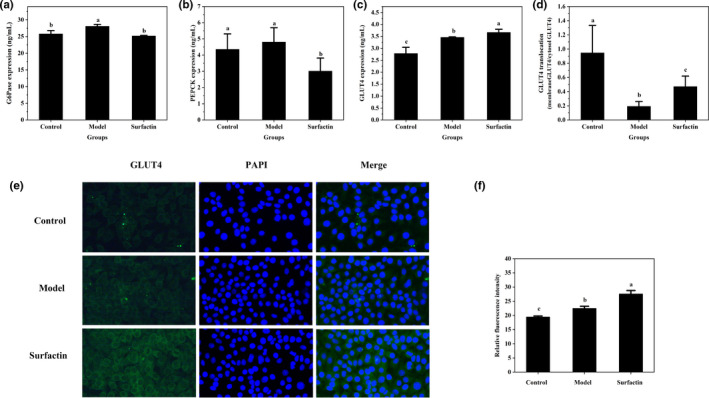
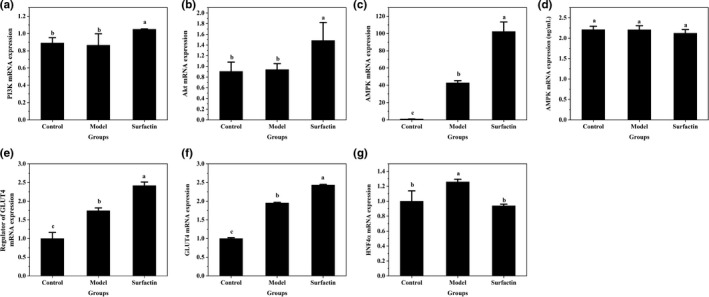
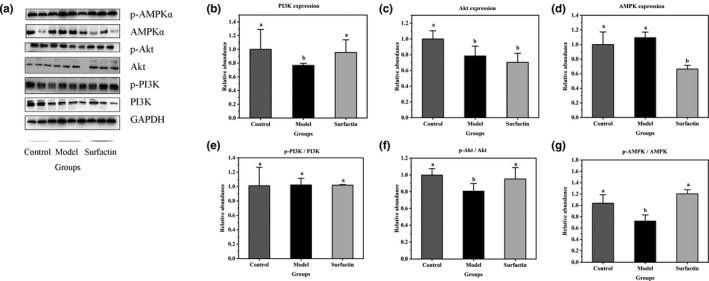
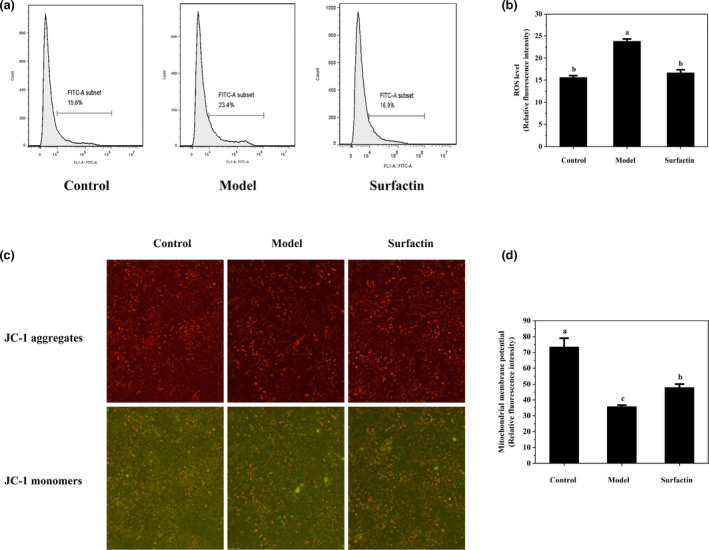
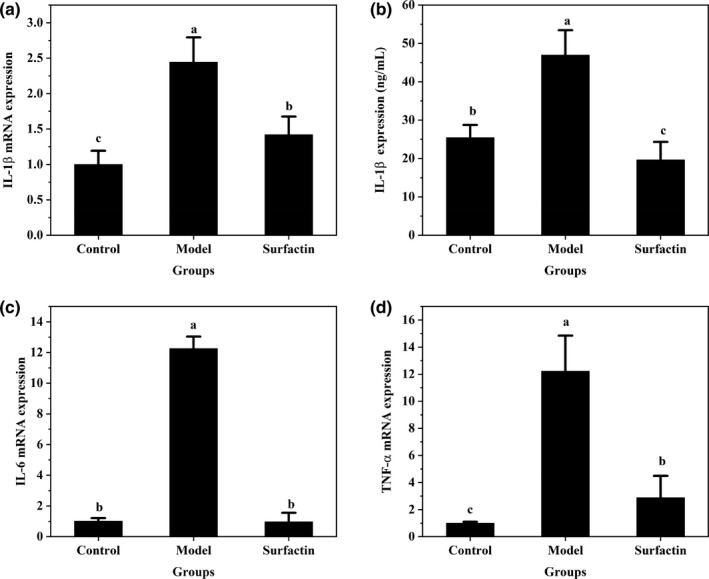
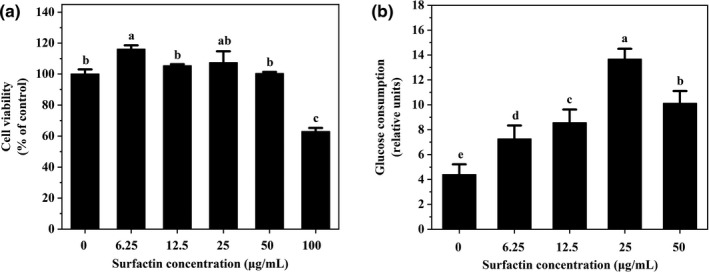
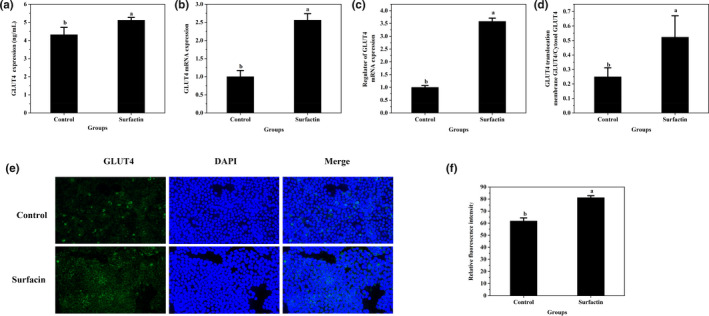
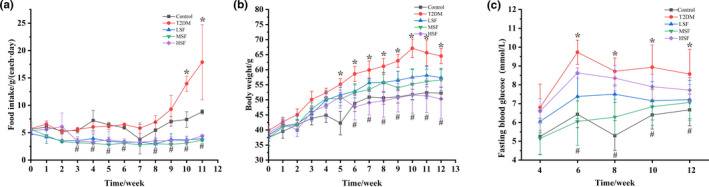
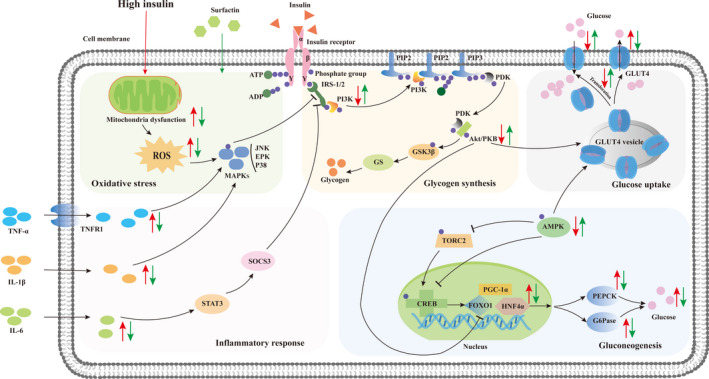
Surfactin, produced by Bacillus amyloliquefaciens fmb50, was used to treat insulin-resistant (IR) hepatocyte. It was found that surfactin increased glucose consumption in insulin-resistant HepG2 (IR-HepG2) cells and ameliorated IR by increasing glucose transporter 4 (GLUT4) protein expression and AMP-activated protein kinase (AMPK) mRNA expression, promoting GLUT4 translocation and activating phosphatidylinositol 3-kinase (PI3K)/protein kinase B (Akt) in IR-HepG2 cells. Meanwhile, surfactin downregulated protein expression of phosphoenolpyruvate carboxy kinase (PEPCK) and glucose-6-phosphatase (G6Pase), further inhibiting hepatic gluconeogenesis. In addition, surfactin played important roles in eliminating reactive oxygen species (ROS), improving mitochondrial dysfunction, and inhibiting proinflammatory mediators. We observed that surfactin promoted glucose consumption, meanwhile increased translocation and protein expression of GLUT4 in Caco-2 cells. These results confirmed the conclusion in hepatic cells. Furthermore, surfactin supplement decreased body weight, food intake, and fasting blood glucose of type 2 diabetes mellitus (T2DM) mice induced by streptozotocin (STZ)/high-fat diet (HFD). Our data indicated that surfactin ameliorated insulin resistance and lowered blood glucose in intro and in vivo.
Keywords: GLUT4; PI3K/Akt pathway; inflammation; insulin resistance; oxidative stress; surfactin.
© 2022 The Authors. Food Science & Nutrition published by Wiley Periodicals LLC.
Conflict of interest statement
The authors declare no competing financial interest.
Figures
Similar articles
-
Surfactin Mitigates a High-Fat Diet and Streptozotocin-Induced Type 2 Diabetes through Improving Pancreatic Dysfunction and Inhibiting Inflammatory Response.Int J Mol Sci. 2022 Sep 21;23(19):11086. doi: 10.3390/ijms231911086. Int J Mol Sci. 2022. PMID: 36232419 Free PMC article.
-
A diarylheptanoid compound from Alpinia officinarum Hance ameliorates high glucose-induced insulin resistance by regulating PI3K/AKT-Nrf2-GSK3β signaling pathways in HepG2 cells.J Ethnopharmacol. 2022 Sep 15;295:115397. doi: 10.1016/j.jep.2022.115397. Epub 2022 May 20. J Ethnopharmacol. 2022. PMID: 35605918
-
Activation of NRF2 by epiberberine improves oxidative stress and insulin resistance in T2DM mice and IR-HepG2 cells in an AMPK dependent manner.J Ethnopharmacol. 2024 Jun 12;327:117931. doi: 10.1016/j.jep.2024.117931. Epub 2024 Feb 19. J Ethnopharmacol. 2024. PMID: 38382657
-
Irisin inhibits hepatic gluconeogenesis and increases glycogen synthesis via the PI3K/Akt pathway in type 2 diabetic mice and hepatocytes.Clin Sci (Lond). 2015 Nov;129(10):839-50. doi: 10.1042/CS20150009. Epub 2015 Jul 13. Clin Sci (Lond). 2015. PMID: 26201094
-
Phlorizin from Lithocarpus litseifolius [Hance] Chun ameliorates FFA-induced insulin resistance by regulating AMPK/PI3K/AKT signaling pathway.Phytomedicine. 2024 Jul 25;130:155743. doi: 10.1016/j.phymed.2024.155743. Epub 2024 May 15. Phytomedicine. 2024. PMID: 38824822
Cited by
-
Glucose Metabolism-Modifying Natural Materials for Potential Feed Additive Development.Pharmaceutics. 2024 Sep 13;16(9):1208. doi: 10.3390/pharmaceutics16091208. Pharmaceutics. 2024. PMID: 39339244 Free PMC article. Review.
-
Surfactin inhibits enterococcal biofilm formation via interference with pilus and exopolysaccharide biosynthesis.BMC Microbiol. 2025 Feb 24;25(1):85. doi: 10.1186/s12866-025-03786-y. BMC Microbiol. 2025. PMID: 39994536 Free PMC article.
-
Surfactin Mitigates a High-Fat Diet and Streptozotocin-Induced Type 2 Diabetes through Improving Pancreatic Dysfunction and Inhibiting Inflammatory Response.Int J Mol Sci. 2022 Sep 21;23(19):11086. doi: 10.3390/ijms231911086. Int J Mol Sci. 2022. PMID: 36232419 Free PMC article.
-
Bacillus subtilis-Derived Surfactin Alleviates Offspring Intestinal Inflammatory Injuries Through Breast Milk.Nutrients. 2025 Mar 13;17(6):1009. doi: 10.3390/nu17061009. Nutrients. 2025. PMID: 40290006 Free PMC article.
References
-
- Chen, Z. Q. , Li, W. W. , Guo, Q. W. , Xu, L. L. , Santhanama, R. K. , Gao, X. D. , Chen, Y. , Wang, C. L. , Panichayupakaranant, P. , & Chen, H. X. (2019). Anthocyanins from dietary black soybean potentiate glucose uptake in L6 rat skeletal muscle cells via up‐regulating phosphorylated Akt and GLUT4. Journal of Functional Foods, 52, 663–669. 10.1016/j.jff.2018.11.049 - DOI
-
- Choi, S. S. , Cha, B. Y. , Iida, K. , Lee, Y. S. , Yonezawa, T. , Teruya, T. , Nagai, K. , & Woo, J. T. (2011). Artepillin C, as a PPARγ ligand, enhances adipocyte differentiation and glucose uptake in 3T3‐L1 cells. Biochemical Pharmacology, 81(7), 925–933. - PubMed
-
- Dilna, S. V. , Surya, H. , Aswathy, R. G. , Varsha, K. K. , Sakthikumar, D. N. , Pandey, A. , & Nampoothiri, K. M. (2015). Characterization of an exopolysaccharide with potential health‐benefit properties from a probiotic Lactobacillus plantarum RJF4. LWT‐Food Science and Technology, 64(2), 1179–1186. 10.1016/j.lwt.2015.07.040 - DOI
LinkOut - more resources
Full Text Sources
