. 2022 Jun 29:9:826744.
doi: 10.3389/fcvm.2022.826744. eCollection 2022.

Identification of Key Non-coding RNAs and Transcription Factors in Calcific Aortic Valve Disease

Affiliations

Identification of Key Non-coding RNAs and Transcription Factors in Calcific Aortic Valve Disease

Shuai Guo et al. Front Cardiovasc Med. .

Abstract

Background: Calcific aortic valve disease (CAVD) is one of the most frequently occurring valvular heart diseases among the aging population. Currently, there is no known pharmacological treatment available to delay or reverse CAVD progression. The regulation of gene expression could contribute to the initiation, progression, and treatment of CAVD. Non-coding RNAs (ncRNAs) and transcription factors play essential regulatory roles in gene expression in CAVD; thus, further research is urgently needed.

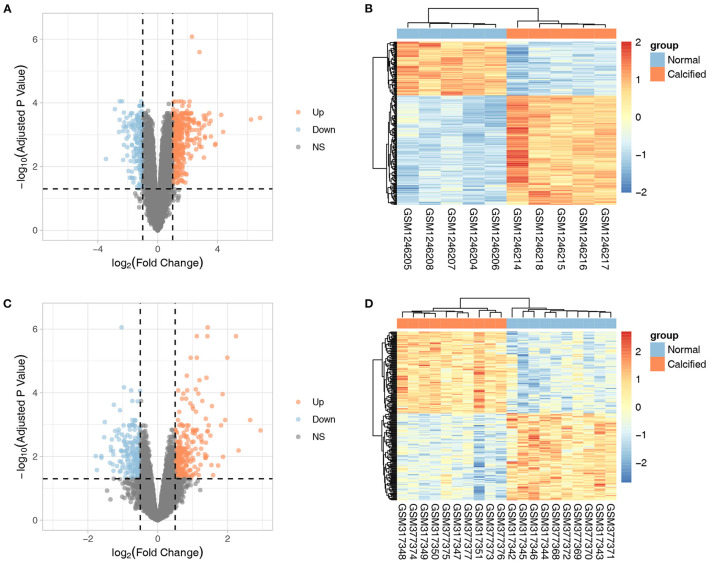
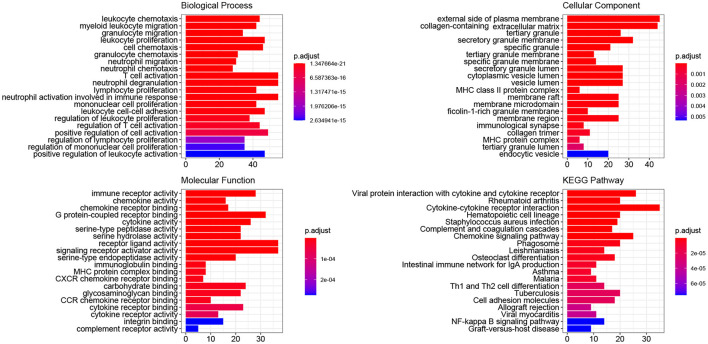
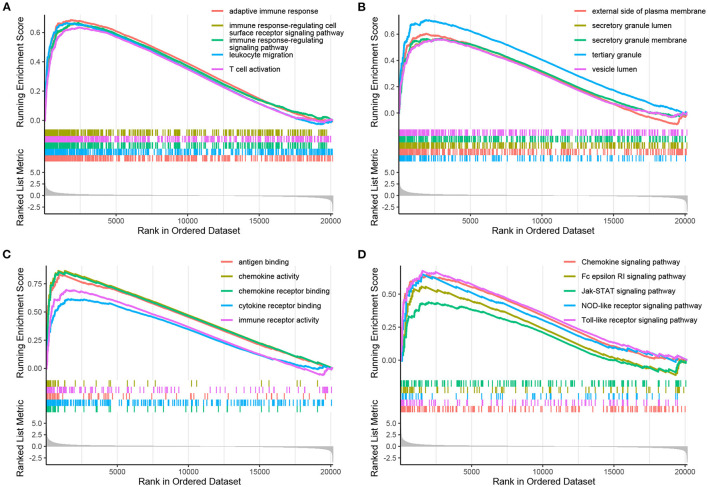
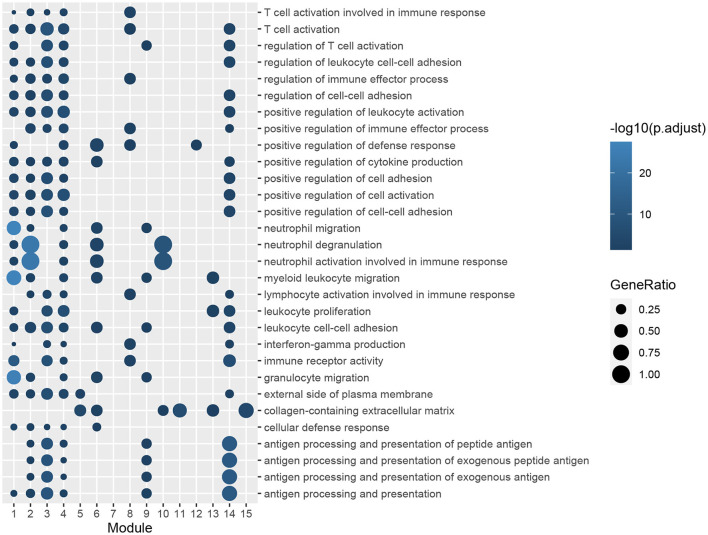
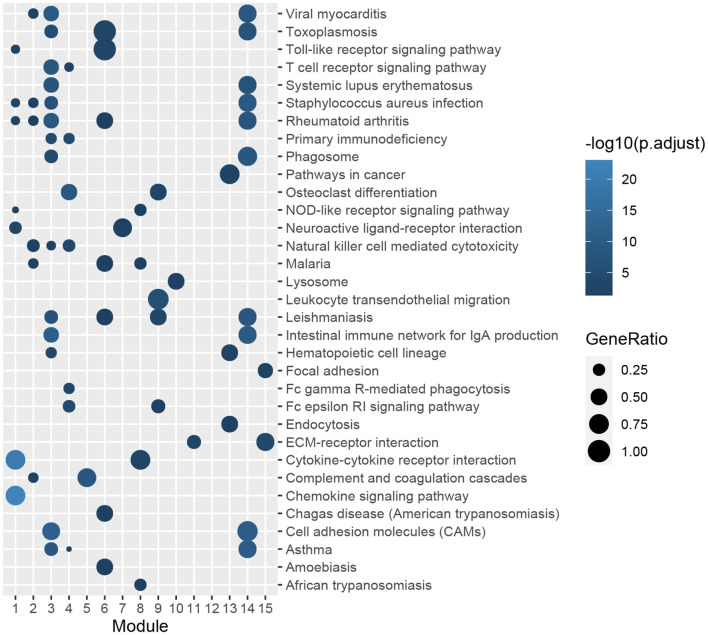
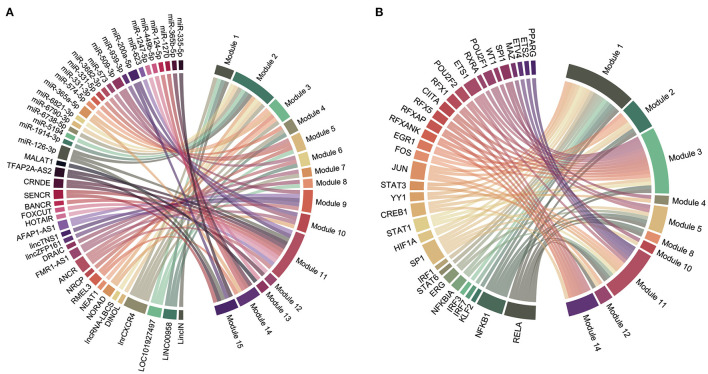
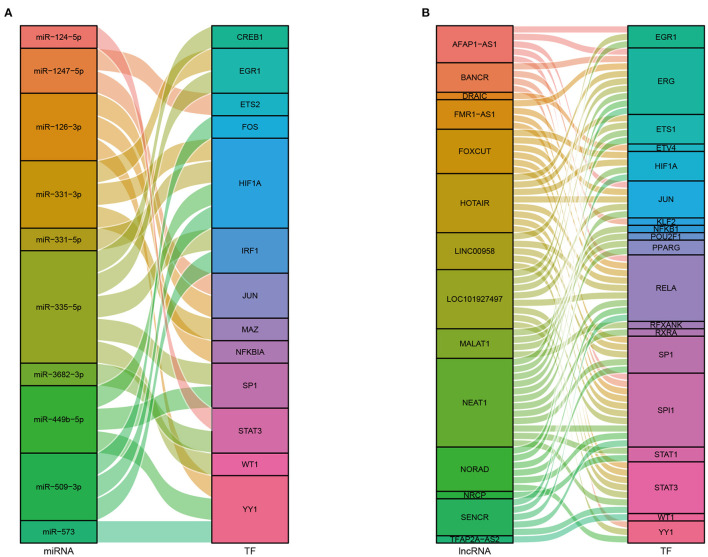
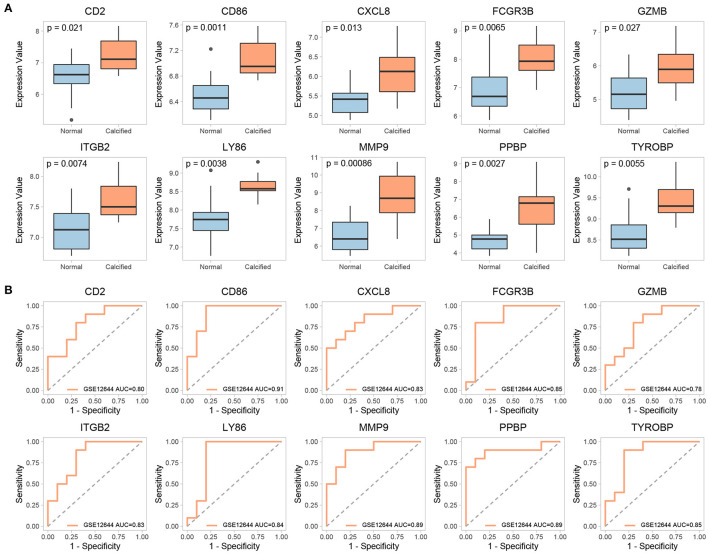
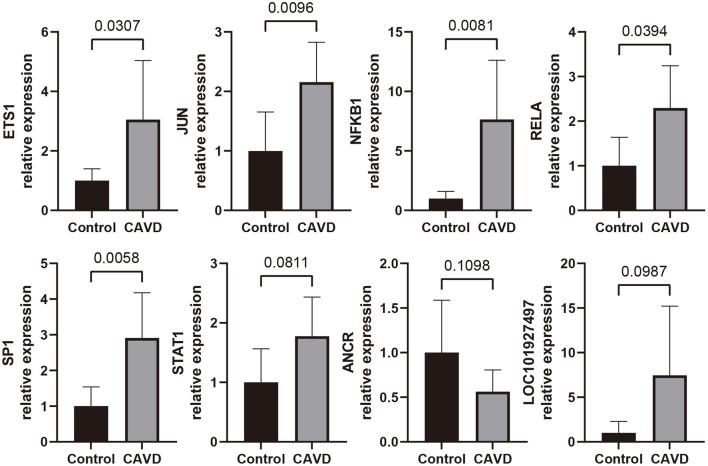
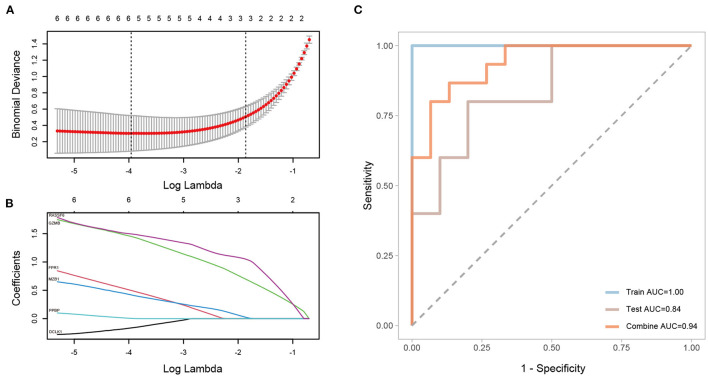
Materials and methods: The gene-expression profiles of GSE51472 and GSE12644 were obtained from the Gene Expression Omnibus database, and differentially expressed genes (DEGs) were identified in each dataset. A protein-protein-interaction (PPI) network of DEGs was then constructed using the Search Tool for the Retrieval of Interacting Genes/Proteins database, and functional modules were analyzed with ClusterOne plugin in Cytoscape. Furthermore, Gene Ontology-functional annotation and Kyoto Encyclopedia of Genes and Genomes-pathway analysis were conducted for each functional module. Most crucially, ncRNAs and transcription factors acting on each functional module were separately identified using the RNAInter and TRRUST databases. The expression of predicted transcription factors and key genes was validated using GSE51472 and GSE12644. Furthermore, quantitative real-time PCR (qRT-PCR) experiments were performed to validate the differential expression of most promising candidates in human CAVD and control samples.

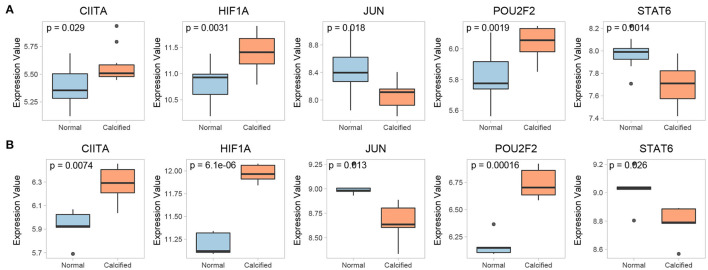
Results: Among 552 DEGs, 383 were upregulated and 169 were downregulated. In the PPI network, 15 functional modules involving 182 genes and proteins were identified. After hypergeometric testing, 45 ncRNAs and 33 transcription factors were obtained. Among the predicted transcription factors, CIITA, HIF1A, JUN, POU2F2, and STAT6 were differentially expressed in both the training and validation sets. In addition, we found that key genes, namely, CD2, CD86, CXCL8, FCGR3B, GZMB, ITGB2, LY86, MMP9, PPBP, and TYROBP were also differentially expressed in both the training and validation sets. Among the most promising candidates, differential expressions of ETS1, JUN, NFKB1, RELA, SP1, STAT1, ANCR, and LOC101927497 were identified via qRT-PCR experiments.

Conclusion: In this study, we identified functional modules with ncRNAs and transcription factors involved in CAVD pathogenesis. The current results suggest candidate molecules for further research on CAVD.

Keywords: bioinformatics; calcific aortic valve disease; epigenetics; non-coding RNA; transcription factor.


Conflict of interest statement

The authors declare that the research was conducted in the absence of any commercial or financial relationships that could be construed as a potential conflict of interest.

Figures

Figure 1
Figure 1
Volcano plots and cluster heatmaps of DEGs from the two datasets. (A,B) Volcano plots and cluster heatmaps of DEGs from the GSE51472 dataset. (C,D) Volcano plots and cluster heatmaps of DEGs from the GSE12644 dataset. In the volcano plots, the orange dots represent upregulated genes, and the blue dots represent downregulated genes. In the cluster heatmaps, the red bars indicate upregulated genes, and the blue bars indicate downregulated genes. The color gradation indicates the |log2(fold change)| value.
Figure 2
Figure 2
GO and KEGG pathway-enrichment analysis of DEGs. The colors, ranging from blue to red, represent adjusted P-value of each term, whereas the numbers in the X-axis indicate the number of DEGs for each specific term.
Figure 3
Figure 3
Enrichment plots obtained by GSEA. The enriched gene sets for BPs (A), CCs (B), MFs (C), and KEGG pathways (D) are shown.
Figure 4
Figure 4
GO enrichment analysis of genes in functional modules. The color gradation represents the significance of the enrichment for each indicated GO term. The enrichment increased significantly, when going from a dark to a light shade. The sizes of the circles indicate the proportions of genes in each functional module present among the entered GO genes.
Figure 5
Figure 5
KEGG pathway-enrichment analysis of genes in functional modules. The color gradation represents the significance of the enrichment for each indicated KEGG pathway. The enrichment increased significantly, when going from a dark shade to a light shade. The sizes of the circles indicate the proportions of genes in each functional module present among the entered KEGG pathways.
Figure 6
Figure 6
Regulatory chord diagram of key ncRNAs/TFs and functional modules. (A) Regulatory relationship between ncRNAs and functional modules. (B) Regulatory relationship between TFs and functional modules.
Figure 7
Figure 7
Sankey diagrams of the interactions between ncRNAs and TFs. (A) Interactions between miRNAs and TFs. (B) Interactions between lncRNAs and TFs.
Figure 8
Figure 8
Validation of differential expression and ROC analysis of key genes. (A) Validation of differential expression of key genes in the GSE12644 dataset. (B) ROC analysis of common differentially expressed key genes in GSE12644 datasets.
Figure 9
Figure 9
Commonly differentially expressed TFs in the (A) GSE51472 and (B) GSE12644 datasets.
Figure 10
Figure 10
qRT-PCR analyses for expression level of the most promising candidate lncRNAs and TFs in control aortic valves (n = 6) and CAVD valves (n = 7).
Figure 11
Figure 11
Construction and validation of a LASSO regression model. (A,B) Selected genes and their coefficients according to minimum binominal deviance. (C) ROC analysis of the LASSO regression model with the training set, validation set, and both sets combined.

Similar articles

Cited by

References

    1. Nkomo VT, Gardin JM, Skelton TN, Gottdiener JS, Scott CG, Enriquez-Sarano M. Burden of valvular heart diseases: a population-based study. Lancet. (2006) 368:1005–11. 10.1016/S0140-6736(06)69208-8 - DOI - PubMed
    1. Coffey S, Cox B, Williams MJ. The prevalence, incidence, progression, and risks of aortic valve sclerosis: a systematic review and meta-analysis. J Am Coll Cardiol. (2014) 63:2852–61. 10.1016/j.jacc.2014.04.018 - DOI - PubMed
    1. Lindman BR, Clavel MA, Mathieu P, Iung B, Lancellotti P, Otto CM, et al. . Calcific aortic stenosis. Nat Rev Dis Primers. (2016) 2:16006. 10.1038/nrdp.2016.6 - DOI - PMC - PubMed
    1. Freeman RV, Otto CM. Spectrum of calcific aortic valve disease: pathogenesis, disease progression, and treatment strategies. Circulation. (2005) 111:3316–26. 10.1161/CIRCULATIONAHA.104.486738 - DOI - PubMed
    1. Lindman BR, Merryman WD. Unloading the stenotic path to identifying medical therapy for calcific aortic valve disease: barriers and opportunities. Circulation. (2021) 143:1455–7. 10.1161/CIRCULATIONAHA.120.052531 - DOI - PMC - PubMed