

Ferroptosis and Autophagy-Related Genes in the Pathogenesis of Ischemic Cardiomyopathy
- PMID: 35845045
- PMCID: PMC9279674
- DOI: 10.3389/fcvm.2022.906753
Ferroptosis and Autophagy-Related Genes in the Pathogenesis of Ischemic Cardiomyopathy
Abstract
Background: Obesity plays an important role in type 2 diabetes mellitus (T2DM) and myocardial infarction (MI). Ferroptosis and ferritinophagy are related to metabolic pathways, such as fatty acid metabolism and mitochondrial respiration. We aimed to investigate the ferroptosis- and autophagy-related differentially expressed genes (DEGs) that might be potential targets for MI progression.
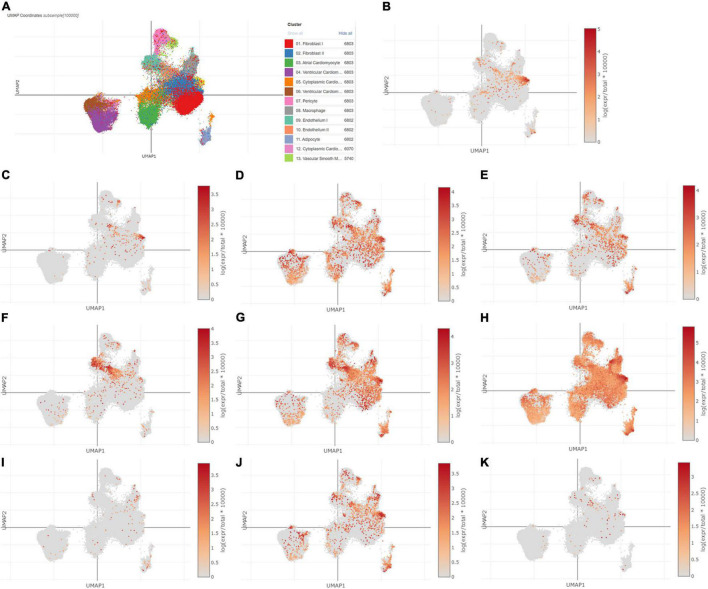
Methods: GSE116250 was analyzed to obtain DEGs. A Venn diagram was used to obtain the overlapping ferroptosis- and autophagy-related DEGs. The enrichment pathway analysis was performed and the hub genes were obtained. Pivotal miRNAs, transcription factors, and drugs with the hub genes interactions were also predicted. The MI mice model was constructed, and qPCR analysis and single-cell sequencing were used to validate the hub genes.
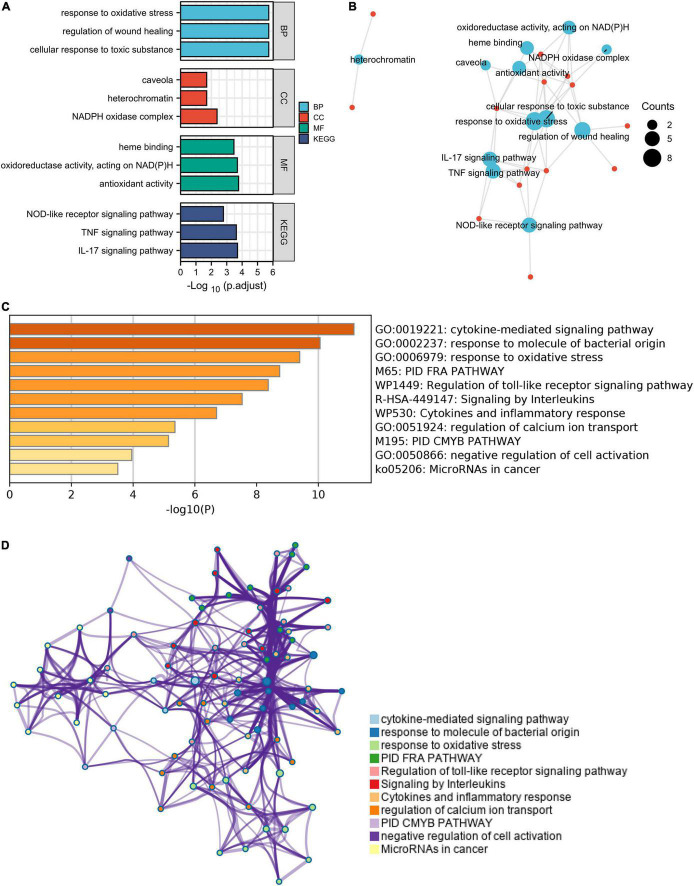
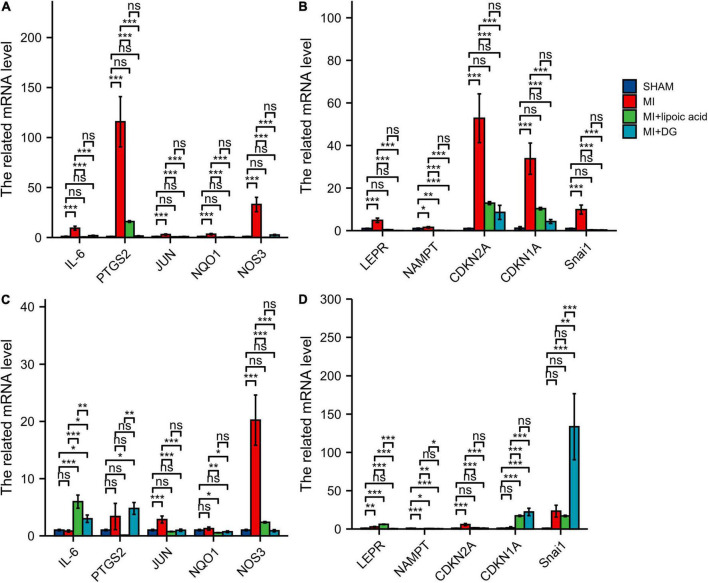
Results: Utilizing the limma package and the Venn diagram, 26 ferroptosis-related and 29 autophagy-related DEGs were obtained. The list of ferroptosis-related DEGs was analyzed, which were involved in the cellular response to a toxic substance, cellular oxidant detoxification, and the IL-17 signaling pathway. The list of autophagy-related DEGs was involved in the regulation of autophagy, the regulation of JAK-STAT signaling pathway, and the regulation of MAPK cascade. In the protein-protein interaction network, the hub DEGs, such as IL-6, PTGS2, JUN, NQO1, NOS3, LEPR, NAMPT, CDKN2A, CDKN1A, and Snai1, were obtained. After validation using qPCR analysis in the MI mice model and single-cell sequencing, the 10 hub genes can be the potential targets for MI deterioration.
Conclusion: The screened hub genes, IL-6, PTGS2, JUN, NQO1, NOS3, LEPR, NAMPT, CDKN2A, CDKN1A, and Snai1, may be therapeutic targets for patients with MI and may prevent adverse cardiovascular events.
Keywords: GEO; IL-6; autophagy; ferroptosis; myocardial infarction; pathway enrichment analysis; progression; single cell sequencing.
Copyright © 2022 Zheng, Gao, Zhang, Cheng, Liu, Qi and Li.
Conflict of interest statement
The authors declare that the research was conducted in the absence of any commercial or financial relationships that could be construed as a potential conflict of interest.
Figures


Similar articles
-
The Key Genes Underlying Pathophysiology Association between Plaque Instability and Progression of Myocardial Infarction.Dis Markers. 2021 Dec 9;2021:4300406. doi: 10.1155/2021/4300406. eCollection 2021. Dis Markers. 2021. PMID: 34925642 Free PMC article.
-
Expression profiles and functions of ferroptosis-related genes in intimal hyperplasia induced by carotid artery ligation in mice.Front Genet. 2022 Aug 30;13:964458. doi: 10.3389/fgene.2022.964458. eCollection 2022. Front Genet. 2022. PMID: 36110200 Free PMC article.
-
Coronavirus disease 2019-related myocarditis genes contribute to ECMO prognosis.BMC Cardiovasc Disord. 2024 Jul 19;24(1):375. doi: 10.1186/s12872-024-04032-5. BMC Cardiovasc Disord. 2024. PMID: 39026189 Free PMC article.
-
An in-Depth Exploration of the Genetic Interaction Network Between Ferroptosis and Acute Pancreatitis.J Inflamm Res. 2023 Oct 6;16:4425-4439. doi: 10.2147/JIR.S431601. eCollection 2023. J Inflamm Res. 2023. PMID: 37822529 Free PMC article.
-
Bioinformatics analysis identifies ferroptosis‑related genes in the regulatory mechanism of myocardial infarction.Exp Ther Med. 2022 Nov 8;24(6):748. doi: 10.3892/etm.2022.11684. eCollection 2022 Dec. Exp Ther Med. 2022. PMID: 36561967 Free PMC article.
Cited by
-
Identification and validation of biomarkers, construction of diagnostic models, and investigation of immunological infiltration characteristics for idiopathic frozen shoulder.Front Immunol. 2025 Jul 16;16:1559422. doi: 10.3389/fimmu.2025.1559422. eCollection 2025. Front Immunol. 2025. PMID: 40740765 Free PMC article.
-
Potential diagnostic biomarkers: 6 cuproptosis- and ferroptosis-related genes linking immune infiltration in acute myocardial infarction.Genes Immun. 2023 Aug;24(4):159-170. doi: 10.1038/s41435-023-00209-8. Epub 2023 Jul 8. Genes Immun. 2023. PMID: 37422588 Free PMC article.
-
Axin2 depletion in macrophages alleviated senescence and increased immune response after myocardial infarction.Inflamm Res. 2024 Mar;73(3):407-414. doi: 10.1007/s00011-023-01843-8. Epub 2023 Dec 30. Inflamm Res. 2024. PMID: 38158447
-
The Gene Network Correlation Analysis of Obesity to Type 1 Diabetes and Cardiovascular Disorders: An Interactome-Based Bioinformatics Approach.Mol Biotechnol. 2024 Aug;66(8):2123-2143. doi: 10.1007/s12033-023-00845-5. Epub 2023 Aug 22. Mol Biotechnol. 2024. PMID: 37606877
-
Polycystic ovary syndrome and epithelial-mesenchymal transition: Mendelian randomization and single-cell analysis insights.J Ovarian Res. 2025 Feb 19;18(1):33. doi: 10.1186/s13048-025-01617-2. J Ovarian Res. 2025. PMID: 39972362 Free PMC article.
References
-
- Naghavi M, Abajobir AA, Abbafati C, Abbas KM, Abd-Allah F, Abera SF, et al. Global, regional, and national age-sex specific mortality for 264 causes of death, 1980–2016: a systematic analysis for the Global Burden of Disease Study 2016. Lancet. (2017) 390:1151–210. 10.1016/S0140-6736(17)32152-9 - DOI - PMC - PubMed
LinkOut - more resources
Full Text Sources
Research Materials
Miscellaneous