

Dataset of Phanerozoic continental climate and Köppen-Geiger climate classes
- PMID: 35845094
- PMCID: PMC9278035
- DOI: 10.1016/j.dib.2022.108424
Dataset of Phanerozoic continental climate and Köppen-Geiger climate classes
Abstract
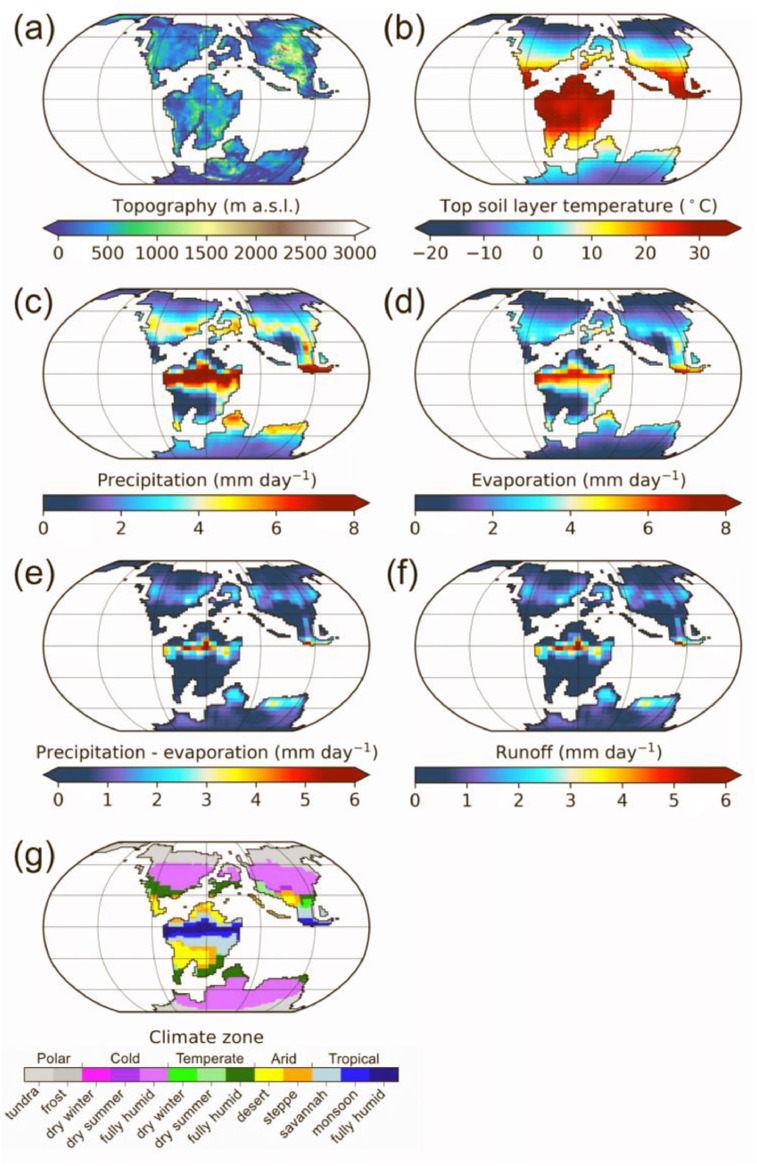
This article describes a suite of global climate model output files that provide continental climatic conditions (monthly temperatures, precipitation, evaporation, precipitation minus evaporation balance, runoff) together with the calculated Köppen-Geiger climate classes and topography, for 28 evenly spaced time slices through the Phanerozoic (Cambrian to Quaternary, 540 Ma to 0 Ma). Climatic variables were simulated with the Fast Ocean Atmosphere Model (FOAM), using a recent set of open-access continental reconstructions with paleotopography and recent atmospheric CO2 and solar luminosity estimates. FOAM is a general circulation model frequently used in paleoclimate studies, especially in the Palaeozoic. Köppen-Geiger climate classes were calculated based on simulated temperature and precipitation fields using Wong Hearing et al.'s [1] implementation of Peel et al.'s [2] updated classification. This dataset provides a unique window onto changing continental climate throughout the Phanerozoic that accounts for the simultaneous evolution of paleogeography (continental configuration and topography), atmospheric composition and greenhouse gas forcing, and solar luminosity.
Keywords: Continental climate; General circulation model; Köppen–Geiger climate classes; Paleoclimate; Phanerozoic; Seasonal evaporation; Seasonal precipitation; Seasonal temperatures.
© 2022 The Authors. Published by Elsevier Inc.
Conflict of interest statement
The authors declare that they have no known competing financial interests or personal relationships that could have appeared to influence the work reported in this paper.
Figures
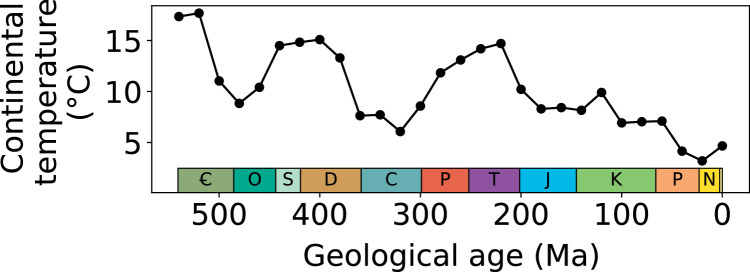
 : Cambrian, O: Ordovician, S: Silurian, D: Devonian, C: Carboniferous, P: Permian, T: Triassic, J: Jurassic, K: Cretaceous, P: Paleogene, N: Neogene.
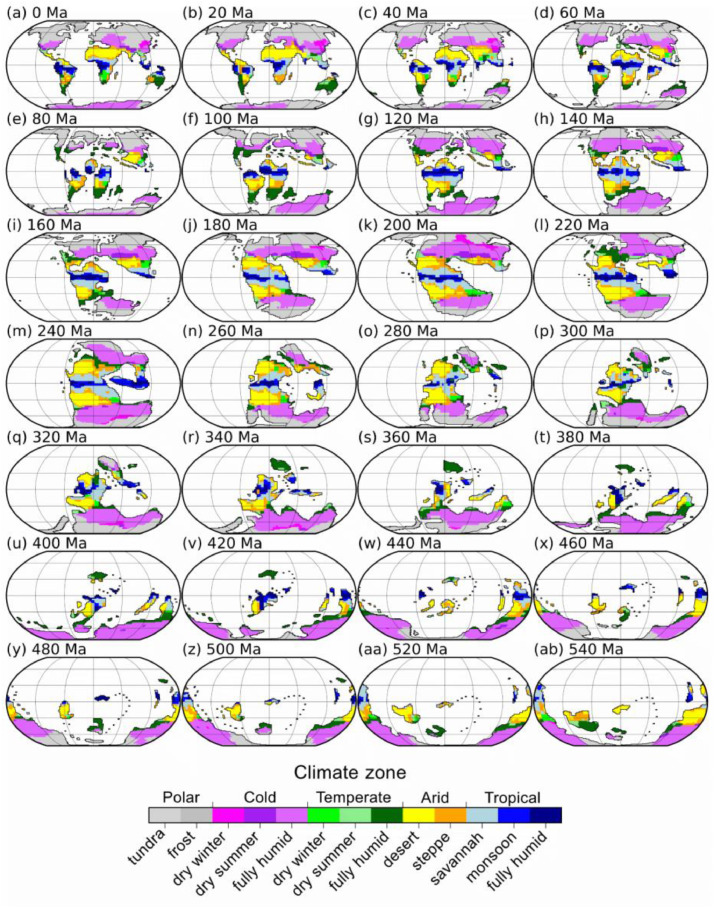
References
-
- Wong Hearing T.W., Pohl A., Williams M., Donnadieu Y., Harvey T.H.P., Scotese C.R., Sepulchre P., Franc A., Vandenbroucke T.R.A. Quantitative comparison of geological data and model simulations constrains early Cambrian geography and climate. Nat. Commun. 2021;12:3868. doi: 10.1038/s41467-021-24141-5. - DOI - PMC - PubMed
-
- Peel M.C., Finlayson B.L., McMahon T.A. Updated world map of the Köppen-Geiger climate classification. Hydrol. Earth Syst. Sci. 2007;11:1633–1644. doi: 10.5194/hess-11-1633-2007. - DOI
-
- C.R. Scotese, N. Wright, PALEOMAP Paleodigital Elevation Models (PaleoDEMS) for the Phanerozoic (PALEOMAP Project, 2018), (2018). https://www.earthbyte.org/paleodem-resource- scotese-and-wright-2018/.
-
- Jacob R.L. University of Wisconsin Madison; 1997. Low frequency variability in a simulated atmosphere-ocean system; p. 170.https://ftp.mcs.anl.gov/pub/People/jacob/RLJdissertation.ps.gz PhD thesispages.
LinkOut - more resources
Full Text Sources
Miscellaneous
