. 2022 Jul 6:5:100119.
doi: 10.1016/j.fochms.2022.100119. eCollection 2022 Dec 30.

NMR and HPLC profiling of bee pollen products from different countries

Affiliations

NMR and HPLC profiling of bee pollen products from different countries

Peng Lu et al. Food Chem (Oxf). .

Abstract

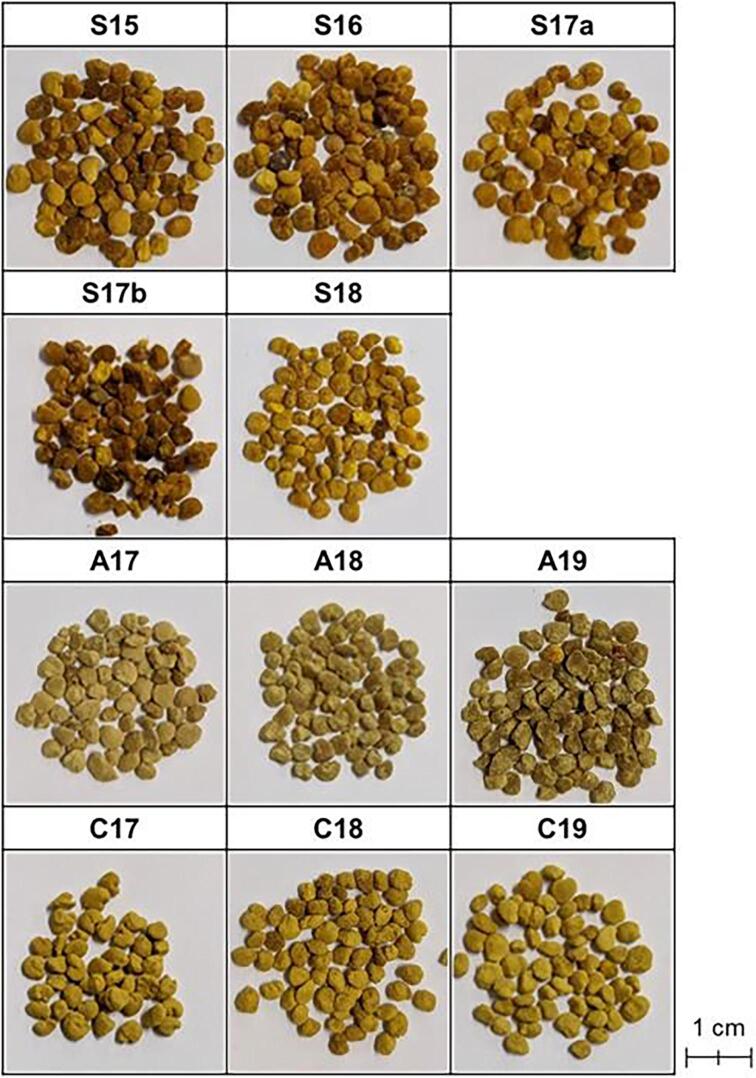
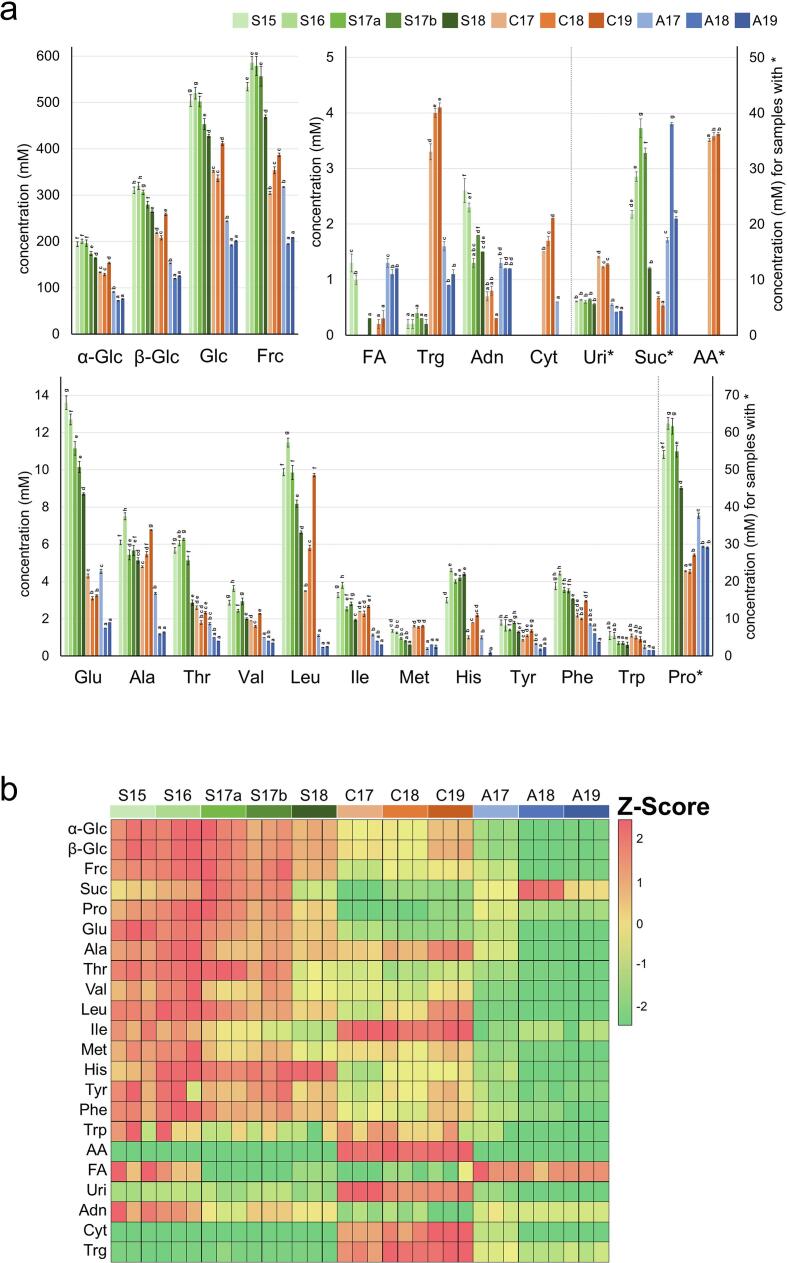
Bee pollen, a beehive product collected from flowers by honeybees, contains over 250 biological substances, and has attracted increasing attention as a functional food. However, commercial bee pollen products are often multifloral, and samples from different countries vary significantly. There is no universal standard for objective quality assessment of bee pollen based on its chemical composition. Here, we report metabolomic analysis of 11 bee pollen samples from Spain, China, and Australia for quality control. The characteristics of the samples depend on the sucrose, nucleoside, amino acid, and flavanol concentrations. Bee pollen samples from Spain and Australia had higher sucrose and adenosine concentrations, whereas those from China had higher trigonelline, uridine, and cytidine concentrations. Interestingly, acetic acid was only detected in samples from China. These components can be used to identify the country of origin. The obtained profiles of the samples will contribute to universal standard development for bee pollen products.

Keywords: Bee pollen; Component profiling; Flavonoids; Metabolomics; Principal component analysis.


Conflict of interest statement

The authors declare that they have no known competing financial interests or personal relationships that could have appeared to influence the work reported in this paper.

Figures

Fig. 1
Fig. 1
Appearances of the 11 kinds of bee pollen samples.
Fig. 2
Fig. 2
1H NMR spectra of the high (0.0–3.0 ppm) and low magnetic field (5.5–9.5 ppm) regions, and signal assignment of the components in bee pollen D2O extracts (a) and bee pollen CD3OD extracts (b).
Fig. 3
Fig. 3
Concentrations of 22 components in the 11 types of bee pollen D2O extracts determined using quantitative 1H NMR spectroscopy (a), and the generated heat map (b). The data in a are presented as mean values ± SD (n = 3). The left and right vertical axes in a represent components without and with *, respectively. Means with the same letter are not significantly different from each other (p less than 0.05). The scale bar in b represents the Z-Score of each chemical compound in each sample.
Fig. 4
Fig. 4
Principal component analysis of the metabolic profile of D2O extracts of bee pollen samples from three different countries determined using NMR. Score plot and loading plot for PCA using the entire 1H NMR spectrum (a). Score plot and loading plot for OPLS-DA using the entire 1H NMR spectrum (b). Score plot and loading plot for PLS-DA using the entire 1H NMR spectrum (c). Score plot and loading plot for PCA using the 1H NMR spectrum excluding the sugar region (3.0–5.5 ppm) (d). Score plot and loading plot for OPLS-DA using the 1H NMR spectrum excluding the sugar region (3.0–5.5 ppm) (e). Score plot and loading plot for PLS-DA using the 1H NMR spectrum excluding the sugar region (3.0–5.5 ppm) (f). R2 measures the goodness of fit in the PCA and PLS-DA models. Rx2 and Ry2 measure the goodness of fit in the OPLS-DA models. Q2 indicates the predictive ability of the models.
Fig. 5
Fig. 5
Principal component analysis of the metabolic profile of CD3OD extracts of bee pollen samples from three different countries determined using NMR. Score plot and loading plot for PCA using information from the entire 1H NMR spectrum (a). Score plot and loading plot for OPLS-DA using information from the entire 1H NMR spectrum (b). Score plot and loading plot for PLS-DA using information from the entire 1H NMR spectrum (c). Score plot and loading plot for PCA using the low magnetic field region (5.5–9.5 ppm) of the 1H NMR spectrum (d). Score plot and loading plot for OPLS-DA using the low magnetic field region (5.5–9.5 ppm) of the 1H NMR spectrum (e). Score plot and loading plot for PLS-DA using the low magnetic field region (5.5–9.5 ppm) of the 1H NMR spectrum (f). R2 measures the goodness of fit in the PCA and PLS-DA models. Rx2 and Ry2 measure the goodness of fit in the OPLS-DA models. Q2 indicates the predictive ability of the models.
Fig. 6
Fig. 6
Overview of the chromatograms obtained by HPLC analysis for the 11 types of bee pollen. CH3OH extracts detected at 360 nm, 330 nm, and 285 nm. S, C and A on the vertical axis indicate that the axis corresponds to bee pollen samples from Spain, China, and Australia, respectively. In the top figure, the left vertical axis is for the eight bee pollen samples from Spain and China, and the right vertical axis is for the three bee pollen samples from Australia.
Fig. 7
Fig. 7
Principal component analysis of the flavonoid profile obtained by HPLC for the CH3OH extracts of bee pollen from three different countries. a: Score plot and loading plot for PCA using the absorbance at 360 nm. b: Score plot and loading plot for OPLS-DA using the absorbance at 360 nm. c: Score plot and loading plot for PLS-DA using the absorbance at 360 nm. d: Score plot and loading plot for PCA using the absorbance at 330 nm. e: Score plot and loading plot for OPLS-DA using the absorbance at 330 nm. f: Score plot and loading plot for PLS-DA using the absorbance at 330 nm. g: Score plot and loading plot for PCA using the absorbance at 285 nm. h: Score plot and loading plot for OPLS-DA using the absorbance at 285 nm. i: Score plot and loading plot for PLS-DA using the absorbance at 285 nm. R2 measures the goodness of fit in the PCA and PLS-DA models. Rx2 and Ry2 measure the goodness of fit in the OPLS-DA models. Q2 indicates the predictive ability of the models.

Similar articles

Cited by

References

    1. Almeida-Muradian L.B., Pamplona L.C., Coimbra S., Barth O.M. Chemical composition and botanical evaluation of dried bee pollen pellets. Journal of Food Composition and Analysis. 2005;18(1):105–111. doi: 10.1016/j.jfca.2003.10.008. - DOI
    1. Ares A.M., Valverde S., Bernal J.L., Nozal M.J., Bernal J. Extraction and determination of bioactive compounds from bee pollen. Journal of Pharmaceutical and Biomedical Analysis. 2018;147:110–124. doi: 10.1016/j.jpba.2017.08.009. - DOI - PubMed
    1. Campos M.G.R., Frigerio C., Lopes J., Bogdanov S. What is the future of Bee-Pollen? Journal of ApiProduct and ApiMedical Science. 2010;2(4):131–144. doi: 10.3896/ibra.4.02.4.01. - DOI
    1. Carlezon W.A., Mague S.D., Parow A.M., Stoll A.L., Cohen B.M., Renshaw P.F. Antidepressant-like effects of uridine and omega-3 fatty acids are potentiated by combined treatment in rats. Biological Psychiatry. 2005;57(4):343–350. doi: 10.1016/j.biopsych.2004.11.038. - DOI - PubMed
    1. Chong, J., Soufan, O., Li, C., Caraus, I., Li, S., Bourque, G., … Xia, J. (2018). MetaboAnalyst 4.0: Towards more transparent and integrative metabolomics analysis. Nucleic Acids Research, 46(W1), W486–W494. 10.1093/nar/gky310. - PMC - PubMed

LinkOut - more resources