. 2022 Jul 11;12(7):e9039.
doi: 10.1002/ece3.9039. eCollection 2022 Jul.

Different factors limit early- and late-season windows of opportunity for monarch development

Louie H Yang  1 Karen Swan  2 Eric Bastin  3 Jessica Aguilar  1 Meredith Cenzer  1 Andrew Codd  2 Natalie Gonzalez  1 Tracie Hayes  1 August Higgins  1 Xang Lor  2 Chido Macharaga  2 Marshall McMunn  1 Kenya Oto  1 Nicholas Winarto  1 Darren Wong  1 Tabatha Yang  1 Numan Afridi  2 Sarah Aguilar  1 Amelia Allison  3 Arden Ambrose-Winters  3 Edwin Amescua  2 Mattias Apse  2 Nancy Avoce  3 Kirstin Bastin  3 Emily Bolander  3 Jessica Burroughs  2 Cristian Cabrera  2 Madeline Candy  2 Ariana Cavett  2 Melina Cavett  2 Lemuel Chang  3 Miles Claret  1 Delaney Coleman  3 Jacob Concha  2 Paxson Danzer  3 Joe DaRosa  1 Audrey Dufresne  3 Claire Duisenberg  3 Allyson Earl  1 Emily Eckey  3 Maddie English  3 Alexander Espejo  2 Erika Faith  3 Amy Fang  3 Alejandro Gamez  2 Jackelin Garcini  2 Julie Garcini  2 Giancarlo Gilbert-Igelsrud  3 Kelly Goedde-Matthews  3 Sarah Grahn  3 Paloma Guerra  2 Vanessa Guerra  2 Madison Hagedorn  3 Katie Hall  3 Griffin Hall  1 Jake Hammond  3 Cody Hargadon  3 Victoria Henley  3 Sarah Hinesley  3 Celeste Jacobs  3 Camille Johnson  3 Tattiana Johnson  2 Zachary Johnson  3 Emma Juchau  2 Celeste Kaplan  3 Andrew Katznelson  1 Ronja Keeley  3 Tatum Kubik  3 Theodore Lam  3 Chalinee Lansing  2 Andrea Lara  2 Vivian Le  1 Breana Lee  3 Kyra Lee  3 Maddy Lemmo  3 Scott Lucio  3 Angela Luo  3 Salman Malakzay  2 Luke Mangney  3 Joseph Martin  2 Wade Matern  3 Byron McConnell  3 Maya McHale  3 Giulia McIsaac  3 Carolanne McLennan  3 Stephanie Milbrodt  3 Mohammed Mohammed  2 Morgan Mooney-McCarthy  3 Laura Morgan  1 Clare Mullin  3 Sarah Needles  3 Kayla Nunes  3 Fiona O'Keeffe  3 Olivia O'Keeffe  3 Geoffrey Osgood  1 Jessica Padilla  2 Sabina Padilla  3 Isabella Palacio  3 Verio Panelli  2 Kendal Paulson  3 Jace Pearson  2 Tate Perez  3 Brenda Phrakonekham  2 Iason Pitsillides  3 Alex Preisler  3 Nicholas Preisler  3 Hailey Ramirez  2 Sylvan Ransom  2 Camille Renaud  3 Tracy Rocha  3 Haley Saris  2 Ryan Schemrich  1 Lyla Schoenig  3 Sophia Sears  3 Anand Sharma  2 Jessica Siu  3 Maddie Spangler  3 Shaili Standefer  3 Kelly Strickland  3 Makaila Stritzel  3 Emily Talbert  3 Sage Taylor  3 Emma Thomsen  3 Katrina Toups  3 Kyle Tran  3 Hong Tran  1 Maraia Tuqiri  2 Sara Valdes  3 George VanVorhis  3 Sandy Vue  2 Shauna Wallace  3 Johnna Whipple  2 Paja Yang  2 Meg Ye  3 David Yo  3 Yichao Zeng  1
Affiliations

Different factors limit early- and late-season windows of opportunity for monarch development

Louie H Yang et al. Ecol Evol. .

Abstract

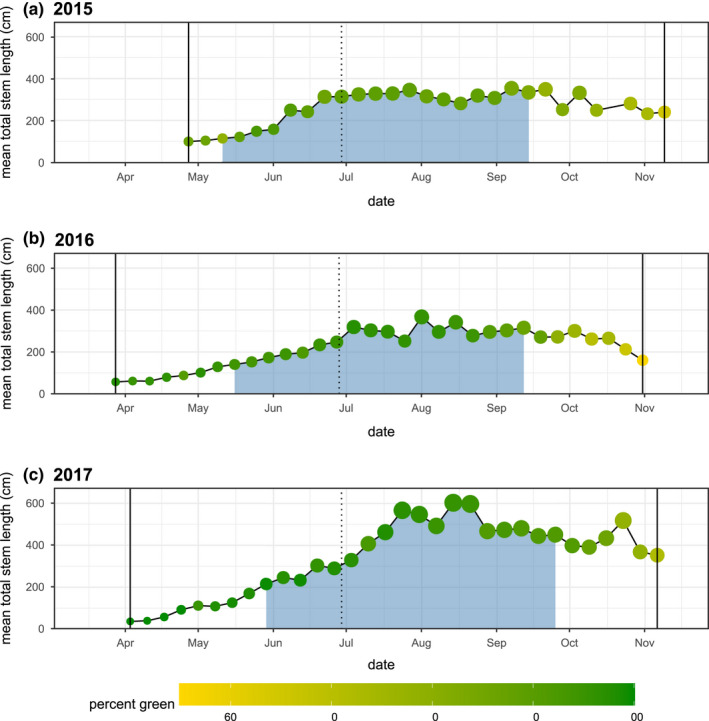
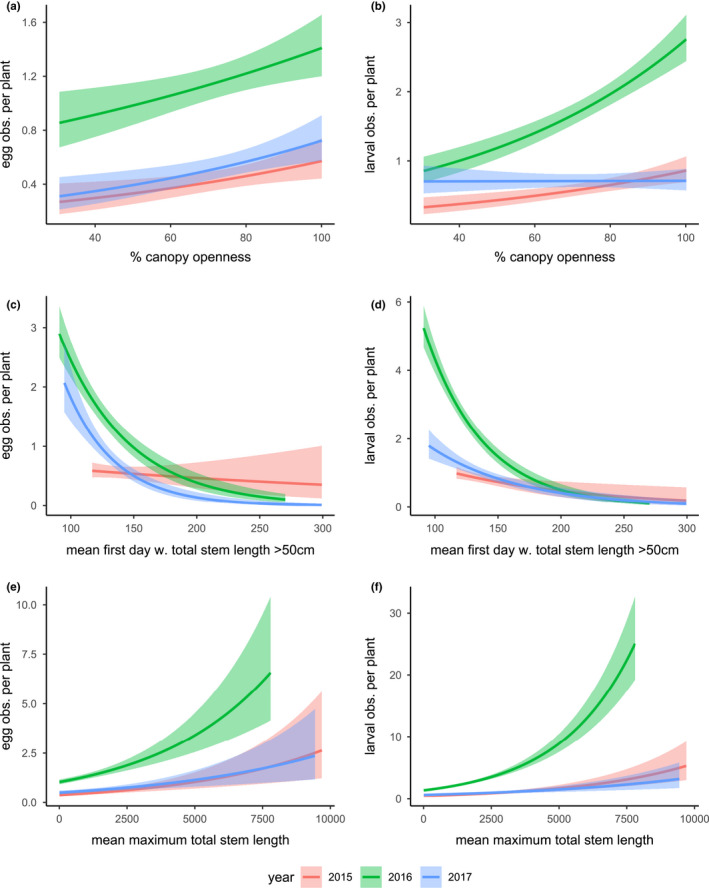
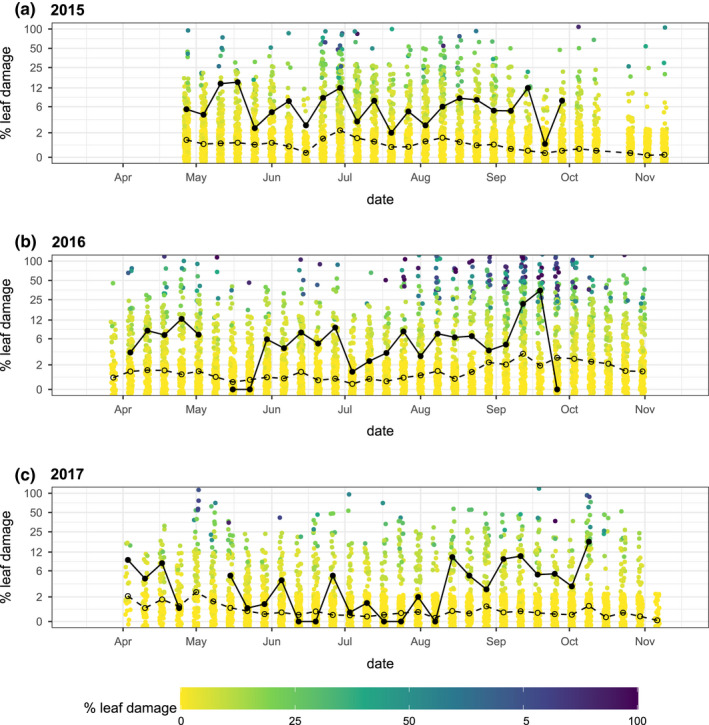
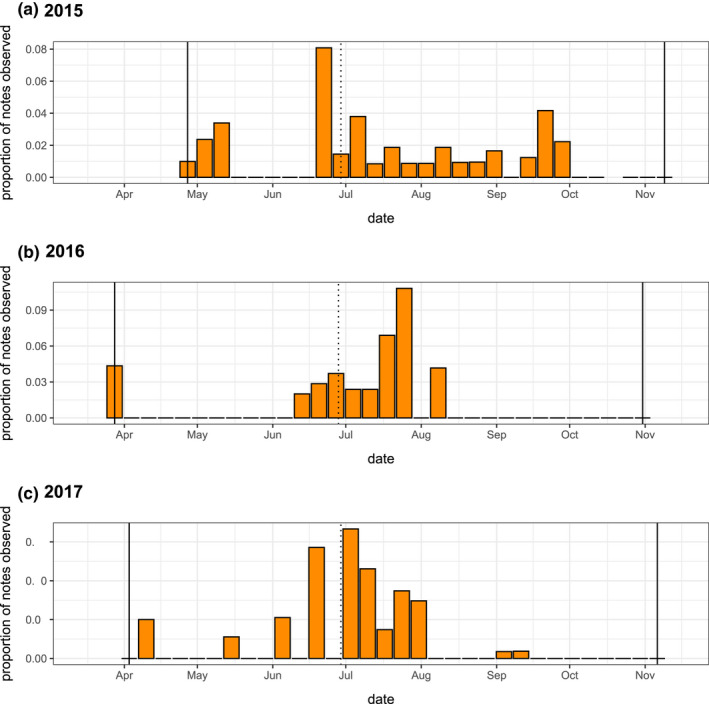
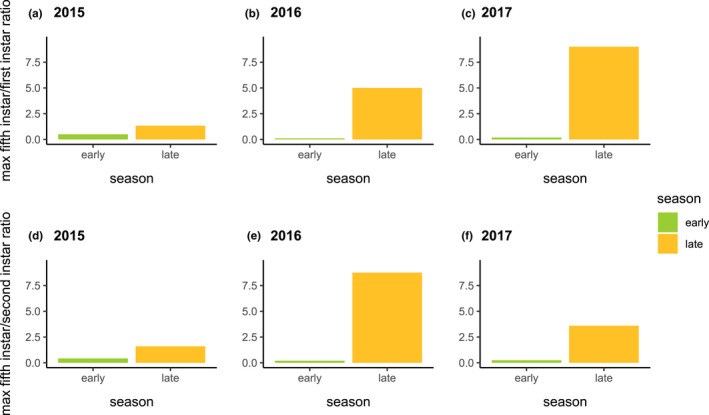
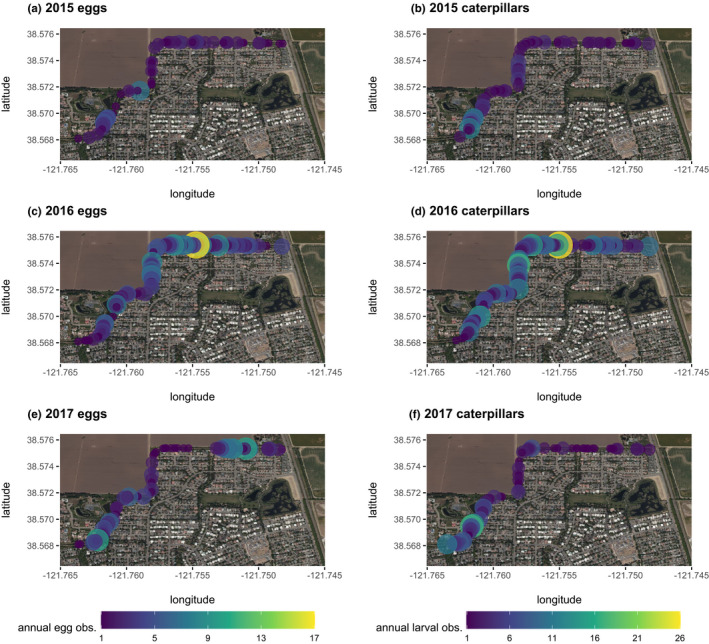
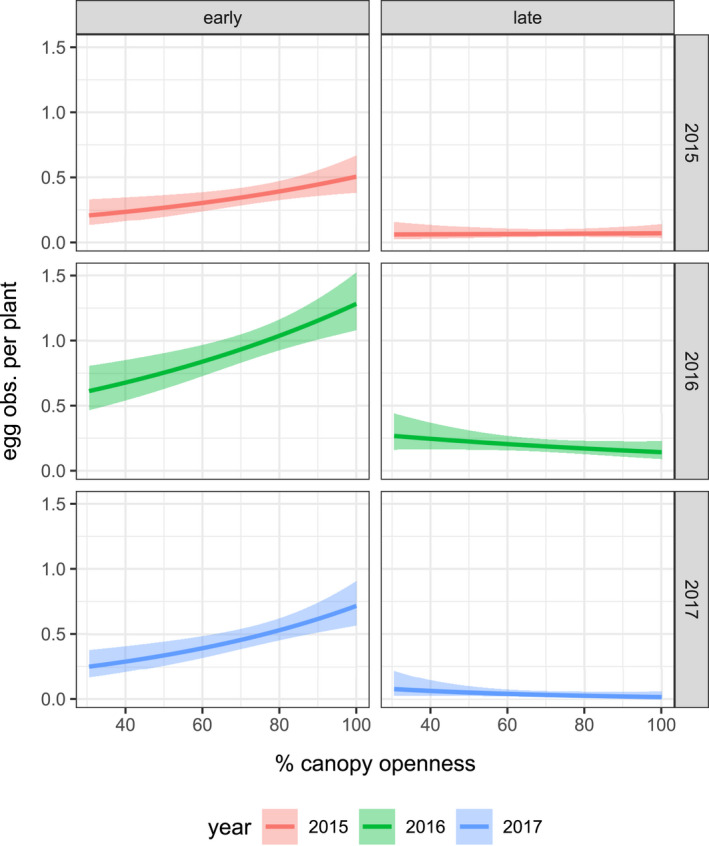
Seasonal windows of opportunity are intervals within a year that provide improved prospects for growth, survival, or reproduction. However, few studies have sufficient temporal resolution to examine how multiple factors combine to constrain the seasonal timing and extent of developmental opportunities. Here, we document seasonal changes in milkweed (Asclepias fascicularis)-monarch (Danaus plexippus) interactions with high resolution throughout the last three breeding seasons prior to a precipitous single-year decline in the western monarch population. Our results show early- and late-season windows of opportunity for monarch recruitment that were constrained by different combinations of factors. Early-season windows of opportunity were characterized by high egg densities and low survival on a select subset of host plants, consistent with the hypothesis that early-spring migrant female monarchs select earlier-emerging plants to balance a seasonal trade-off between increasing host plant quantity and decreasing host plant quality. Late-season windows of opportunity were coincident with the initiation of host plant senescence, and caterpillar success was negatively correlated with heatwave exposure, consistent with the hypothesis that late-season windows were constrained by plant defense traits and thermal stress. Throughout this study, climatic and microclimatic variations played a foundational role in the timing and success of monarch developmental windows by affecting bottom-up, top-down, and abiotic limitations. More exposed microclimates were associated with higher developmental success during cooler conditions, and more shaded microclimates were associated with higher developmental success during warmer conditions, suggesting that habitat heterogeneity could buffer the effects of climatic variation. Together, these findings show an important dimension of seasonal change in milkweed-monarch interactions and illustrate how different biotic and abiotic factors can limit the developmental success of monarchs across the breeding season. These results also suggest the potential for seasonal sequences of favorable or unfavorable conditions across the breeding range to strongly affect monarch population dynamics.

Keywords: Asclepias; Danaus plexippus; ecological crunch; heatwaves; monarch–milkweed interactions; phenological mismatch; phenology‐ontogeny landscape; reproductive window of opportunity; seasonal fitness landscape; seasonal host plant limitation; seasonal window of opportunity; sequential hypotheses.


Conflict of interest statement

The authors' contributions are described according to ANSI/NISO standard Contributor Roles Taxonomy (CRediT) in the Supporting Information. The authors declare that they have no conflicts of interest.

Figures

FIGURE 1
FIGURE 1
(a) Developmental degree‐days and (b) thermal stress degree‐minutes for the early (days 90–180) and late (days 180–270) growing seasons in 2015–2017. Although each year showed similar thermal accumulation across the developmentally relevant temperatures, exposure to stressful high temperatures was higher in 2017 than in 2016 or 2015
FIGURE 2
FIGURE 2
Mean milkweed total stem length and percent green at weekly intervals across three growing seasons. Point size and the vertical axis indicate the weekly mean plant size, and point color indicates the weekly mean percent green. The blue region represents a period of increased host plant availability for monarch development bounded by the mean date when plants exceeded 75 cm total stem length on the left and the mean date when percent green was declined below 80% on the right. Solid vertical lines indicate the start and end of observations at each season. The dotted vertical line represents day 180, which is used to separate the early and late season in these analyses.
FIGURE 3
FIGURE 3
Effects of canopy openness on (a) the phenology of milkweed emergence, (b) the timing of milkweed growth, (c) maximum total stem length and (d) timing of senescence. Canopy openness was generally associated with earlier milkweed emergence, earlier growth to a viable host plant size, and larger maximum milkweed sizes across the season
FIGURE 4
FIGURE 4
Monarch observation density per milkweed host plant across three growing seasons. Colors indicate egg or larval instar. Solid black vertical lines indicate the start and end of observations each season. The dotted vertical line represents day 180, which is used to separate the early and late season. Solid red vertical lines indicate periods when the temperature exceeded 38°C
FIGURE 5
FIGURE 5
(a) Monarch egg and (b) caterpillar observations per emerged plant in the early (before day 180) and late (after and including day 180) season each year. (c) The ratios of maximum weekly observed counts of fifth instar caterpillars relative to eggs in the early and late growing season likely reflect relative rates of survival to pupation in the early and late season each year
FIGURE 6
FIGURE 6
Points indicate the log ratio of the mean total stem length of milkweeds with monarch egg observations versus milkweeds without monarch egg observations for all weeks with monarch egg observations; positive values indicate apparent preference for comparatively larger plants, while negative values indicate an apparent preference for comparatively smaller plants. The blue line represents a locally estimated (LOESS) scatterplot smoothing fit. Stars indicate significant deviations from zero using a Fisher–Pitman permutation test (***p = 0 to .001; **.001–.01; *.01–.05)
FIGURE 7
FIGURE 7
The effects of (a, b) canopy openness, (c, d) the timing of milkweed growth, and (e, f) maximum total stem length on the density of monarch egg (a, c, e) and caterpillar (b, d, e) observations per plant. Plants with more open canopies, earlier growth phenologies, and larger maximum sizes were generally associated with more monarch observations (but see Discussion). Shaded area around each fitted line indicates the 95% confidence interval
FIGURE 8
FIGURE 8
Weekly mean percent leaf damage in (a) 2015, (b) 2016, and (c) 2017. The open points and dashed line indicate the weekly mean percent leaf damage; the filled points and solid lines indicate the weekly mean percent leaf damage on plants where caterpillars were observed
FIGURE 9
FIGURE 9
The modeled effects of canopy openness on the proportion of notes with (a) predatory taxa present and (b) herbivorous taxa present, although both predators and herbivores were more commonly observed on host plants with greater canopy openness. Among the 3 years of this study, predators were least commonly observed, and herbivores were most commonly observed in 2017. Shaded area around each fitted line indicates the 95% confidence interval
FIGURE 10
FIGURE 10
Comparison of standardized effect sizes for early‐ and late‐season GLMs of (a) egg and (b) caterpillar observation counts. Effect sizes are standardized by 1 SD, and lines represent the 95% confidence interval
FIGURE A1
FIGURE A1
Seasonal water depth in the North Davis irrigation channel. This channel conveys agricultural irrigation and storm runoff water and shows a pattern of increased flows in the summer months when irrigation activity is greatest and intermittent flood events from natural precipitation events in the winter. The thick blue line represents a locally estimated scatterplot smoothing (LOESS) moving regression fit
FIGURE A2
FIGURE A2
(a) Temperature and (b) precipitation in Davis, CA, USA during the study period. (a) The daily temperature minima and maxima are shown in green and orange, respectively. Days with temperature maxima ≥38°C are indicated with red points. Days with temperatures exceeding 42°C are indicated by a red ×. (b) Daily precipitation and cumulative annual precipitation. Cumulative annual precipitation is calculated between July 1 and June 30 of the succeeding year. (c) Percent of land area in CA, USA under each US Drought Monitor classification of drought severity
FIGURE A3
FIGURE A3
The accumulation of thermal degree days for narrow‐leaved milkweed, based on a developmental baseline of 11.5°C (unpublished data), and estimated during the period from day 1 to day 163, when 75% of plants exceeded a total stem length of 50 cm. The cooler, wetter winter preceding the 2017 growing season resulted in 15% less thermal accumulation than in each of the two preceding years
FIGURE A4
FIGURE A4
Subhourly temperature measurements in (a) 2015, (b) 2016, and (c) 2017. The colored line indicates the temperature at approximately 20‐min intervals. The white line indicates the 10‐day rolling mean, and observations >38°C are marked with a red point. Observations with temperatures exceeding 42°C are indicated by a red ×
FIGURE A5
FIGURE A5
Distribution of total stem lengths at weekly time slices through (a) 2015, (b) 2016, and (c) 2017. Colors represent quartiles. Across all years, seasonal changes in the median plant size correspond with larger increases in the upper quartiles in the late season. In the post‐drought 2017 seasons, increases in the median plant size were associated with broader plant size distributions. Note that these three panels share a common vertical axis but are scaled to the observation period of each year on the horizontal axis
FIGURE A6
FIGURE A6
Cumulative distribution of milkweed emergence dates in 2015, 2016, and 2017. Accounting for the later start of the observation period in 2015, the emergence phenology was likely similar in 2015 and 2016, while 2017 shows a flatter, delayed phenology
FIGURE A7
FIGURE A7
Correlation in 2016 and 2017 ranked milkweed phenologies measured as the first day each year when a plant’s total stem length exceeded 50 cm. The significant correlation (r = .59, p < .0001) suggests that the relative phenology of milkweed plants was consistent between these two years; early plants tended to be early in both years. Early plants also tended to be larger (indicated with point size) and generally supported more larval monarch observations (indicated with point color) than later growing, smaller plants
FIGURE A8
FIGURE A8
Weekly mean total cross‐sectional stem areas across (a) 2015, (b) 2016, and (c) 2017. Color is scaled within each year to emphasize the timing and duration of the highest stem areas within each year. Color is mapped to total cross‐sectional stem area and rescaled within each year to emphasize the seasonal peak of each year
FIGURE A9
FIGURE A9
Phenology of milkweed flowering (weekly mean umbel count per plant) and seed production (weekly mean seed pod count per plant) in (a) 2015, (b) 2016, and (c) 2017. Milkweed reproductive phenology was delayed in 2017 compared with 2015 and 2016. Solid red vertical lines indicate periods when the temperature exceeded 38°C
FIGURE A10
FIGURE A10
Monarch observation density per cm of milkweed stem length across three growing seasons. Normalizing by plant size allows visualization of potential early season milkweed limitation. Solid black vertical lines indicate the start and end of observations each season. The dotted vertical line represents day 180, which is used to separate the early and late season in these analyses. Solid red vertical lines indicate periods when the temperature exceeded 38°C
FIGURE A11
FIGURE A11
Seasonal patterns of adult monarch observations in (a) 2015, (b) 2016, and (c) 2017
FIGURE A12
FIGURE A12
Early versus late season differences in the observation ratios of fifth instar caterpillars relative to first and second instar caterpillars are consistent with those seen with eggs (Figure 5)
FIGURE A13
FIGURE A13
Histograms of (a) egg and (b) caterpillar densities per plant, excluding observation where eggs and caterpillars were absent
FIGURE A14
FIGURE A14
The cumulative spatial distribution of monarch egg and caterpillar observations across the study site. Points indicate the location of milkweed plants with monarch egg and caterpillar observations; size and color correspond with the annual total number of monarch observations per plant
FIGURE A15
FIGURE A15
The spatial distribution of canopy openness across the study site. Points indicate the location of milkweed plants; size and color correspond with measurements of percent canopy openness above each plant
FIGURE A16
FIGURE A16
The effects of canopy openness on monarch egg densities in the early and season of each year. These analyses indicate significant positive effects in each early season, but in no significant effects in each of the late seasons. Shaded area around each fitted line indicates the 95% confidence interval
FIGURE A17
FIGURE A17
The effects of canopy openness on monarch caterpillar densities in the early and season of each year. These analyses show relatively weak and inconsistent effects in the early season of each year, followed by positive effects in the late season of each year. Shaded area around each fitted line indicates the 95% confidence interval
FIGURE A18
FIGURE A18
While most plants were not observed with monarchs and did not show leaf damage, milkweed plants with more larval observations per plant each year tended to have higher maximum observed leaf damage measures. Color represents the proportional density of points per hexagonal bin
FIGURE A19
FIGURE A19
The proportion of notes that included predaceous taxa in (a) 2015, (b) 2016, and (c) 2017. Solid vertical lines indicate the start and end of observations each season. The dotted vertical line represents day 180, which is used to separate the early and late season in these analyses
FIGURE A20
FIGURE A20
The proportion of notes that included herbivorous taxa across three seasons: (a) 2015, (b) 2016, and (c) 2017. Solid vertical lines indicate the start and end of observations each season. The dotted vertical line represents day 180, which is used to separate the early and late season in these analyses

References

    1. Abramoff, M. D. , Magelhaes, P. J. , & Ram, S. J. (2004). Image processing with ImageJ. Biophotonics International, 11, 36–42.
    1. Ali, J. G. , & Agrawal, A. A. (2014). Asymmetry of plant‐mediated interactions between specialist aphids and caterpillars on two milkweeds. Functional Ecology, 28, 1404–1412.
    1. Altizer, S. M. , & Oberhauser, K. S. (1999). Effects of the protozoan parasite Ophryocystis elektroscirrha on the fitness of monarch butterflies (Danaus plexippus). Journal of Invertebrate Pathology, 74, 76–88. - PubMed
    1. Bale, J. S. , Masters, G. J. , Hodkinson, I. D. , Awmack, C. , Bezemer, T. M. , Brown, V. K. , Butterfield, J. , Buse, A. , Coulson, J. C. , Farrar, J. , Good, J. E. G. , Harrington, R. , Hartley, S. , Jones, T. H. , Lindroth, R. L. , Press, M. C. , Symrnioudis, I. , Watt, A. D. , & Whittaker, J. B. (2002). Herbivory in global climate change research: Direct effects of rising temperature on insect herbivores. Global Change Biology, 8, 1–16.
    1. Barker, J. F. , & Herman, W. S. (1976). Effect of photoperiod and temperature on reproduction of the monarch butterfly, Danaus plexippus. Journal of Insect Physiology, 22, 1565–1568. - PubMed