. 2021 Aug;126(8):e2021JE006859.
doi: 10.1029/2021JE006859. Epub 2021 Aug 12.

Soil Thermophysical Properties Near the InSight Lander Derived From 50 Sols of Radiometer Measurements

Affiliations

Soil Thermophysical Properties Near the InSight Lander Derived From 50 Sols of Radiometer Measurements

Sylvain Piqueux et al. J Geophys Res Planets. 2021 Aug.

Abstract

Measurements from the InSight lander radiometer acquired after landing are used to characterize the thermophysical properties of the Martian soil in Homestead hollow. This data set is unique as it stems from a high measurement cadence fixed platform studying a simple well-characterized surface, and it benefits from the environmental characterization provided by other instruments. We focus on observations acquired before the arrival of a regional dust storm (near Sol 50), on the furthest observed patch of soil (i.e., ∼3.5 m away from the edge of the lander deck) where temperatures are least impacted by the presence of the lander and where the soil has been least disrupted during landing. Diurnal temperature cycles are fit using a homogenous soil configuration with a thermal inertia of 183 ± 25 J m-2 K-1 s-1/2 and an albedo of 0.16, corresponding to very fine to fine sand with the vast majority of particles smaller than 140 μm. A pre-landing assessment leveraging orbital thermal infrared data is consistent with these results, but our analysis of the full diurnal temperature cycle acquired from the ground further indicates that near surface layers with different thermophysical properties must be thin (i.e., typically within the top few mm) and deep layering with different thermophysical properties must be at least below ∼4 cm. The low thermal inertia value indicates limited soil cementation within the upper one or two skin depths (i.e., ∼4-8 cm and more), with cement volumes <<1%, which is challenging to reconcile with visible images of overhangs in pits.

Keywords: InSight; Mars; duricrust; soil; temperature; thermophysics.


Figures

Figure 1
Figure 1
(a) THEMIS‐derived regional thermal inertia map centered on the InSight landing site (star, 4.5°N, 135.6°E) overlain on a CTX mosaic, modified from Golombek et al. (2017). (b) HiRISE image ESP_036761_1845, the star indicates the position of the lander. (c) Topographic map of Homestead hollow (modified from Golombek, Warner, et al., , see their Figure S5 for details). Dashed circle is Homestead hollow, Rocky field is a rougher and rockier section in the western portion of the hollow, and Corintito is a nearby Corinto secondary crater.
Figure 2
Figure 2
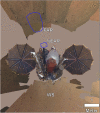
Position of the far (FAR) and near (NEAR) radiometers (RAD) spots relative to the lander, together with the workspace (WS) where instruments have been deployed (Golombek, Williams, et al., 2020). North is up. Sol 10 image D_LRGB_0010_CPG 040010RR_S__RAD_5MMM1 of the far rad spot, sol 10 deck mosaic (tie‐pointed for approximate location and scale, but not orthorectified, explaining internal distortions), sol 14 workspace mosaic, and orthomosaic D_LRGBI0160XILT030100ORRAS__5MM_ 35MM1 encompassing several sols of image data. Approximate resolution of 5 mm/pixel near the lander.
Figure 3
Figure 3
(a) Projected Instrument Deployment Camera (IDC) image (D_LRGB_0010_CPG040010ORR_S__RAD_5MMM1) in equi‐rectangular projection centered on lander deck robotic arm, with a spatial resolution of 5 mm per pixel. North is up. White box shows the surface covered by the radiometer monitoring. (b) Elevation model on the same area acquired by stereo IDC images. The elevation corresponds to the vertical height relative to the lander deck, negative downwards with an accuracy of 1 cm. The interval of contour lines (black line) is 5 cm, showing that the surface is slightly tilted toward ESE. The clast, greater than 1 cm, are mapped in blue within the radiometer area.
Figure 4
Figure 4
(a) Subset of image D000M0118_607019065EDR_F0000_0250M4 showing one of the circular feet (80 mm across) of the HP3 support structure displaced after a series of mole hammering attempt. This image suggests a loose top layer at least ∼1 cm in thickness. (b) Subset of image D000M0577_647739954EDR_F0000_0930M showing the partially buried mole (2.7 cm diameter) in its pit (on the left). The steep walls in the mole pit and overhang are indicative of a cohesive soil and suggestive of cementation over a thickness at least comparable to a diurnal skin depth (i.e., ∼4 cm). Imagery under the lander further indicates that the cohesive layer is at least 10 cm in thickness (Golombek, Warner, et al., 2020). The overhang is a strong indicator for the presence of a duricrust.
Figure 5
Figure 5
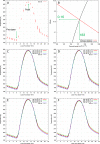
Graphical example of diurnal temperature fit procedure (a, b), and examples of diurnal fits (c–f). (a) Sol 35, shown for its representative diurnal data distribution and median thermal inertia. Bars indicate unbinned temperature observations, predawn (187.3 K at 5.92 LTST, “pre‐dawn”) and peak daytime surface (286.9 K at 12.92 LTST, “peak”) temperatures selected for the fit (see text) (τ = 0.79; (b) Model‐generated albedo and thermal inertia solutions for the pre‐dawn and peak temperatures, with a unique solution (albedo of 0.16 and a thermal inertia of 183 J m−2 K−1s−1/2) matching both the selected pre‐dawn (black) and peak (red) temperatures. (c) These steps are repeated to fit the minimum and maximum thermal inertia curves within the reported errors bars: binned observations (24 per sol) and best, high, and low thermal inertia model fits within reported error bars, that is, 163, 183, 203 J m−2 K−1 s−1/2 respectively, yielding RMS of 1.5, 0.4, and 1. 7 K, respectively. (d) Sol 37, worst fit (RMS of 1.0 K) of any Sol analyzed yielding 192 J m−2 K−1 s−1/2 (172 and 214 J m−2 K−1 s−1/2 upper and lower bound). This case illustrates the limit of using a single predawn observation, as the selected ∼6 LTST point may not be representative of the night cooling trend, and the absence of ∼Noon observation limits the leverage to constrain the thermal inertia. Note in this unique pathological case that the lower inertia case yields an RMS of 0.9 K (vs. 2.4 K for the high inertia case) (τ=0.82; (e) Sol 39, example of excellent fit (RMS of 0.5 K, 1.0 and 1.1 K for the bounding cases) and thermal inertia curves for 167, 187, 208 J m−2 K−1 s−1/2. The absence of late afternoon data is not detrimental to the retrieval approach (τ = 0.87; (f) Sol 44, good fit (RMS of 0.4 K, vs. 1.0 and 0.9 K for the bounding cases), but highest retrieved thermal inertia values (i.e., 192, 213, 235 J m−2 K−1 s−1/2 negatively impacted by the high dust opacity and poor modeling performance under dusty conditions) τ = 0.95.
Figure 6
Figure 6
Thermometric albedo versus thermal inertia scattergram. Thermal inertia error bars evaluation is discussed in the text. Albedo error bars arbitrarily set to 1 σ (i.e., 0.008).
Figure 7
Figure 7
(a) Schematics of the thermal model configuration and nomenclature. (b–d) RMS between observed temperatures on sol 35 (see Figures 5 and 6) and a modeled layered soil with varying top layer thickness (Y axis, d top), top layer thermal inertial (X axis, TItop), and bottom layer thermal inertia TIbot. (b) TIbot = 180 J m−2 K−1 s−1/2; (c) TIbot = 190 J m−2 K−1 s−1/2; (d) TIbot = 200 J m−2 K−1 s−1/2. Horizonal dashed lines at d top = 1 cm provides a marker consistent with the observation of loose material at the surface (see Figure 4a). Approximate equivalence between thermal inertia and grain sizes given under (c), assuming no cementation.

References

    1. Arvidson, R. E. , Anderson, R. C. , Bartlett, P. , Bell, J. F. , Christensen, P. R. , Chu, P. , et al. (2004). Localization and physical properties experiments conducted by Opportunity at Meridiani Planum. Science, 306, 1730–1733. 10.1126/science.1104211 - DOI - PubMed
    1. Arvidson, R. E. , Anderson, R. C. , Bartlett, P. , Bell, J. F., III , Balney, D. , Chistensensen, P. R. , et al. (2004). Localization and physical properties experiments conducted by Spirit at Gusev Crater. Science, 305, 821–824. 10.1126/science.1099922 - DOI - PubMed
    1. Arvidson, R. E. , Guinness, E. A. , Dale‐Bannister, M. A. , Adams, J. , Smith, M. , Christensen, P. R. , & Singer, R. B. (1989). Nature and distribution of surficial deposits in Chryse Planitia and vicinity, Mars. Journal of Geophysical Research, 94, 1573–1587. 10.1029/jb094ib02p01573 - DOI
    1. Arvidson, R. E. , Squyres, S. W. , Anderson, R. C. , Bell, J. F. , Blaney, D. , Brückner, J. , et al. (2006). Overview of the spirit mars exploration rover mission to Gusev Crater: Landing site to Backstay Rock in the Columbia Hills. Journal of Geophysical Research, 111, E02S01. 10.1029/2005JE002499 - DOI
    1. Banerdt, W. B. , Smrekar, S. E. , Banfield, D. , Giardini, D. , Golombek, M. , Johnson, C. L. , et al. (2020). Initial results from the InSight mission on Mars. Nature Geoscience, 14, 183–189. 10.1038/s41561-020-0544-y - DOI

LinkOut - more resources