

Analysis of the Application Value of Ultrasound Three-Dimensional Speckle Tracking Technology Combined with Thyroid Autoantibodies and Hormones in the Diagnosis and Treatment of Graves' Disease
- PMID: 35845595
- PMCID: PMC9279017
- DOI: 10.1155/2022/7774283
Analysis of the Application Value of Ultrasound Three-Dimensional Speckle Tracking Technology Combined with Thyroid Autoantibodies and Hormones in the Diagnosis and Treatment of Graves' Disease
Retraction in
-
Retracted: Analysis of the Application Value of Ultrasound Three-Dimensional Speckle Tracking Technology Combined with Thyroid Autoantibodies and Hormones in the Diagnosis and Treatment of Graves' Disease.Evid Based Complement Alternat Med. 2023 Jun 21;2023:9805962. doi: 10.1155/2023/9805962. eCollection 2023. Evid Based Complement Alternat Med. 2023. PMID: 37388034 Free PMC article.
Abstract
Objective: The aim of the study is to evaluate the application value of three-dimensional speckle tracking imaging (3D-STI) and combined detection of thyroid autoantibodies and hormones in the diagnosis and treatment of Graves' disease.
Methods: A total of 60 patients with Graves' disease enrolled in our hospital from February 2020 to February 2021 were included in the experimental group, and 60 healthy patients after a physical examination during the same period were selected as the control group. No intervention was performed on the control group, and the experimental group received conventional Graves' disease treatment. The levels of thyroid autoantibodies and hormones in the two groups before and after the treatment were measured, and the 3D-STI was performed to compare the 3D-STI strain parameters of the research objects.
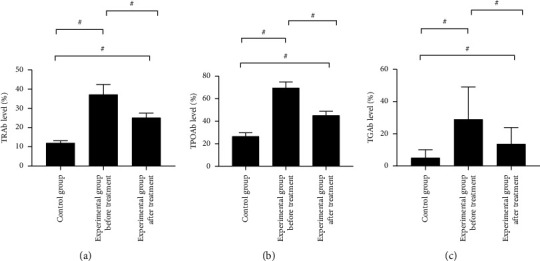
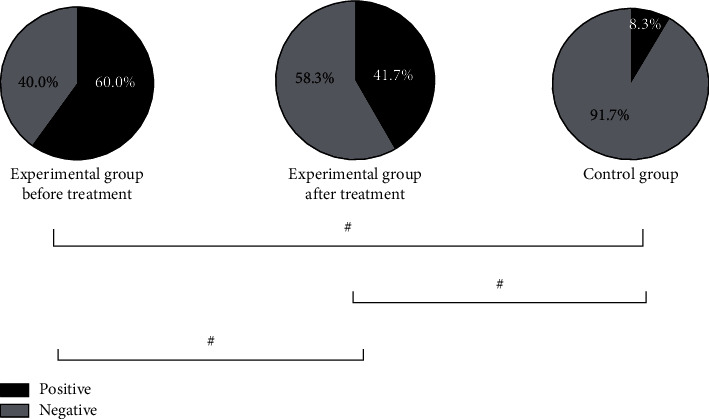
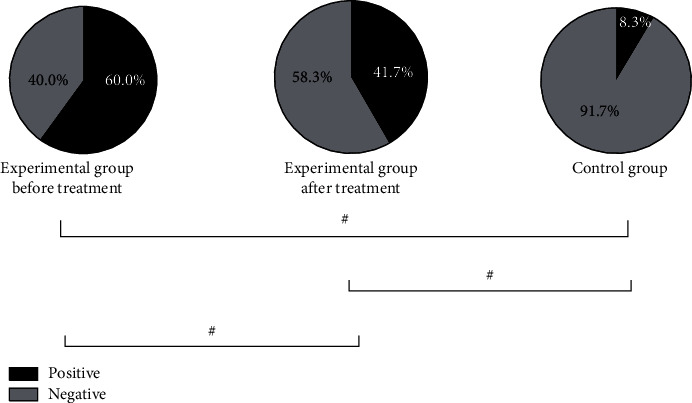
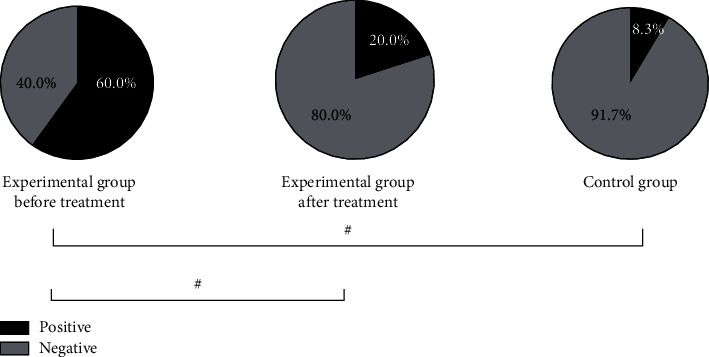
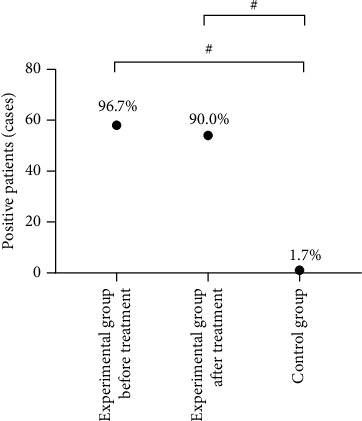
Results: A significantly higher level of thyroid autoantibodies in the experimental group than that in the control group before and after the treatment was found (P < 0.001), with a remarkable decline observed after the treatment (P < 0.001). The positive rate of thyroid autoantibodies in the experimental group before the treatment was significantly higher than that in the control group (P < 0.05). After the treatment, the positive rate of TRAb and TPOAb was higher than that of the control group (P < 0.05), and the positive rate of TPOAb was higher than before the treatment. The two groups showed no significant difference in the positive rate of TGAb (P > 0.05). Significant differences were observed in the thyroid hormone levels between the two groups and also between before and after the treatment (P < 0.001). The experimental group garnered significantly higher 3D-STI strain parameters than the control group before the treatment (P < 0.05); after the treatment, the hyperthyroidism of the patients was relieved with a decreased 3D-STI value, but it was still notably higher than the control group (P < 0.05). Remarkably higher positive rates of combined detection before and after the treatment in the experimental group than those in the control group were obtained (P < 0.05).
Conclusion: The combined detection of 3D-STI and thyroid autoantibodies and hormones ensures a better detection rate of Graves' disease and monitors the treatment effect of patients in real time, which provides a basis for clinical diagnosis and treatment and merits clinical promotion and application.
Copyright © 2022 Yi Xu et al.
Conflict of interest statement
The authors declare that they have no conflicts of interest.
Figures
References
-
- Imai T., Ohsima J., Hasegawa Y. Diagnosis of Graves’ disease by cerebral venous thrombosis: a case report. Clinical Neurology . 2018;58 - PubMed
-
- Avillion A. E. Chapter Disorders of the Endocrine System: Anatomy, Physiology, and Current Treatment Initiatives . Silver Spring, ML, USA: American Nurses Credentialing Center; 2016.
-
- Tatulashvili S., Baudry C., Sadoul J. L., Bihan H. New perspectives for the diagnosis and prognosis of Graves’ disease. Annales d’Endocrinologie . 2018;79:S31–S39. - PubMed
Publication types
LinkOut - more resources
Full Text Sources
