

Comparative Transcriptome and Metabolome Analysis of Resistant and Susceptible Piper Species Upon Infection by the Oomycete Phytophthora Capsici
- PMID: 35845707
- PMCID: PMC9278165
- DOI: 10.3389/fpls.2022.864927
Comparative Transcriptome and Metabolome Analysis of Resistant and Susceptible Piper Species Upon Infection by the Oomycete Phytophthora Capsici
Abstract
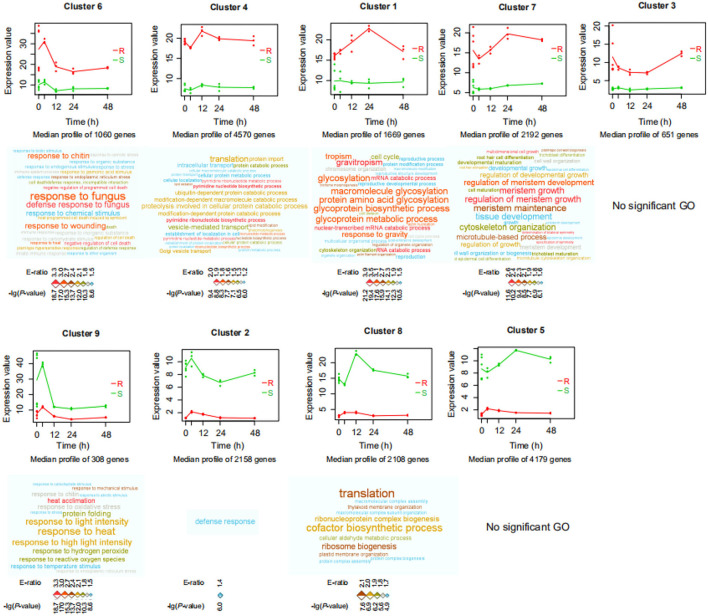
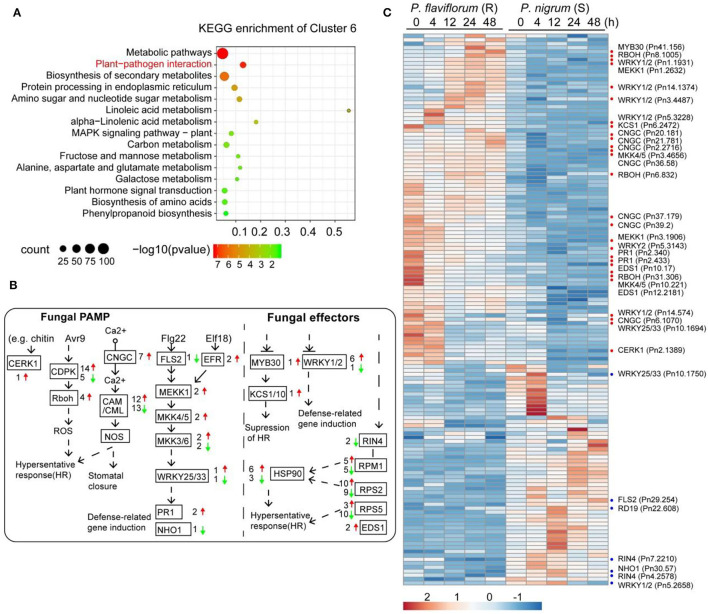
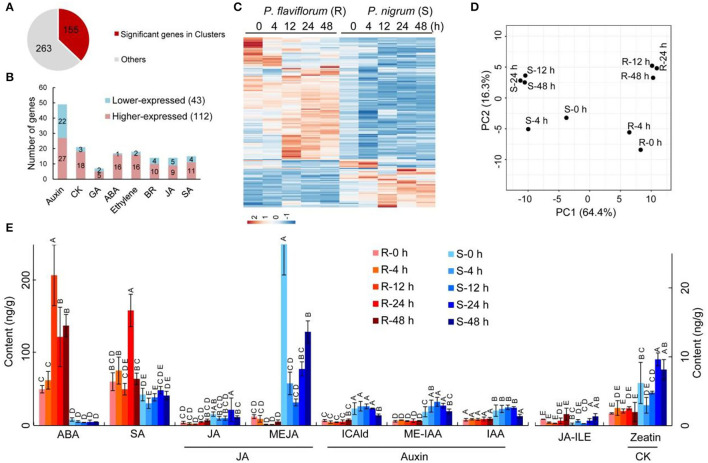
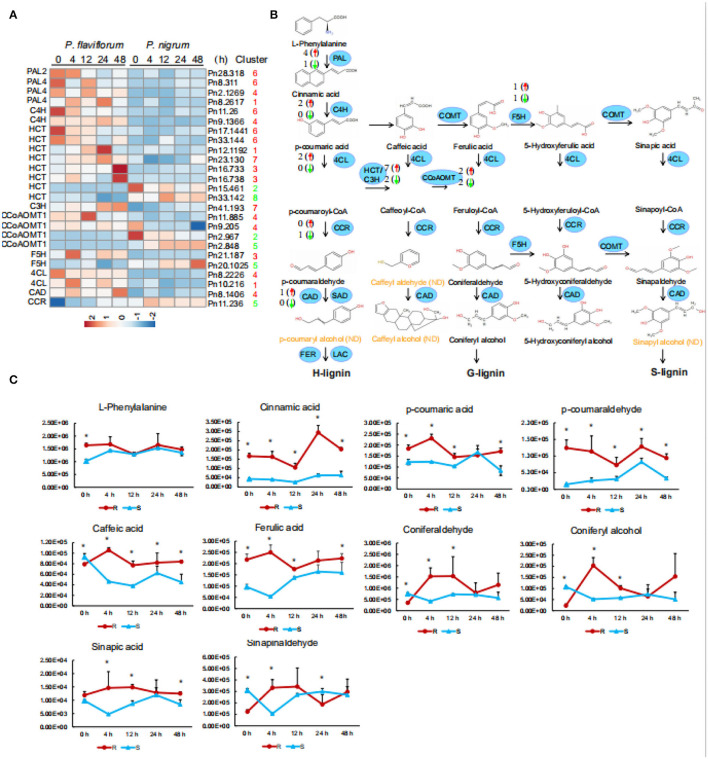
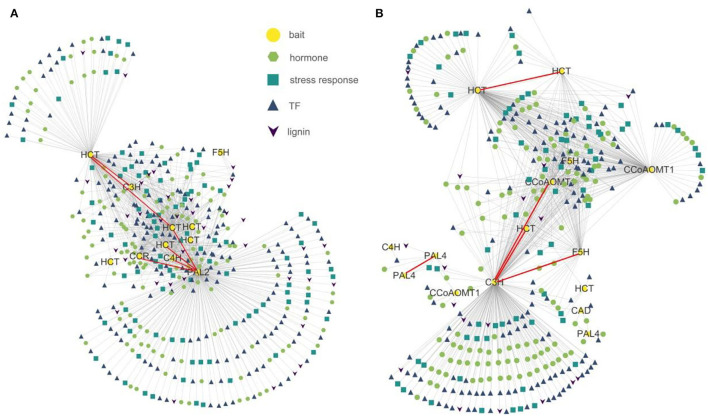
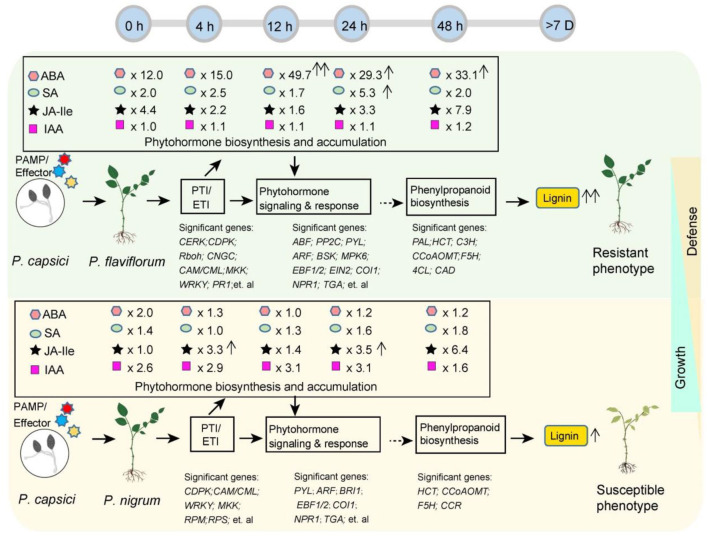
Phytophthora capsici is a destructive oomycete pathogen that causes devastating disease in black pepper, resulting in a significant decline in yield and economic losses. Piper nigrum (black pepper) is documented as susceptible to P. capsici, whereas its close relative Piper flaviflorum is known to be resistant. However, the molecular mechanism underlying the resistance of P. flaviflorum remains obscure. In this study, we conducted a comparative transcriptome and metabolome analysis between P. flaviflorum and P. nigrum upon P. capsici infection and found substantial differences in their gene expression profiles, with altered genes being significantly enriched in terms relating to plant-pathogen interaction, phytohormone signal transduction, and secondary metabolic pathways, including phenylpropanoid biosynthesis. Further metabolome analysis revealed the resistant P. flaviflorum to have a high background endogenous ABA reservoir and time-course-dependent accumulation of ABA and SA upon P. capsici inoculation, while the susceptible P. nigrum had a high background endogenous IAA reservoir and time-course-dependent accumulation of JA-Ile, the active form of JA. Investigation of the phenylpropanoid biosynthesis metabolome further indicated the resistant P. flaviflorum to have more accumulation of lignin precursors than the susceptible P. nigrum, resulting in a higher accumulation after inoculation. This study provides an overall characterization of biologically important pathways underlying the resistance of P. flaviflorum, which theoretically explains the advantage of using this species as rootstock for the management of oomycete pathogen in black pepper production.
Keywords: Phytophthora capsici; black pepper; pathogen defense; phenylpropanoid; phytohormones.
Copyright © 2022 Fan, Tao, Xia, Sim, Hu, Wu, Wang and Hao.
Conflict of interest statement
The authors declare that the research was conducted in the absence of any commercial or financial relationships that could be construed as a potential conflict of interest.
Figures
Similar articles
-
De novo transcriptome sequencing of black pepper (Piper nigrum L.) and an analysis of genes involved in phenylpropanoid metabolism in response to Phytophthora capsici.BMC Genomics. 2016 Oct 21;17(1):822. doi: 10.1186/s12864-016-3155-7. BMC Genomics. 2016. PMID: 27769171 Free PMC article.
-
Intra species dissection of phytophthora capsici resistance in black pepper.J Adv Res. 2025 Aug;74:121-136. doi: 10.1016/j.jare.2024.10.015. Epub 2024 Oct 21. J Adv Res. 2025. PMID: 39442874 Free PMC article.
-
Transcriptome and metabolome analyses revealed the response mechanism of pepper roots to Phytophthora capsici infection.BMC Genomics. 2023 Oct 20;24(1):626. doi: 10.1186/s12864-023-09713-7. BMC Genomics. 2023. PMID: 37864214 Free PMC article.
-
The oomycete broad-host-range pathogen Phytophthora capsici.Mol Plant Pathol. 2012 May;13(4):329-37. doi: 10.1111/j.1364-3703.2011.00754.x. Epub 2011 Oct 20. Mol Plant Pathol. 2012. PMID: 22013895 Free PMC article. Review.
-
Phytophthora capsici: Recent Progress on Fundamental Biology and Disease Management 100 Years After Its Description.Annu Rev Phytopathol. 2023 Sep 5;61:185-208. doi: 10.1146/annurev-phyto-021622-103801. Epub 2023 May 31. Annu Rev Phytopathol. 2023. PMID: 37257056 Review.
Cited by
-
Transcriptome analysis of Ganoderma lingzhi (Agaricomycetes) response to Trichoderma hengshanicum infection.Front Microbiol. 2023 Feb 23;14:1131599. doi: 10.3389/fmicb.2023.1131599. eCollection 2023. Front Microbiol. 2023. PMID: 36910175 Free PMC article.
-
UHPLC-HRMS/MS Chemical Fingerprinting of the Bioactive Partition from Cultivated Piper aduncum L.Molecules. 2024 Apr 9;29(8):1690. doi: 10.3390/molecules29081690. Molecules. 2024. PMID: 38675510 Free PMC article.
-
Genome-Wide Identification, Characterization, and Expression Analysis of the MYB-R2R3 Gene Family in Black Pepper (Piper nigrum L.).Int J Mol Sci. 2024 Sep 12;25(18):9851. doi: 10.3390/ijms25189851. Int J Mol Sci. 2024. PMID: 39337340 Free PMC article.
-
Comparative transcriptome and genome analysis between susceptible Zhefang rice variety Diantun 502 and its resistance variety Diantun 506 upon Magnaporthe oryzae infection.BMC Plant Biol. 2025 Mar 17;25(1):341. doi: 10.1186/s12870-025-06357-5. BMC Plant Biol. 2025. PMID: 40091040 Free PMC article.
-
Metabolome integrated with transcriptome, and genome analysis revealed higher accumulations of phytoalexins enhance resistance against Magnaporthe oryzae in new Zhefang rice variety diantun 506.BMC Plant Biol. 2025 Jul 2;25(1):836. doi: 10.1186/s12870-025-06856-5. BMC Plant Biol. 2025. PMID: 40604494 Free PMC article.
References
-
- Cui Y., Bell A. A., Joost O., Magill C. (2000). Expression of potential defense response genes in cotton. Physiol. Mol. Plant Pathol. 56, 25–31. 10.1006/pmpp.1999.0245 - DOI
LinkOut - more resources
Full Text Sources